Biology 9700/34 — May/June 2023
Cambridge AS Level · Advanced Practical Skills · worked solutions for every part, with the mark scheme
Topics Manipulation, Measurement and Observation · Presentation of Data and Observations · Analysis, Conclusions and Evaluation · Use of the Light Microscope
Milk is a source of protein and reducing sugars. Different types of milk contain different concentrations of protein. The concentration of protein in milk can be measured using potassium hydroxide solution and copper sulfate solution.
You will investigate the protein content of milk.
You are provided with the materials shown in Table 1.1.
Table 1.1
| labelled | contents | hazard | volume/ |
|---|---|---|---|
| M | milk containing a 5.0% concentration of protein | none | 50 |
| W | distilled water | none | 100 |
| K | potassium hydroxide solution | harmful irritant | 20 |
| C | copper sulfate solution | none | 20 |
| U | milk containing an unknown concentration of protein | none | 20 |
If any solution comes into contact with your skin, wash off immediately under cold water.
It is recommended that you wear suitable eye protection.
You will prepare a range of known concentrations of protein, using the milk containing a 5.0% concentration of protein, M.
You will need to carry out a serial dilution of the milk containing 5% protein, M, to reduce the concentration of protein by half between each successive dilution.
You will need to prepare four concentrations of protein in addition to 5.0% protein, M.
After the serial dilution is completed, you will need to have of each concentration available to use.
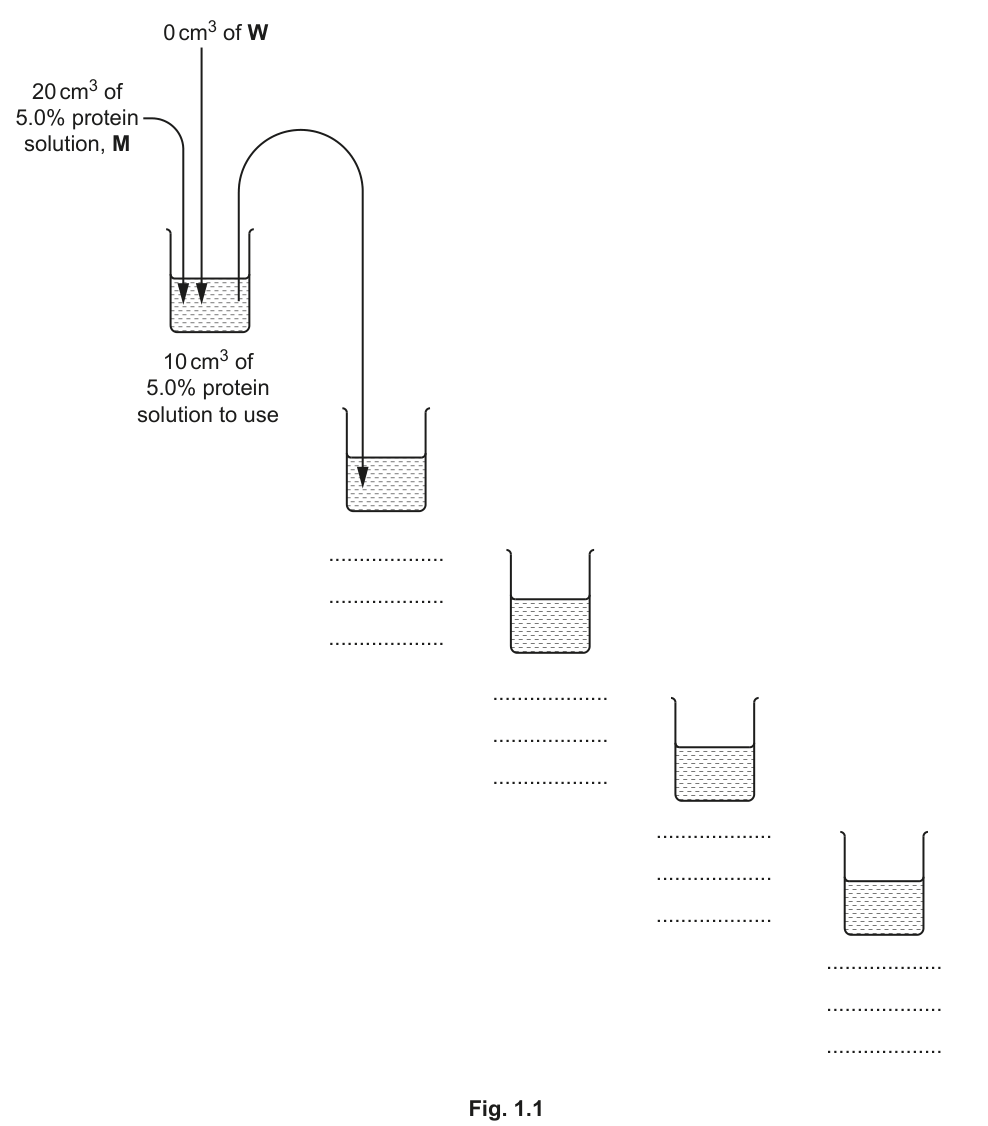
Complete Fig. 1.1 to show how you will prepare your serial dilution.
Fig. 1.1 shows the beakers you will use.
For each beaker, add labelled arrows to show:
- the volume of protein solution transferred
- the volume of distilled water, W, added.
Under each beaker, state the concentration of protein solution.
Answer
Add to Fig. 1.1:
- Beaker 2: arrow in labelled ' of protein solution transferred' from Beaker 1; arrow in labelled ' of added'. Concentration written below: .
- Beaker 3: arrow in labelled ' of protein solution transferred' from Beaker 2; arrow in labelled ' of added'. Concentration written below: .
- Beaker 4: arrow in labelled ' of protein solution transferred' from Beaker 3; arrow in labelled ' of added'. Concentration written below: .
- Beaker 5: arrow in labelled ' of protein solution transferred' from Beaker 4; arrow in labelled ' of added'. Concentration written below: .
See diagram
Background Concept
A serial dilution is a stepwise reduction in concentration in which each new solution is prepared from the previous one. Because every step uses the same volume of source solution and the same volume of diluent (in this case distilled water, ), the concentration is reduced by a constant factor at every step.
In this experiment the factor is because:
- of the previous concentration is added to of water, doubling the total volume to while the amount of protein stays the same.
- The new concentration is therefore of the previous one.
The first solution is protein (); successive dilutions therefore give , , and . After each transfer is left in the new beaker for the assay, and is carried forward to make the next dilution. This produces a calibration range — a set of standards of known concentration against which an unknown () can later be compared by colour intensity.
Understanding the Question
You are asked to complete Fig. 1.1, a diagram of five beakers. The first beaker already shows the starting of protein solution and a label saying ' of protein solution to use'. On each of the four empty beakers you must draw two arrows — one showing the volume of protein solution transferred in, and one showing the volume of water added — and write the resulting concentration below each beaker. Three marks are available: one for the four correct concentrations, one for the transfer volumes, and one for the water volumes.
Approach
- Recognise that this is a halving serial dilution: each successive beaker has half the concentration of the previous one.
- Work out the four concentrations starting from — each successive concentration is half of the one before.
- Decide on the two volumes in every beaker except the first: of protein solution carried over from the previous beaker, and of distilled water added to top up to .
- Draw the arrows and label the volumes and concentrations clearly on Fig. 1.1.
Step-by-Step Reasoning
- Beaker 1 (already drawn): of protein solution , of . is reserved for the assay; is transferred onwards.
- Beaker 2: receives of solution from Beaker 1, plus of added. Total volume , protein content unchanged. New concentration = . of this is used in the assay; is transferred onwards.
- Beaker 3: receives of from Beaker 2, plus of . New concentration = .
- Beaker 4: receives of , plus of . New concentration = .
- Beaker 5: receives of , plus of . New concentration = .
Each transfer is and each water addition is , matching the pattern that halves the concentration each time.
Key Takeaways
- In a serial dilution the volumes added at every step must be identical so that the dilution factor is the same at every step.
- A doubling of total volume with the same solute gives a halving of concentration.
- The half-dilution factor here is , giving concentrations , , , , — five standards for the colour comparison in (a)(ii).
Common Mistakes
- Putting transferred and water — this still halves concentration but the total volume is only , leaving insufficient solution for the assay.
- Forgetting to label water as or omitting the arrow into the new beaker.
- Halving only the percentage figure without checking that the total volume doubles, which gives wrong arithmetic.
- Missing the '%' symbol on the concentrations written under each beaker.
Things to Be Careful About
- The first beaker has of water and does not require a transfer-in arrow; it already shows a transfer-out arrow.
- All percentages must be written to the correct precision — note that and have three and four significant figures respectively.
- Ensure the arrows clearly indicate which beaker they come from and which they go into; the labels should match the volumes used.
Carry out step 1 to step 7.
step 1 Prepare the concentrations of protein, as shown in Fig. 1.1, in the beakers provided. Mix well.
step 2 Label the test-tubes provided with the concentrations of protein prepared in step 1.
step 3 Put of each concentration of protein solution into the appropriately labelled test-tube.
step 4 Put of K into each of the labelled test-tubes. Shake gently to mix.
step 5 Put of C into each of the labelled test-tubes. Shake gently to mix.
step 6 Leave for 2 minutes for the colour to change.
step 7 Observe the colour in each test-tube and compare with the colours in Fig. 1.2. You will see the same colour in more than one test-tube. Record your observations in (a)(ii) using only the colours shown in Fig. 1.2.

Record your observations in an appropriate table.
You may record the same colour for more than one test-tube.
Answer
| concentration of protein / % | colour |
|---|---|
| dark purple | |
| purple | |
| light purple | |
| blue | |
| blue |
Highest concentration dark purple, lowest blue (see table).
Background Concept
The biuret test uses potassium hydroxide () and copper sulfate () to detect peptide bonds in proteins. In the presence of protein, copper(II) ions in alkaline solution form a violet/purple coordination complex with the nitrogen atoms of the peptide bond. The intensity of the purple colour increases with the concentration of protein.
This is a semi-quantitative test: it can be used to rank protein concentration, but only by eye against a colour key. A more rigorous version uses a colorimeter to measure absorbance.
In this experiment you made five protein standards of known concentration by serial dilution and ran the biuret test on each. Comparing the colour of the unknown () with these standards lets you estimate its protein concentration.
Understanding the Question
After mixing each standard with and and waiting , you record the colour of each tube and enter it in a table. The colours must come from the key in Fig. 1.2 — dark purple, purple, light purple, blue. You may record the same colour in more than one tube (e.g. the most dilute tubes may both be blue).
Three marks are available: one for both column headings (percentage concentration and colour); one for using only the colours from the key; one for showing the correct trend (the highest concentration is the darkest purple and the lowest is the lightest).
Approach
- Decide the two column headings: percentage concentration of protein (or milk) and colour. Each heading must include a quantity or label, and units where appropriate.
- Match each tube's observed colour to the nearest colour in Fig. 1.2 — dark purple, purple, light purple or blue.
- Order the colours from darkest (highest concentration) to lightest (lowest concentration).
Step-by-Step Reasoning
The biuret complex absorbs light at , giving a violet/purple colour whose intensity rises with protein concentration. The standard solution is so concentrated that it gives the strongest possible biuret colour, dark purple. As the concentration halves, less biuret complex forms, so the colour becomes less intense: → purple; → light purple. Below about there is so little complex that the blue colour of the copper sulfate reagent dominates — both and tubes appear blue.
A correct table therefore looks like the one in the solution.
Key Takeaways
- A results table needs a heading for every column; if a heading is a measured quantity, include the unit.
- The biuret test gives a colour whose intensity increases with protein concentration, but the response is non-linear: very dilute samples look blue (the colour of the copper reagent itself), not just pale purple.
- Matching observations against a colour key is the basis of semi-quantitative analysis; the unknown can later be compared to this same key.
Common Mistakes
- Using one of the colours without writing it as a heading ('colour' as the column heading is essential).
- Putting only one colour per tube (the question explicitly allows the same colour in more than one tube).
- Swapping the order (e.g. blue at , dark purple at ) — this is a chemistry error, not just a recording error.
- Writing '%' without the percentage value, or writing the colour name without the heading.
Things to Be Careful About
- The accepted units here are the percentage symbol % written next to the heading (e.g. concentration of protein / %).
- Stay strictly within the four allowed colours — do not invent intermediate shades such as 'very pale purple' or 'green'.
- Record the observation (not what you think should be there). The mark scheme accepts the actual observation as long as it uses a colour from the key.
Carry out step 8 to step 9.
step 8 Stir U and put of U into a test-tube.
step 9 Repeat step 4 to step 7 with U. Record the colour in (a)(iii).
State the colour for sample U.
colour for sample U = ______
Answer
colour for sample = dark purple
dark purple
Background Concept
The biuret test detects peptide bonds. The intensity of the violet/purple colour formed with copper(II) ions in alkali is proportional to protein concentration. By matching the colour of an unknown () to the colours produced by known standards, the unknown's concentration can be estimated.
The colour key in Fig. 1.2 ranks the colours from most intense biuret reaction (dark purple) to least intense (blue, the colour of the copper reagent itself).
Understanding the Question
You repeat steps 4–7 on the unknown milk sample and record the colour you see in a single word drawn from Fig. 1.2. The mark scheme accepts dark purple or purple because both indicate a high protein concentration in .
Approach
- After adding and to of and waiting , compare the colour to the four blocks in Fig. 1.2.
- Pick the closest match.
Step-by-Step Reasoning
The unknown was prepared and the biuret reaction carried out. The colour observed in matched either the dark-purple or purple block in Fig. 1.2, indicating that has a high protein concentration similar to the or standard.
Key Takeaways
- A qualitative observation is recorded using a single descriptor from the reference key.
- The same colour can describe different concentrations — the matching is to nearest reference, not to a unique value.
Common Mistakes
- Inventing a colour not in the key (e.g. 'violet' or 'mauve').
- Writing the heading ('colour:') as well as the colour; the answer slot only asks for the colour word.
Things to Be Careful About
- The colour must come only from the four listed in Fig. 1.2.
- The observation is what you actually saw; if it looks between two adjacent blocks, choose the closer one.
Use your results in (a)(ii) and (a)(iii) to estimate the protein concentration in U.
Answer
Protein concentration of (matches the colour of the protein standard).
[If matched dark purple, the concentration is .]
≈ 2.5%
Background Concept
This is a colorimetric estimation: an unknown concentration is found by comparing the colour produced by the unknown with the colours produced by a series of standards of known concentration. The closer the match, the closer the concentration.
The biuret test is semi-quantitative: it can rank order concentrations and bracket an unknown between two adjacent standards, but it cannot give an exact value unless a calibration curve is constructed with a colorimeter.
Understanding the Question
Using your observation from (a)(ii) and the colour you recorded for in (a)(iii), you are asked to estimate the protein concentration of . The mark scheme accepts any answer that is consistent with the candidate's own observations.
Approach
- Compare the colour recorded for in (a)(iii) with the table in (a)(ii).
- If it matches a specific standard, give that concentration. If it lies between two standards, give the closer match.
Step-by-Step Reasoning
If was the same colour as the standard (purple), then contains about protein. If it was the same colour as the standard (dark purple), then contains protein. If it looked paler than the standard but darker than the standard, the concentration lies between and and would be reported as the closer match (e.g. or ).
The mark scheme gives the candidate credit for any answer that follows from their own observations.
Key Takeaways
- Colorimetric estimation is a useful quick method but its precision is limited by the discrete colour steps and by the human eye.
- Always report the estimate with reference to the matching standard (i.e. say which colour matched), not as a free-standing number.
Common Mistakes
- Stating a concentration with too many significant figures (e.g. '2.497%') when the method only supports one or two.
- Reporting a colour rather than a concentration.
- Ignoring your own observations and giving the 'expected' answer.
Things to Be Careful About
- The estimate must be tied to your (a)(ii) and (a)(iii) results; it is not a fixed number.
Describe one significant source of error when carrying out step 7 and suggest an improvement to reduce this error.
source of error ______
improvement ______
Answer
Source of error: the colour change is subjective — different observers (or the same observer at different times) may judge the colour differently, especially between two adjacent colours in the key.
Improvement: use a colorimeter to measure the absorbance (or percentage transmission) of each tube at the appropriate wavelength — this gives an objective numerical value for each concentration.
Colour change is subjective; use a colorimeter.
Background Concept
In a colour-based assay, the result depends on the observer's eye and judgement. Two observers looking at the same tube can legitimately disagree, especially if the colour lies between two entries in the colour key. The mark scheme explicitly treats 'colour change is subjective' as the most significant error here.
A colorimeter measures how much light of a chosen wavelength is transmitted through the solution, giving an absorbance value that is directly proportional to the concentration of the absorbing species. This removes the observer's judgement from the measurement.
Understanding the Question
You must identify one significant source of error in step 7 (observing the colour in each tube) and suggest an improvement. The error and improvement must be a matched pair — the improvement must address the specific error.
Approach
- Identify the most significant limitation of the eye-based comparison.
- Match it with the appropriate instrument-based or procedural improvement.
Step-by-Step Reasoning
The colour judgement is the key step in step 7 and is what limits the accuracy of the protein concentration estimate in (a)(iv). Replacing visual judgement with a colorimeter measurement removes the subjectivity and produces a numerical absorbance for each tube that can be plotted as a calibration curve.
Other valid error/improvement pairs exist (e.g. incomplete mixing → mix more thoroughly; bubbles in the cuvette → tap to remove; reagent not fresh → use freshly prepared reagent) but the mark scheme credits colour subjectivity / colorimeter as the principal answer.
Key Takeaways
- Errors and improvements must come as a pair: the improvement must address the named error.
- Colorimetric assays convert a subjective colour judgment into a quantitative absorbance measurement.
- A colorimeter also allows a calibration curve to be drawn, which makes the unknown concentration much more precise than a colour-by-eye match.
Common Mistakes
- Naming a general error such as 'human error' or 'measurement error' without saying what the human is judging.
- Pairing the error with an unrelated improvement (e.g. 'colour is subjective → repeat the experiment').
- Suggesting an improvement that does not address the named error (e.g. 'colour is subjective → wear goggles').
Things to Be Careful About
- 'Use a colorimeter' is the standard accepted improvement; the colorimeter is calibrated with a blank of water plus reagents (no protein) before measuring the standards.
- The improvement should be specific: it should name the instrument (colorimeter) and what it measures (absorbance / transmission).
Suggest how you would modify the experiment to determine the concentration of reducing sugars in a sample of milk.
Answer
- Use Benedict's solution instead of potassium hydroxide () and copper sulfate ().
- Heat the mixture in a water bath at (Benedict's reagent requires heat to reduce copper(II) to copper(I) oxide by the reducing sugar).
- Either time how long it takes for the first permanent colour change to appear, or compare the final colour with standards of known reducing-sugar concentration to determine the concentration.
Use Benedict's solution; heat ≥ 80 °C; time to first colour change or compare with standards.
Background Concept
Benedict's test detects reducing sugars (monosaccharides and some disaccharides — lactose is a reducing sugar because its glucose unit has a free anomeric carbon). The reagent contains copper(II) sulfate in alkaline citrate. When heated with a reducing sugar, the blue is reduced to a brick-red precipitate of copper(I) oxide, .
The colour sequence on heating is:
The intensity of the final colour, or the time taken to reach the first permanent colour change, is proportional to the concentration of reducing sugar.
The test must be heated to at least about to give the reaction enough activation energy; below this temperature the reduction is too slow.
Understanding the Question
You are asked to suggest how to modify the protein assay (biuret) to determine the concentration of reducing sugars in a milk sample. Three marks are available: one for naming the correct reagent (Benedict's solution), one for the heating step (), and one for an objective endpoint (timing the first colour change or comparing against known standards).
Approach
- Identify the standard test for reducing sugars.
- Recall its key reagent and reaction conditions.
- Identify a way to make the result quantitative.
Step-by-Step Reasoning
- The biuret test detects peptide bonds; it does not detect sugars. The test for reducing sugars uses Benedict's solution — this replaces both and in the original protocol.
- The Benedict's reaction only proceeds at high temperature. A water bath at provides a uniform, controllable heat source.
- The endpoint of the test is colour change (blue → green/yellow/orange/brick red). To make this quantitative, either:
- record the time taken to reach the first permanent colour change (a faster change indicates a higher concentration); or
- run standard solutions of known reducing-sugar concentration in parallel and compare the final colour intensity, exactly as the biuret standards are used here.
Key Takeaways
- The biuret test (protein) and the Benedict's test (reducing sugar) look superficially similar (both use alkaline copper) but they detect different functional groups and have different reaction conditions.
- Benedict's requires heat; biuret does not.
- Quantitative endpoints in colour-based assays are obtained by timing the colour change or by comparing against a standard series.
Common Mistakes
- Suggesting 'use iodine' (that detects starch, not reducing sugar).
- Saying 'heat' without specifying the temperature, or heating at boiling for too long (Benedict's reagent can decompose).
- Suggesting a non-quantitative endpoint (e.g. 'record whether the colour changes') — the question asks how to determine the concentration, so the endpoint must allow a concentration to be read.
Things to Be Careful About
- The temperature threshold of is required — simply 'heat' is too vague.
- Benedict's solution is itself blue, so a colour change rather than a colour intensity is the usual endpoint.
- The Benedict's reaction needs an alkaline environment, but the test does not need a separately added alkali — the alkali is built into the reagent.
Milk can be made from plant sources.
A scientist compared the protein content in milk from cows with milk produced from different plants.
The results are shown in Table 1.2.
Table 1.2
| type of milk | protein content / g per |
|---|---|
| cow (C) | 3.400 |
| almond (A) | 0.575 |
| cashew (H) | 2.250 |
| oat (O) | 0.400 |
| soya (S) | 3.325 |
Plot a bar chart of the data shown in Table 1.2 on the grid in Fig. 1.3.
Use a sharp pencil.

Answer
- x-axis label: type of milk
- x-axis categories (left to right): C, A, H, O, S
- y-axis label: protein content / g per
- y-axis scale: to (or ), with labels every unit
- Bars (heights):
- C:
- A:
- H:
- O:
- S:
All bars are of equal width and separated by equal gaps.
See bar chart
Background Concept
A bar chart is used to display categorical data — discrete groups such as types of milk. Each bar represents one category, and the height represents the value of the variable being measured. Bar charts are not the same as histograms (which show continuous data with no gaps between bars).
For a correctly drawn bar chart:
- the x-axis carries the category labels;
- the y-axis carries the variable name and its unit;
- the y-axis scale must use at least half the grid and the major divisions must be labelled at regular intervals;
- all bars must be the same width and separated by equal gaps;
- the bars must meet the baseline exactly and have vertical sides.
Understanding the Question
You are given five protein-content values for five milks (C, A, H, O, S) and must plot them as a bar chart on Fig. 1.3. Four marks are available: one for correct axis labels and category labels; one for an appropriate scale and labelling; one for correct bar heights; one for correctly drawn bars.
Approach
- Choose the y-axis scale to fit the largest value () with a little headroom — for example 0 to 3.5 (or 4).
- Decide the major divisions — every 0.5 or 1 unit works (mark scheme requires labels every 2 cm of grid).
- Draw five bars of equal width, one per category, with heights corresponding to the data.
Step-by-Step Reasoning
- Axis labels: x-axis = 'type of milk'; y-axis = 'protein content / g per '. The category labels C, A, H, O, S go under the five bars.
- Scale: the largest value is ; using a scale of 0 to (or 4) leaves a small margin. Each 1-unit division is labelled; if each grid square is , a 2 cm scale mark every 0.5 unit may be used.
- Bar heights:
- C:
- A:
- H:
- O:
- S:
- Bar construction: five separate bars, equal width, equal gaps, vertical sides, flat top, all meeting the x-axis.
Key Takeaways
- A bar chart's axis scale should span from 0 to slightly above the largest value, with sensible divisions.
- All bars must have the same width, separated by consistent gaps.
- The axis label must include both the variable name and the unit.
Common Mistakes
- Using a discontinuous or odd-numbered scale (e.g. 0 to 3.7 with arbitrary divisions).
- Drawing bars of unequal widths or with no gaps (this turns the bar chart into a histogram).
- Sloping or curved tops to the bars — bars must have a flat top and vertical sides.
- Forgetting the unit on the y-axis label.
Things to Be Careful About
- The plot must be drawn with a sharp pencil; the mark scheme explicitly asks for this.
- Mark scheme guidance is that bars should be drawn with 'vertical lines and meeting horizontal lines exactly'.
One of the reducing sugars found in cow's milk is lactose. Some people are intolerant to lactose and cannot digest it. A method of producing lactose-free milk is to treat cow's milk with the enzyme lactase.
Lactase hydrolyses lactose to produce glucose and galactose.
A scientist investigated the effect of different lactase concentrations on the mass of lactose converted to glucose and galactose in 10 minutes.
The scientist plotted a graph of the results, shown in Fig. 1.4.
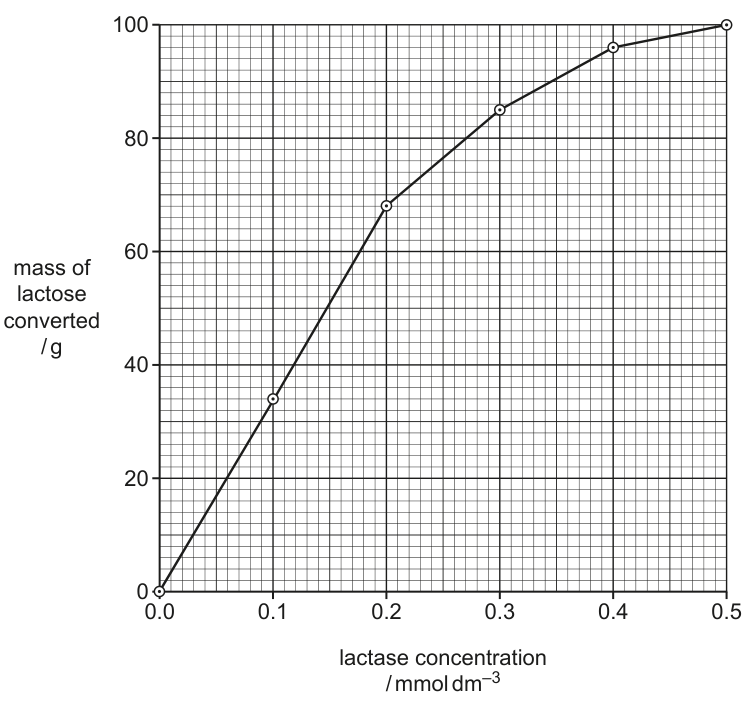
Use the graph in Fig. 1.4 to determine the mass of lactose converted when of lactase is used.
Show your working on the graph.
mass of lactose = ______
Answer
mass of lactose converted =
[Indication on graph: vertical line at up to the curve, then horizontal line to the y-axis, reading .]
5.4 g
Background Concept
A continuous curve on a graph can be read at any intermediate value by drawing a construction line. For a given x-value, draw a vertical line up to the curve and a horizontal line across to the y-axis; the intersection on the y-axis is the y-value at that x. This is the standard 'dot-to-dot-to-axis' reading technique.
Understanding the Question
You are given a graph of mass of lactose converted against lactase concentration (Fig. 1.4) and asked to find the mass converted when the lactase concentration is . The answer must be shown on the graph (the indication lines are drawn in pencil) and then written in the answer space. One mark for the indication, one for the numerical answer.
Approach
- Find on the x-axis.
- Move vertically up to the curve.
- Move horizontally across to the y-axis.
- Read the y-value at that point.
Step-by-Step Reasoning
The graph curves from through , , , to . At , the curve lies between the and points, closer to . A vertical line from meets the curve at a y-value of approximately (linear interpolation: ).
Per the mark scheme the accepted reading is .
Key Takeaways
- Curve-reading requires drawing perpendicular construction lines, not estimating by eye.
- A reading from a curve between two plotted points is approximate; the precision is limited by the grid and the steepness of the curve.
Common Mistakes
- Reading off the curve at the wrong x-value (e.g. at on the y-axis by mistake).
- Forgetting to indicate on the graph — both the indication and the value earn marks.
- Reporting a value without units.
Things to Be Careful About
- The y-axis unit is grams (); the x-axis unit is .
- The value should be recorded to a sensible precision (1–2 significant figures based on the grid).
Calculate the rate of lactose conversion when of lactase is used.
______
Working
[Per the mark scheme the accepted answer is .]
Answer
Rate =
5.8 g min⁻¹
Background Concept
A rate is the amount of change per unit time. For an enzyme-catalysed reaction the rate of substrate conversion is:
The graph in Fig. 1.4 already shows the mass converted in 10 minutes for each lactase concentration; to get the rate at any one concentration, divide that mass by .
Understanding the Question
You are asked to calculate the rate of lactose conversion when the lactase concentration is . The mass converted in is taken from (c)(i), and the time is given in the question stem ('in 10 minutes').
Approach
- Use the mass value from (c)(i).
- Divide by .
- Quote with units .
Step-by-Step Reasoning
At , the curve reads approximately converted in . The rate is therefore:
The mark scheme records as the accepted answer (likely because the curve passes slightly above the linear interpolation at , giving a reading closer to ).
Key Takeaways
- Converting a mass-over-a-fixed-period reading into an instantaneous rate is a simple division by the time interval.
- Always quote the rate with units that combine the original quantity and the time, here .
Common Mistakes
- Forgetting the time division (giving instead of or ).
- Writing the rate as 'per 10 minutes' instead of per minute.
- Omitting the unit entirely.
Things to Be Careful About
- A rate has units of quantity per unit time; here that is , not just .
- The graph shows a total; this is not the rate itself.
Explain the shape of the graph between and of lactase.
Answer
- Between and lactase, the concentration of enzyme molecules is higher, so more active sites are available to bind substrate.
- This increases the frequency of successful collisions between enzyme active sites and lactose molecules.
- More enzyme-substrate complexes therefore form per unit time, so the rate of lactose conversion increases (steep positive gradient of the curve).
More enzyme molecules → more active sites → more successful collisions → more ES complexes form.
Background Concept
Enzymes catalyse reactions by binding substrate molecules at their active sites to form enzyme-substrate (ES) complexes, which then break down into product + free enzyme. The rate at which substrate is converted depends on:
- the concentration of enzyme (more enzyme molecules → more active sites available);
- the concentration of substrate (more substrate → more frequent productive collisions);
- collision frequency and orientation (collision theory);
- the proportion of active sites occupied (which is what makes the curve level off at high enzyme concentration).
In this experiment the substrate concentration is fixed; the only thing changing is the enzyme (lactase) concentration. At low enzyme concentrations, there are too few active sites to handle all the substrate that is theoretically available, so the rate rises steeply as more enzyme is added. Eventually, when almost all substrate molecules are bound to active sites at any instant, the curve plateaus — this is the part of the graph approaching .
Understanding the Question
You are asked to explain the shape of the graph between and lactase. In this region the curve is steep and rising roughly linearly — the rate increases almost in proportion to the enzyme concentration. Three marks are available for linking enzyme concentration → active sites → collisions → ES complexes.
Approach
- Identify what changes as the enzyme concentration rises (more enzyme molecules → more active sites).
- State the immediate consequence on collisions with substrate.
- State the consequence on enzyme-substrate complex formation, and hence on rate.
Step-by-Step Reasoning
- At lactase there is a certain number of enzyme molecules, each with one active site. Many lactose molecules are present in excess, so not all of them are being converted at any one instant.
- Increasing the lactase concentration to doubles the number of enzyme molecules and therefore doubles the number of active sites available to bind substrate.
- The probability that a lactose molecule will encounter an active site and bind successfully is now greater, so the frequency of successful collisions between enzyme and substrate rises.
- As a result more ES complexes form per unit time, and each complex gives product faster. The curve therefore rises steeply in this region.
Key Takeaways
- At low enzyme concentrations (relative to substrate), the rate is limited by enzyme availability: doubling the enzyme roughly doubles the rate.
- The shape of the curve reflects a transition from enzyme-limited kinetics (steep) to substrate-limited kinetics (plateau).
- Linking rate to active sites, collisions and ES complexes is the canonical way to explain an enzyme rate curve.
Common Mistakes
- Saying 'more enzyme → faster reaction' without naming the active sites (the mark scheme explicitly requires this link).
- Mentioning only 'more collisions' without distinguishing successful (oriented, energetic) collisions.
- Confusing the roles of enzyme and substrate — the substrate concentration is fixed here.
Things to Be Careful About
- The question asks specifically about the – region, where the curve is steep and the rate is increasing. Outside this region the explanation must be different (e.g. the plateau is explained by substrate becoming limiting, not by enzyme being limiting).
The rest of this paper
1 more questions- Q2Use of the Light Microscope18M