Biology 9700/31 — May/June 2023
Cambridge AS Level · Advanced Practical Skills · worked solutions for every part, with the mark scheme
Topics Use of the Light Microscope · Manipulation, Measurement and Observation
Yeast cells contain the enzyme catalase which catalyses the breakdown of hydrogen peroxide, releasing oxygen.
You will investigate the effect of pH on the activity of catalase in an extract from yeast cells.
You will need to immobilise the yeast cells in sodium alginate beads.
When a bead containing yeast cells is dropped into hydrogen peroxide solution the bead will sink. As oxygen is released the bead will rise. The more oxygen released, the faster the bead will rise.
You are provided with the materials shown in Table 1.1.
Table 1.1
| labelled | contents | hazard | volume / |
|---|---|---|---|
| Y | yeast cell suspension | none | 15 |
| H | 3.0% hydrogen peroxide solution | harmful irritant | 30 |
| S | sodium alginate solution | none | 30 |
| C | calcium chloride solution | none | 30 |
| B3 | buffer pH 3 | none | 10 |
| B4 | buffer pH 4 | none | 10 |
| B6 | buffer pH 6 | none | 10 |
| B7 | buffer pH 7 | none | 10 |
| B8 | buffer pH 8 | none | 10 |
If any solution comes into contact with your skin, wash off immediately under cold water.
It is recommended that you wear suitable eye protection.
Carry out step 1 to step 19.
step 1 Put of C into a large test-tube.
step 2 Put of S into a small beaker.
step 3 Stir Y and put of Y into the beaker used in step 2. Mix well.
step 4 Use a syringe to collect of the mixture of S and Y (prepared in step 3).
step 5 Position the syringe over the large test-tube containing C as shown in Fig. 1.1.
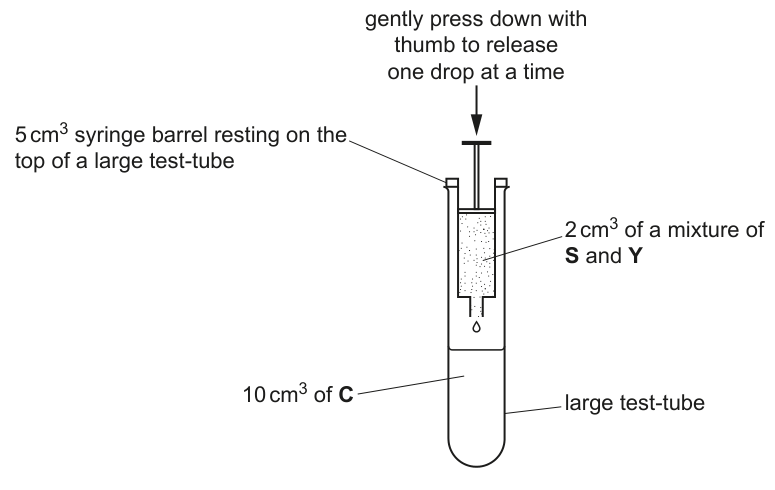
step 6 Gently press down on the plunger of the syringe with your thumb to release one drop into solution C. The drop should form a bead.
step 7 Repeat step 6 until you have used all of the mixture. Leave the beads in the solution C for 1 minute.
step 8 Tip the contents of the large test-tube from step 7 into a Petri dish.
step 9 Put two beads into each of the beakers containing pH buffers B3, B4, B6, B7 and B8.
step 10 Label a small test-tube B3.
step 11 Put of the pH buffer B3 into the test-tube labelled B3.
step 12 Put of hydrogen peroxide solution, H, into this test-tube and shake to mix. Leave this test-tube in a test-tube rack.
step 13 Pick up a bead from the pH buffer B3 using blunt forceps.
step 14 Drop the bead into the test-tube from step 12. Start timing when the bead reaches the bottom of the test-tube.
step 15 Time how long it takes for the bead to reach the surface of the liquid. If the bead does not reach the surface after 60 seconds, stop timing and record as 'more than 60'.
step 16 Record the result from step 15 in (a)(i).
step 17 Pick up the second bead from the pH buffer B3 using blunt forceps.
step 18 Repeat step 14 to step 16.
step 19 Repeat step 10 to step 18 with the remaining pH buffers instead of B3.
Record your results in an appropriate table.
State the independent variable in this investigation.
State one significant source of error in this investigation.
You will need to estimate the pH of the solution, U.
You are provided with U, as shown in Table 1.2.
Table 1.2
| labelled | contents | hazard | volume / |
|---|---|---|---|
| U | solution of unknown pH | none | 10 |
If U comes into contact with your skin, wash off immediately under cold water.
It is recommended that you wear suitable eye protection.
Carry out step 20 to step 27.
step 20 Put one bead into the beaker containing solution U.
step 21 Label a clean test-tube U.
step 22 Put of solution U into the test-tube labelled in step 21.
step 23 Put of hydrogen peroxide solution into this test-tube. Leave this test-tube in a test-tube rack.
step 24 Pick up the bead from the beaker containing solution U, using blunt forceps.
step 25 Drop the bead into the test-tube from step 23. Start timing when the bead reaches the bottom of the test-tube.
step 26 Time how long it takes for the bead to reach the surface of the liquid. If the bead does not reach the surface after 60 seconds, stop timing and record as 'more than 60'.
step 27 Record the result from step 26 in (a)(iv).
State the result for solution U.
result for solution U = ______
Using your results from (a)(i) and (a)(iv), estimate the pH of solution U.
pH of solution U = ______
In the procedure described in step 1 to step 19, the effect of pH on catalase activity was investigated.
Describe how you would modify this procedure to investigate the effect of concentration of substrate on the time taken for the beads to rise.
Immobilised enzymes are often used in industry. For example the enzyme lactase is used to produce lactose-free milk.
A student measured the initial rate of reaction of human lactase at different concentrations of lactose and plotted a graph, as shown in Fig. 1.2.
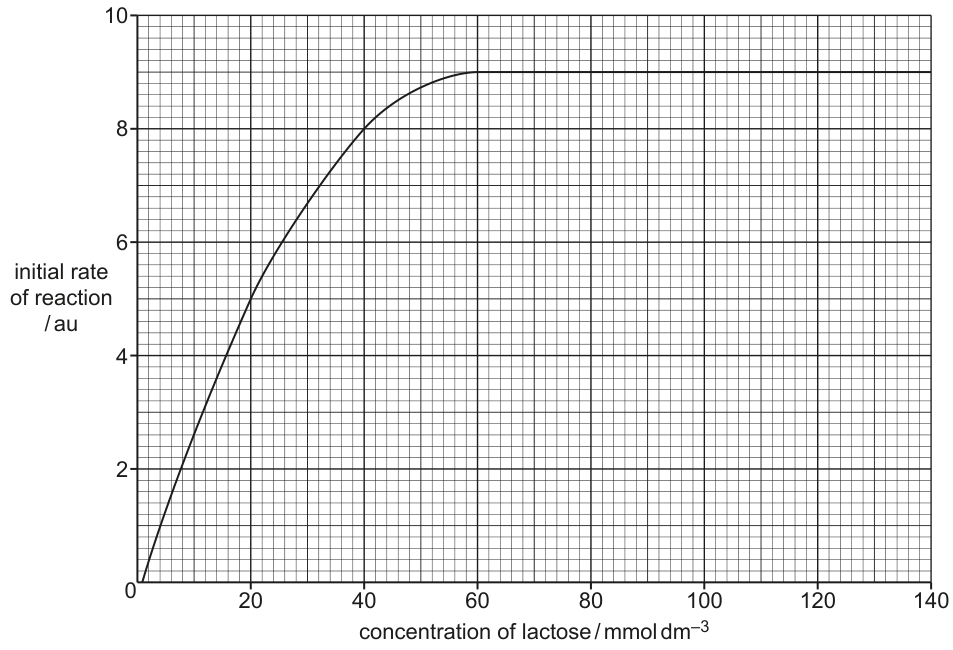
Explain the change in the initial rate of reaction between:
and of lactose
and of lactose.
Use the graph in Fig. 1.2 to estimate the Michaelis-Menten constant () of lactase.
Show your working on the graph in Fig. 1.2.
= ______
Lactose is found in the milk of many mammals.
A scientist investigated the concentration of lactose in the milk of different mammals.
Table 1.3 shows the results of this investigation.
Table 1.3
| type of mammal | concentration of lactose / |
|---|---|
| rabbit (RA) | 60.0 |
| seal (SE) | 2.5 |
| goat (GO) | 137.5 |
| sheep (SH) | 150.0 |
| horse (HO) | 222.5 |
Plot a bar chart of the data shown in Table 1.3 on the grid in Fig. 1.3.
Use a sharp pencil.

The rest of this paper
1 more questions- Q2Use of the Light Microscope · Manipulation, Measurement and Observation20M