Biology 9700/35 — October/November 2022
Cambridge AS Level · Advanced Practical Skills · worked solutions for every part, with the mark scheme
Topics Manipulation, Measurement and Observation · Presentation of Data and Observations · Analysis, Conclusions and Evaluation · Use of the Light Microscope
Yeast cells contain the enzyme catalase which catalyses the breakdown of hydrogen peroxide, releasing oxygen.
You will investigate the effect of substrate concentration on the activity of catalase in yeast.
You will need to immobilise the yeast in sodium alginate beads.
When a bead containing yeast is dropped into hydrogen peroxide solution the bead will sink. As oxygen is released the bead will rise. The faster the oxygen is released, the faster the bead will rise.
You are provided with the materials shown in Table 1.1.
Table 1.1
| labelled | contents | hazard | volume / |
|---|---|---|---|
| Y | 7.0% yeast cell suspension | none | 15 |
| H | 6.0% hydrogen peroxide solution | harmful irritant | 30 |
| S | 2.0% sodium alginate solution | none | 30 |
| W | distilled water | none | 100 |
| C | 1.5% calcium chloride solution | none | 30 |
If any solution comes into contact with your skin, wash off immediately under cold water.
It is recommended that you wear suitable eye protection.
Carry out step 1 to step 7 to immobilise the yeast.
step 1 Put of C into a large test-tube.
step 2 Put of S into a small beaker.
step 3 Stir Y and put of Y into the beaker used in step 2. Mix well.
step 4 Use a syringe to collect of the mixture of S and Y (prepared in step 3).
step 5 Position the syringe over the large test-tube containing C as shown in Fig. 1.1.
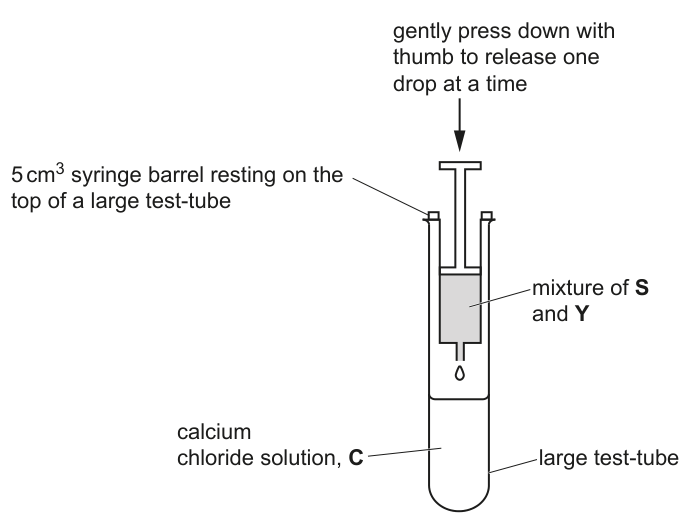
step 6 Gently press down on the plunger of the syringe with your thumb to release one drop into solution C. The drop should form a bead.
step 7 Repeat step 6 until you have used all of the mixture.
You will use these beads in step 11.
You will need to carry out a serial dilution of the 6.0% hydrogen peroxide solution, H, to reduce the concentration by half between each successive dilution.
You will need to prepare four concentrations of solution in addition to the 6.0% hydrogen peroxide solution, H.
After the serial dilution is completed, you will need to have of each concentration available to use.
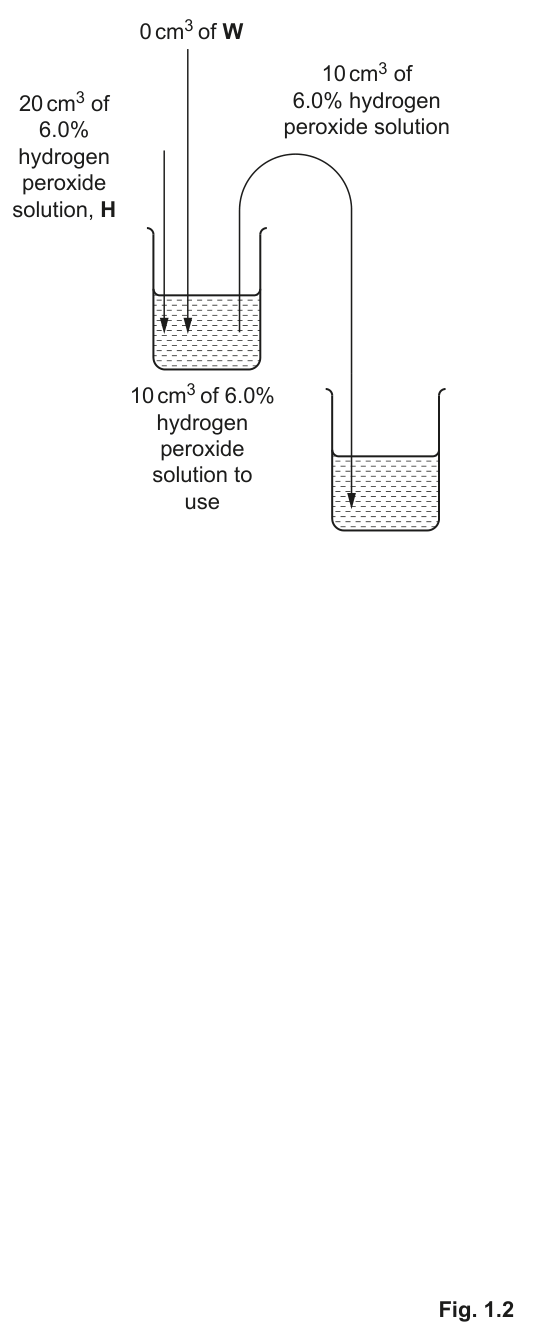
Complete Fig. 1.2 to show how you will prepare your serial dilution.
Fig. 1.2 shows the first two beakers you will use to make your serial dilution. You will need to draw three additional beakers.
For each beaker add labelled arrows to show:
- the volume of hydrogen peroxide solution transferred
- the volume of distilled water, W, added.
Under each beaker, state the concentration of hydrogen peroxide solution.
Answer
The completed serial dilution has five beakers. from the previous beaker is added to of distilled water () in the next beaker, halving the concentration each time. is then removed from each beaker for use.
| Beaker | Volume of transferred | Volume of added | Concentration |
|---|---|---|---|
| 1 | (start: of 6.0%) | 6.0% | |
| 2 | of 6.0% | 3.0% | |
| 3 | of 3.0% | 1.5% | |
| 4 | of 1.5% | 0.75% | |
| 5 | of 0.75% | 0.375% |
Five beakers with concentrations 6.0%, 3.0%, 1.5%, 0.75% and 0.375%; each new beaker receives 10 cm³ from the previous beaker plus 10 cm³ of W.
Background Concept
A serial dilution is a stepwise reduction in concentration of a stock solution, in which each step uses a fixed volume of the previous dilution and a fixed volume of diluent (here, distilled water ). When equal volumes are mixed, the volume doubles while the amount of solute is unchanged, so the concentration is halved. Repeating the process produces a geometric series: of the original.
The general relationship is:
For equal volumes this simplifies to .
Serial dilutions are used to produce a range of known concentrations from a single stock — for example, to investigate how reaction rate depends on substrate concentration, or to estimate an unknown by interpolation between two known standards.
Understanding the Question
The question gives beaker 1 (already containing of 6.0% ) and the start of the dilution in beaker 2 (receiving from beaker 1). The student must:
- Complete the labels on beaker 2 (volume of added, concentration).
- Add three more beakers (3, 4, 5) with arrows showing the volume transferred from the previous beaker and the volume of water added.
- State the concentration of beneath each beaker.
Four concentrations are needed in addition to the original 6.0%, so the final concentrations are 3.0%, 1.5%, 0.75% and 0.375%.
Approach
At each step mix equal volumes of the previous solution and distilled water. Because the total volume is doubled while the amount of is unchanged, the concentration halves. Apply this rule four times starting from 6.0% to obtain the remaining four concentrations.
Step-by-Step Reasoning
-
Beaker 1 (given): of 6.0% . of added. removed for use. Concentration = 6.0%.
-
Beaker 2: of 6.0% is transferred from beaker 1 and of is added. Total = . Concentration . removed for use.
-
Beaker 3: of 3.0% is transferred from beaker 2 and of is added. Concentration . removed for use.
-
Beaker 4: of 1.5% is transferred from beaker 3 and of is added. Concentration . removed for use.
-
Beaker 5: of 0.75% is transferred from beaker 4 and of is added. Concentration . removed for use.
Key Takeaways
- A serial dilution by halving uses equal volumes of the previous concentration and the diluent at each step.
- The concentration halves at each step because the volume doubles while the amount of solute stays the same.
- Five beakers give concentrations of 6.0%, 3.0%, 1.5%, 0.75% and 0.375%.
- Every beaker must show two arrows: the volume transferred from the previous beaker and the volume of added.
Common Mistakes
- Thinking the concentration is unchanged when water is added: a common error is to forget that the total volume has increased. The concentration halves only because the volume doubles.
- Arithmetic slip in the halving: writing 1.0% or 2.0% instead of 1.5%, or 0.5% instead of 0.375%. Work step by step: .
- Missing the water arrow or the transfer arrow: each beaker needs both, and each arrow needs a labelled volume.
- Wrong transfer volume: transferring a different volume at one step breaks the halving pattern for every subsequent beaker.
Things to Be Careful About
- The final beaker contains , which is one-eighth of the original 6.0% — a quarter of , not half.
- The concentration must be written with the % symbol under every beaker, including beaker 1 (where it is already given).
- Arrows must clearly distinguish the transfer of solution from the addition of — typically a curved arrow leaving the previous beaker for the transfer, and a straight downward arrow into the new beaker for the water.
Carry out step 8 to step 16.
step 8 Prepare the concentrations of hydrogen peroxide solution, as decided in (a)(i), in the beakers provided.
step 9 Label the small test-tubes with the concentrations you prepared in step 8.
step 10 Put of each hydrogen peroxide concentration into the appropriately labelled test-tube. Leave these test-tubes in a test-tube rack.
step 11 Tip the contents of the large test-tube from step 7 into a Petri dish.
step 12 Pick up a bead using blunt forceps.
step 13 Drop the bead into the test-tube containing 6.0% hydrogen peroxide solution, H. Start timing when the bead reaches the bottom of the test-tube. If the bead does not sink to the bottom of the test-tube, record the time as zero.
step 14 Time how long it takes for the bead to reach the surface of the hydrogen peroxide solution. If the bead does not reach the surface after 180 seconds, stop timing and record as 'more than 180'.
step 15 Record the result from step 14 in (a)(ii).
step 16 Repeat step 12 to step 15 with the remaining concentrations of hydrogen peroxide solution.
Record your results in an appropriate table.
Answer
| percentage concentration of hydrogen peroxide | time / s |
|---|---|
| 6.0 | 7 |
| 3.0 | 15 |
| 1.5 | 35 |
| 0.75 | 80 |
| 0.375 | 160 |
Time for 6.0% = 7 s; 3.0% = 15 s; 1.5% = 35 s; 0.75% = 80 s; 0.375% = 160 s (representative values; student-dependent).
Background Concept
Catalase is an intracellular enzyme found in yeast that breaks down hydrogen peroxide () into water and oxygen:
The rate of this reaction depends on the concentration of (the substrate). At low substrate concentrations the rate is limited by substrate availability; as concentration increases, more enzyme active sites are occupied at any moment, and the rate rises. In this practical the rate is observed indirectly: oxygen gas is trapped in and around an immobilised yeast bead, lowering its density and causing it to rise. The faster oxygen is released, the faster the bead rises, and the shorter the recorded time.
Understanding the Question
Steps 8–16 ask the student to use the five concentrations prepared in (a)(i) and time how long a single yeast bead takes to rise from the bottom of a test-tube to the surface of the liquid. The result for each concentration is then recorded in a single table. The mark scheme rewards the table's structure and the trend of the results rather than any single absolute value.
Approach
- Build a two-column table with the independent variable (concentration) in the left column and the dependent variable (time) in the right column.
- Put the quantity and unit in each heading (e.g.
time / s), and write no units in the body of the table. - Record each result as a whole number of seconds.
- Confirm the trend: the time should increase as concentration decreases, so the time at 6.0% is the shortest and the time at 0.375% is the longest (or the bead does not rise within 180 s).
Step-by-Step Reasoning
- Independent variable first. The mark scheme requires the heading for the independent variable (
percentage concentration of hydrogen peroxide) to come before the heading for the dependent variable (time / s). - Units in the heading, not the body. Each heading carries its unit (e.g.
time / s), and the body of the table contains only numbers — no%symbols and noswritten next to the values. - Whole seconds. A stopwatch is read to the nearest second, so each value is recorded as a whole number (e.g. 7, not 7.2 or 7.43).
- Expected trend. As concentration rises, the catalase reaction proceeds faster, more is released per second, and the bead rises sooner. The shortest time is therefore at 6.0% and the longest at 0.375% (where the bead may not reach the surface within 180 s).
- Representative values. Real readings will vary, but a typical well-behaved set is 7 s, 15 s, 35 s, 80 s and 160 s — increasing monotonically as concentration falls, and within the 180 s limit for all five concentrations.
Key Takeaways
- A results table in this paper always lists the independent variable in the left column, with the dependent variable on the right.
- Units belong in the heading, not in the body of the table.
- A short, clear trend is required: as substrate concentration falls, the time for the bead to rise increases.
- Whole-second precision is appropriate for hand-timing with a stopwatch.
Common Mistakes
- Units in the body of the table: writing
7 sor35 sin the time column instead of just7or35. Units go in the heading only. - Wrong column order: putting time before concentration, or putting a derived column (e.g. rate) in the table when not asked for.
- Non-whole-second values: writing
7.5or7.43from a stopwatch that only reads to whole seconds. - Wrong trend: recording a shorter time at 0.375% than at 6.0%, which contradicts the underlying biology.
- Missing a concentration: leaving out one of the five rows in the table.
Things to Be Careful About
- The 180 s cap in step 14 means that any concentration producing a very slow reaction should be recorded as
>180— not as a number above 180. - Use the heading
time / s, nottime (s)ortime in seconds— the slash form is the convention CIE marks reward. - Do not add a column for repeats or means unless the question asks for one — this procedure uses a single bead per concentration.
State one significant source of error in this investigation.
Answer
Difficult to judge exactly when the bead reaches the surface of the hydrogen peroxide solution / the meniscus is hard to see. (Other acceptable answers: size of the beads varies; only one bead was used for each concentration.)
Difficult to judge when the bead reaches the surface of the solution.
Background Concept
A 'significant source of error' in a practical is a feature of the procedure that introduces noticeable, unpredictable variation into the result — distinct from a simple random (measurement) error. CIE mark schemes typically credit errors that are specific to the procedure used and that have a clear, named consequence. Vague answers such as 'human error' or 'not accurate' are not credited.
Understanding the Question
The procedure times how long a single yeast bead takes to rise through a column of . The endpoint — the moment the bead reaches the liquid surface — is judged by eye, and only one bead is used per concentration. The question asks for ONE significant source of error, meaning a specific weakness that affects the reliability of the recorded time.
Approach
Look for the steps that depend on subjective judgement or that limit replication. The most common, mark-scheme-credited error is the difficulty of judging the endpoint — the moment the bead breaks the surface is hard to see, especially against the curved meniscus of the liquid.
Step-by-Step Reasoning
- Endpoint judgement. The bead does not snap to a fixed line; it gradually slows as it nears the surface, and the curved meniscus of the makes the top of the liquid hard to define precisely. Different observers, or the same observer on different runs, will record slightly different times.
- Bead-size variation. Drops of the alginate–yeast mixture released from the syringe are not all identical, so the beads differ slightly in size. A larger bead has more yeast (more catalase) and a different surface-area-to-volume ratio, so it rises at a different rate even in the same concentration.
- Single bead per concentration. Only one bead is used at each concentration, so there is no within-condition replication to reveal the spread of times or to allow a mean to be calculated.
Any one of these is a creditable answer; the mark-scheme example is the difficulty of judging the endpoint.
Key Takeaways
- A 'source of error' must be specific to the procedure and have a clear consequence for the result.
- In a timing experiment, the endpoint is the most common source of error.
- Single-replicate designs always have a replication error worth naming.
Common Mistakes
- Vague answers: 'human error', 'not accurate', 'parallax error' (the latter is rejected here because the observer is looking straight down at the bead, not reading a scale at an angle).
- Naming an effect, not a cause: 'the time is not accurate' is not a source of error; the difficulty of judging the endpoint IS.
- Naming a control issue instead: 'the temperature was not controlled' is a control-of-variables point, not a source of error in the timing itself.
Things to Be Careful About
- Pick ONE error and name it precisely — the mark is for a single, well-stated error, not a list.
- The error must be 'significant' — something that materially affects the recorded time, not a trivial rounding issue.
Suggest how you could make an improvement to this investigation to reduce the error stated in (a)(iii).
Answer
Draw a line on the outside of the test-tube at the level of the liquid surface so the endpoint can be judged more precisely. (Other acceptable improvements: measure the size of each bead and use beads of the same size / repeat with several beads at each concentration and calculate a mean.)
Draw a line on the test-tube to mark the surface of the liquid.
Background Concept
An improvement in a CIE practical is only credited if it directly reduces the error named in the previous part. Improvements must be practical and specific — not 'be more careful' or 'use better equipment' without saying what equipment and why.
Understanding the Question
The error identified in (a)(iii) was the difficulty of judging when the bead reaches the surface. The improvement must therefore make that judgement more precise, or remove the source of variability.
Approach
Match the improvement to the error. If the error was endpoint judgement, the improvement is a clearer visual marker at the surface. If the error was bead-size variation, the improvement is to standardise bead size. If the error was lack of replication, the improvement is to repeat and take a mean.
Step-by-Step Reasoning
- For endpoint judgement: a thin line drawn on the outside of the test-tube at the level of the meniscus gives the observer a clear, fixed reference. Alternatively, holding a black card behind the test-tube sharpens the contrast between bead and liquid and makes the moment of reaching the surface easier to see.
- For bead-size variation: measure the diameter of each bead (e.g. with a ruler or calipers) and only use beads within a narrow size range, or cut the beads to a uniform size after formation.
- For lack of replication: time several beads at each concentration and calculate a mean time; this reveals the spread of the data and gives a more reliable estimate of the typical rate.
Key Takeaways
- An improvement must directly address the error named in the previous part.
- In this experiment, drawing a line on the test-tube is the most common, mark-scheme-credited improvement.
- Replication (repeat and take a mean) is credited when the error was lack of replication.
Common Mistakes
- Mismatch with (a)(iii): suggesting 'use a colorimeter' (a spectroscopy answer unrelated to bead timing) when the error was about the endpoint.
- Vague improvements: 'be more careful', 'use better technique', 'repeat' without saying what to repeat and what to do with the repeats.
- Naming an improvement that introduces a new variable: e.g. 'use a larger test-tube' changes the depth the bead has to rise through, which alters the time independent of the concentration effect.
Things to Be Careful About
- The improvement must be specific to the error — a generic 'do more repeats' answer only scores if the error in (a)(iii) was specifically about lack of replication.
You will need to estimate the concentration of hydrogen peroxide in U.
You are provided with U, as shown in Table 1.2.
Table 1.2
| labelled | contents | hazard | volume / |
|---|---|---|---|
| U | unknown concentration of hydrogen peroxide solution | harmful irritant | 30 |
If U comes into contact with your skin, wash off immediately under cold water.
It is recommended that you wear suitable eye protection.
Carry out step 17 to step 22.
step 17 Label a clean test-tube U.
step 18 Put of U into the test-tube labelled U.
step 19 Pick up a bead using blunt forceps.
step 20 Drop the bead into the test-tube containing U. Start timing when the bead reaches the bottom of the test-tube.
step 21 Time how long it takes for the bead to reach the surface of solution U. If the bead does not reach the surface after 180 seconds, stop timing and record as 'more than 180'.
step 22 Record the result from step 21 in (a)(v).
State the result for U.
result for U = ______
Answer
result for U = 50 s (representative; any whole-second value lying between the time recorded for 3.0% and the time recorded for 0.75% in (a)(ii) is acceptable).
50 s (representative; student-dependent)
Background Concept
The unknown solution U contains at some concentration between the extremes tested in (a)(ii). Its time is recorded using exactly the same procedure as the standard concentrations, so the units and precision must match those used in the main table.
Understanding the Question
The student must record the time for U in seconds. The mark scheme requires:
- A whole number of seconds (matching the precision used in (a)(ii)).
- A value that lies between the time recorded for 3.0% and the time recorded for 0.75% — i.e. the unknown is more concentrated than 0.75% (faster) but less concentrated than 3.0% (slower).
Approach
Time the bead exactly as in step 14, and write the time in seconds. The answer must be consistent with the data in (a)(ii): if 3.0% gave 15 s and 0.75% gave 80 s, the time for U should be a whole number in the range 15 < t < 80 s.
Step-by-Step Reasoning
- The bead is dropped into of U in the labelled test-tube and the timer is started when the bead reaches the bottom.
- The timer is stopped when the bead reaches the surface, or at 180 s if it has not risen.
- The value is written as a whole number of seconds, with the unit
sgiven once (in the answer space) — not in the body of a table, since the question presents a single blank. - A representative value consistent with the table in (a)(ii) is 50 s.
Key Takeaways
- Always quote the unit (
s) when recording a time, even when the answer is a single number. - The unknown's time must be consistent with the standard-concentration data — it should fall within the range bounded by the 3.0% and 0.75% times.
Common Mistakes
- Omitting the unit: writing
50instead of50 s. - Recording a time outside the 3.0%–0.75% range: e.g. a time faster than the 3.0% time, which would imply a concentration above 3.0% and is not consistent with the mark-scheme expectation.
- Recording a fractional time: e.g.
49.5 sfrom a stopwatch that reads to whole seconds.
Things to Be Careful About
- The question presents a single blank with an underline, so the unit must be written explicitly after the number.
- If the bead does not rise within 180 s, the answer is
>180 s, not a number.
Using your results from (a)(ii) and (a)(v), estimate the concentration of hydrogen peroxide in U.
concentration of hydrogen peroxide in U = ______
Answer
concentration of hydrogen peroxide in U ≈ 1.2 % (representative estimate, obtained by interpolating between 1.5% at 35 s and 0.75% at 80 s to a time of 50 s).
≈ 1.2 % (representative; student-dependent)
Background Concept
When a standard series of known concentrations has been prepared and a property (here, time) has been measured, the concentration of an unknown can be estimated by interpolation — finding where its measured value lies between the two nearest standards and reading off the corresponding concentration. This is the same principle used in colorimetry (where absorbance is plotted against concentration) and in calibration curves generally.
Understanding the Question
The unknown U gave a time of 50 s (representative). The standards in (a)(ii) bracketed this value: 3.0% at 15 s and 0.75% at 80 s. The student must estimate the concentration of U that corresponds to a time of 50 s.
Approach
Identify the two known concentrations whose times bracket the time for U (here, 1.5% at 35 s and 0.75% at 80 s). Interpolate linearly between them to estimate the concentration that would give a time of 50 s.
Step-by-Step Reasoning
- The time for U (50 s) lies between the time for 1.5% (35 s) and the time for 0.75% (80 s), so the concentration of U lies between 1.5% and 0.75%.
- Linear interpolation:
- A reasonable estimate, given the underlying scatter of timing data, is in the range 1.0%–1.5%.
Key Takeaways
- To estimate an unknown, bracket it with two known standards and interpolate.
- The estimate should always lie between the two bracketing concentrations.
- Interpolation assumes a smooth, near-linear relationship between concentration and the measured quantity — a reasonable assumption over a small range in this experiment.
Common Mistakes
- Extraposing outside the range: claiming a concentration of 5% when the time is faster than any standard, or 0.1% when it is slower than any standard.
- Quoting a concentration equal to one of the standards: writing
1.5%rather than an interpolated value. - Omitting the % symbol: writing
1.2instead of1.2 %.
Things to Be Careful About
- The estimate depends on the time recorded in (a)(v); it must be internally consistent with that value.
- The concentration of U is between 0.75% and 1.5% because its time is between the 0.75% and 1.5% times — this is the bracketing that drives the answer.
In the procedure described in step 1 to step 16, the effect of the concentration of hydrogen peroxide on catalase activity was investigated.
Describe how you would modify this procedure to investigate the effect of temperature on the time taken for the beads to rise.
Answer
- Keep the concentration of hydrogen peroxide constant (the same value at every temperature).
- Use at least five different temperatures, each maintained in a thermostatically controlled water bath.
- Place the test-tube of hydrogen peroxide (and the bead) in the water bath until they reach the target temperature before timing the rise.
Use the same concentration of hydrogen peroxide at each of (at least) five temperatures, controlled with a thermostatically controlled water bath.
Background Concept
Enzyme-catalysed reactions are strongly affected by temperature. As temperature rises, the kinetic energy of substrate and enzyme molecules increases, so collisions are more frequent and more likely to result in the formation of enzyme–substrate complexes — up to an optimum. Above the optimum, the enzyme denatures and the rate falls sharply. To investigate the effect of temperature cleanly, every other variable that affects rate (substrate concentration, pH, enzyme concentration, bead size) must be held constant.
Understanding the Question
The original procedure (steps 1–16) varies the concentration of and measures the time for a bead to rise. The question asks how to modify this procedure to investigate the effect of temperature on the time taken for the beads to rise. The new independent variable is temperature; everything else that affects the rate must be held constant.
Approach
- Decide the new independent variable (temperature) and how it will be varied (a range of at least five values).
- Decide what must be kept constant (concentration of , volume, bead size, timing method).
- Decide how temperature will be controlled — a thermostatically controlled water bath is the standard CIE answer because it holds each target temperature to within a fraction of a degree.
Step-by-Step Reasoning
- Same concentration of hydrogen peroxide: the new investigation must keep the substrate concentration fixed, otherwise any change in rate could be attributed to the change in concentration rather than the change in temperature. A single concentration (e.g. 6.0%) is used at every temperature.
- At least five temperatures: a meaningful relationship between temperature and rate needs a range of values — a minimum of five is the CIE convention for a graph-plotting investigation. Typical values: 20 °C, 30 °C, 40 °C, 50 °C, 60 °C.
- Thermostatically controlled water bath: a water bath set to each target temperature holds the temperature of the in the test-tube (and ideally the bead too) at a known, steady value. This is far more reliable than trying to heat a test-tube over a Bunsen burner, where the temperature drifts.
- Equilibration: the test-tube of should be left in the water bath for a minute or so before dropping in the bead, so that the liquid — and the bead itself — reach the target temperature. Otherwise the temperature at the moment of timing is not the target temperature.
- Same bead for each temperature (or beads of the same size): to keep the enzyme amount and surface area constant, either use one bead for all temperatures (washed between runs) or use several beads of identical size.
Key Takeaways
- To change the independent variable, identify the variable you want to vary (here, temperature) and hold every other variable constant.
- A thermostatically controlled water bath is the standard way to maintain a constant, known temperature in a CIE practical.
- At least five values of the independent variable are needed for a graph-plotting investigation.
- Equilibration time matters: reagents and the enzyme must reach the target temperature before the reaction is timed.
Common Mistakes
- Varying two variables at once: e.g. changing both temperature and concentration in the same run. The mark scheme requires the concentration to be kept the same.
- Too few temperatures: using only two or three temperatures gives a curve with too few points to identify a trend or an optimum.
- No temperature control: 'heat the test-tube over a Bunsen burner' — this gives a continuously rising temperature and no defined target value.
- Forgetting to equilibrate: timing the reaction as soon as the test-tube is placed in the water bath, before the contents have reached the target temperature.
Things to Be Careful About
- A thermostatically controlled water bath is the named apparatus the mark scheme expects — not 'a beaker of hot water'.
- The investigation is about the effect of temperature on the time taken for the beads to rise, not on the rate calculated from the time. Either is acceptable, but the dependent variable must be clearly defined.
Immobilised enzymes are often used in industry, for example in the production of lactose-free milk. This can increase productivity and reduce costs, as the enzyme is easy to reuse and the product is not contaminated by the enzyme.
A student investigated the effect of bead diameter on the hydrolysis of lactose. The beads contained the enzyme lactase. Lactase catalyses the hydrolysis of lactose into glucose and galactose.
The student:
- put beads with a diameter of into a syringe, up to the line
- put of milk containing lactose into this syringe
- left the syringe for 5 minutes
- measured the concentration of lactose in the milk after 5 minutes.
The student used this method with the bead diameters shown in Fig. 1.3.
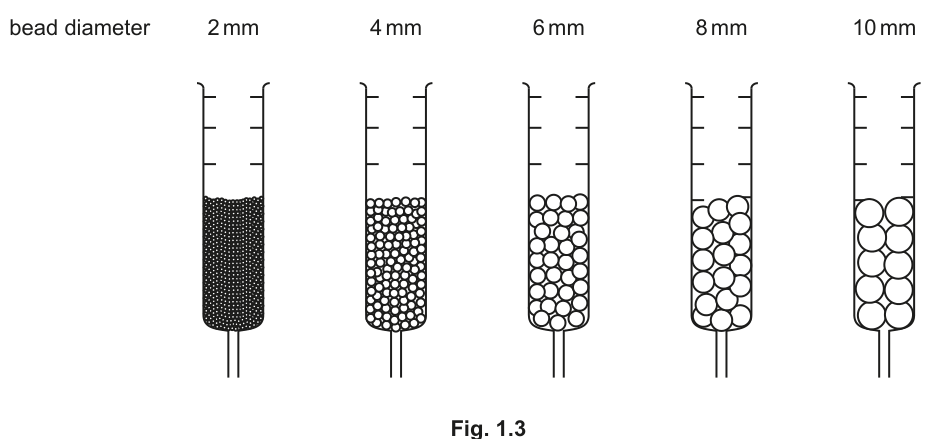
Table 1.3 shows the results of this investigation.
Table 1.3
| bead diameter / mm | percentage concentration of lactose after 5 minutes |
|---|---|
| 2 | 20.5 |
| 4 | 21.0 |
| 6 | 29.5 |
| 8 | 40.5 |
| 10 | 69.0 |
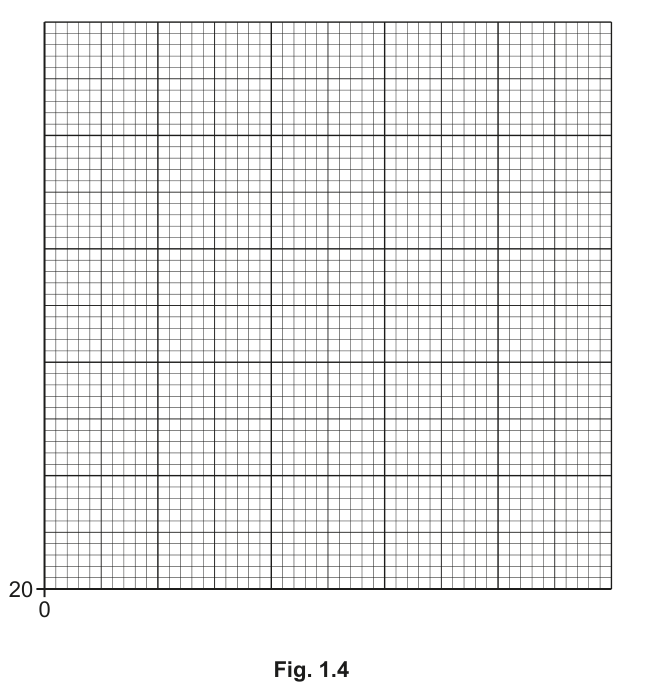
Plot a graph of the data shown in Table 1.3 on the grid in Fig. 1.4.
Use a sharp pencil.
Answer
- x-axis:
bead diameter / mm; scale from 0 to 12, labelled every 2 mm. - y-axis:
percentage concentration of lactose after 5 minutes; scale from 0 to 80, labelled every 10%. - Plotted points: , each marked with a small cross (×) or a dot in a circle.
- Line: thin, single, joining all five points in order of increasing bead diameter.
Line graph: bead diameter / mm on x-axis (0–12, every 2 mm); percentage concentration of lactose after 5 minutes on y-axis (0–80, every 10%); five points plotted at (2, 20.5), (4, 21.0), (6, 29.5), (8, 40.5), (10, 69.0), joined with a thin line.
Background Concept
A line graph is used when both variables are continuous (here, bead diameter and percentage concentration) and the investigator wants to show how one variable changes in response to the other. CIE plotting conventions are strict:
- The independent variable goes on the x-axis; the dependent variable on the y-axis.
- Each axis must be labelled with the quantity and unit in the form
quantity / unit(e.g.bead diameter / mm). - Scales must use at least half the grid in both directions, and must not be 'awkward' (e.g. 3 or 7 per large square). Each axis is labelled at regular intervals.
- Points are plotted as small, precise crosses (×) or as dots in circles (⊙), not as large dots or thick crosses.
- A thin, single line is drawn joining the points. There is no curve fitting beyond the data: the line passes through every point.
Understanding the Question
The data in Table 1.3 give the percentage of lactose remaining in milk after 5 minutes of treatment with lactase beads of five different diameters. The student must plot these data on the provided grid (Fig. 1.4) using a sharp pencil.
Approach
- Choose the axes: bead diameter is the independent variable (x), lactose concentration is the dependent variable (y).
- Choose the scales: bead diameter ranges from 2 to 10 mm, so an x-axis from 0 to 12 mm with labels every 2 mm uses the available grid well. The y-axis must accommodate up to 69.0%, so a scale from 0 to 80% with labels every 10% is appropriate.
- Plot each point with a small cross or dot in a circle.
- Join the points with a thin line.
Step-by-Step Reasoning
- x-axis. The bead diameters are 2, 4, 6, 8 and 10 mm. A scale of 2 mm to 1 cm (or equivalently 1 mm per large square) uses the grid well and gives a clean label every 2 cm = 2 mm. The axis runs from 0 to 12 mm.
- y-axis. The lactose percentages are 20.5, 21.0, 29.5, 40.5 and 69.0. A scale of 10% to 2 cm (10% per 1 cm) gives a clean label every 2 cm = 10% and an axis running from 0 to 80%.
- Points. Plot each as a small cross: (2, 20.5), (4, 21.0), (6, 29.5), (8, 40.5), (10, 69.0).
- Line. Draw a thin, single, continuous line through all five points, in the order of increasing x. Do not extrapolate beyond the data; do not draw a thick or double line; do not draw a separate cross on each side of the line — the line passes through the centre of each cross.
Key Takeaways
- A line graph is appropriate when both variables are continuous.
- Axes must be labelled with
quantity / unitand use scales that fill at least half the grid in both directions. - Points are plotted as small crosses or dots in circles, and the line is thin and passes through every point.
- Extrapolation beyond the data is not credited.
Common Mistakes
- Swapping the axes: putting percentage concentration on the x-axis and bead diameter on the y-axis.
- Bad scale: starting the y-axis at 20 instead of 0 (this distorts the trend by exaggerating the difference between the smaller beads), or using an awkward interval like 7% per large square.
- Large or thick crosses: obscuring the position of the point and making accurate reading impossible.
- A thick or doubled line: CIE mark schemes require a single thin line.
- A curve of best fit through some points but not others: the line must pass through every plotted point.
- Extrapolating the line beyond x = 10 mm or x < 2 mm: the data do not support this.
Things to Be Careful About
- The line must be thin (use a sharp 4H or HB pencil) and single.
- The points must be plotted accurately — a misplaced point loses the mark even if everything else is correct.
- The grid in Fig. 1.4 already has the y-axis label '20' and the origin '0' visible; complete the labelling to match the chosen scale.
Use your graph to find the concentration of lactose in the milk after 5 minutes, when the bead diameter was .
concentration of lactose = ______
Answer
From the graph, at a bead diameter of the line passes between and , giving a concentration of approximately 25%.
concentration of lactose = 25 %
≈ 25 %
Background Concept
A line graph is not just a record of the data — it is a tool for interpolation (reading off values between the measured points) and extrapolation (reading off values beyond the measured range). In this paper, only interpolation is asked for: the value at lies between the measured points at and .
Understanding the Question
The student must read the percentage concentration of lactose corresponding to a bead diameter of from the line drawn in (b)(i). The answer depends on the exact line drawn, so a range of values is acceptable, but the centre of the accepted range is around 25%.
Approach
Locate on the x-axis. Draw a vertical line up to the plotted line, then read horizontally across to the y-axis. The reading lies between the value (21.0%) and the value (29.5%). Linear interpolation gives the centre of the range.
Step-by-Step Reasoning
- Locate on the x-axis — exactly halfway between the plotted points at and .
- Read vertically up to the line. Because the line is slightly curved (the slope steepens as bead diameter increases), the value at is just below the simple average of 21.0 and 29.5.
- Simple average: , so approximately 25%.
- Reading the line graph drawn in (b)(i) gives a value in the range 24–26%, with 25% as the most likely answer.
Key Takeaways
- To read a value from a line graph, project vertically from the x-axis to the line, then horizontally to the y-axis.
- When the line is curved, the reading at an intermediate x lies on the line, not on the straight chord between the two adjacent points — the line drawn in (b)(i) is the reference, not a straight-edge approximation.
- Always quote the unit (% here).
Common Mistakes
- Extraposing beyond the data: not an issue here ( is between two plotted points), but worth noting as a general pitfall.
- Omitting the % unit: writing
25instead of25 %. - Reading from the y-axis at the wrong x: mislocating on the x-axis, for example reading at or .
- Reading from a printed gridline instead of from the line: the line is the reference, not a gridline at the same x.
Things to Be Careful About
- The mark scheme says the value must be 'correct based on the candidate's graph', so any value consistent with the line drawn in (b)(i) is accepted — typically in the range 24% to 26%.
Explain why the percentage concentration of lactose in the milk after 5 minutes increases as the bead diameter increases.
Answer
- As bead diameter increases, the total surface area (of the beads in the syringe) decreases (ORA).
- Less enzyme is in contact with the lactose substrate, so there are fewer active sites available for lactose to bind to.
- Fewer enzyme–substrate complexes form per unit time, so the rate of lactose hydrolysis is lower and more lactose remains in the milk after 5 minutes.
Larger beads have a smaller total surface area, so less enzyme contacts the substrate, fewer active sites are available, fewer enzyme–substrate complexes form, and the rate of hydrolysis is lower — leaving more lactose after 5 minutes.
Background Concept
Enzymes speed up reactions by binding their substrate at the active site to form an enzyme–substrate complex (ESC). The rate of an enzyme-catalysed reaction depends on the frequency of successful ESC formation, which in turn depends on the concentration of enzyme active sites exposed to the substrate.
For an immobilised enzyme held inside beads, only the enzyme on or near the surface of the bead is in direct contact with the surrounding substrate. The total surface area of all the beads together therefore determines how much enzyme is 'available' to the substrate at any moment. The same volume of beads made of larger spheres has less total surface area than the same volume made of smaller spheres — this is a direct consequence of the surface-area-to-volume ratio: a smaller sphere has a higher ratio of surface area to volume than a larger sphere.
Understanding the Question
Table 1.3 shows that the percentage of lactose remaining after 5 minutes increases as bead diameter increases (20.5% at 2 mm, 69.0% at 10 mm). The student must explain why a larger bead diameter results in more lactose — i.e. why the hydrolysis reaction is slower with larger beads.
Approach
Work from the observation back to the underlying biology:
- Start with the surface area of the beads (the mark-scheme-required opening point).
- Connect surface area to the amount of enzyme in contact with the substrate.
- Connect that to the number of active sites and ESCs, and therefore to the rate of hydrolysis.
- Connect the rate of hydrolysis to the amount of lactose remaining after a fixed time (5 minutes).
Step-by-Step Reasoning
- Surface area. For a fixed volume of beads, larger beads have a smaller total surface area (and a smaller surface-area-to-volume ratio). The mark scheme credits this as the opening point: 'larger beads have a smaller total surface area' (ORA: smaller beads have a larger total surface area).
- Enzyme in contact with substrate. With less surface area exposed to the milk, less of the immobilised lactase is in contact with the lactose at any moment. The remaining enzyme is buried inside the bead and can only act after the substrate has diffused in — a much slower process.
- Active sites. With fewer enzyme molecules exposed, fewer active sites are available for lactose to bind to.
- Enzyme–substrate complexes. With fewer active sites, fewer enzyme–substrate complexes (ESCs) form per unit time.
- Rate of hydrolysis. A lower frequency of ESC formation means a lower rate of lactose hydrolysis.
- Lactose remaining. Over the fixed 5-minute period, less lactose is broken down, so the percentage of lactose remaining in the milk is higher for larger beads.
Key Takeaways
- Surface area is the link between bead size and reaction rate in an immobilised-enzyme system.
- Fewer active sites exposed → fewer ESCs per second → lower rate → more substrate remaining after a fixed time.
- The trend in the data is the inverse of the rate: as the rate falls, the percentage of substrate remaining rises.
Common Mistakes
- 'Larger beads have more enzyme': this is the opposite of the truth. Although each individual bead contains more enzyme, the same total volume of beads contains fewer, larger beads, and their combined surface area is smaller.
- Skipping the active-site / ESC step: a common shortcut is to say 'less enzyme contact' and stop there. The mark scheme credits the active-site and ESC points separately.
- Confusing the trend: writing 'more lactose is broken down as bead diameter increases' — the data show the opposite.
- Vague references to diffusion: 'substrate cannot diffuse in' is acceptable in context but is not the primary mark-scheme point; the primary point is the surface area.
Things to Be Careful About
- The opening point must be about surface area (or surface-area-to-volume ratio) — the mark scheme explicitly requires this before the two 'any two from' explanations.
- Use the term 'active site' (not just 'enzyme') and 'enzyme–substrate complex' (or 'ESC') — these are the precise terms the mark scheme credits.
- The explanation is for the increase in lactose remaining, so each step must be consistent with a decrease in the rate of hydrolysis.
The rest of this paper
1 more questions- Q2Use of the Light Microscope18M