Biology 9700/34 — October/November 2022
Cambridge AS Level · Advanced Practical Skills · worked solutions for every part, with the mark scheme
Topics Manipulation, Measurement and Observation · Analysis, Conclusions and Evaluation · Presentation of Data and Observations · Use of the Light Microscope
Ascorbic acid is important in the diet for maintaining health. Ascorbic acid can be found in many vegetables.
You will investigate the effect of heating on the concentration of ascorbic acid in a vegetable extract. You will be carrying out a test to estimate the concentration of ascorbic acid in a vegetable extract.
You are provided with the materials shown in Table 1.1.
Table 1.1
| labelled | contents | hazard | volume / |
|---|---|---|---|
| A | 0.1% ascorbic acid solution | none | 50 |
| W | distilled water | none | 100 |
| iodine | iodine solution | none | 20 |
| S | starch solution | none | 20 |
| U | vegetable extract before cooking | none | 20 |
| C | vegetable extract after cooking | none | 20 |
If any solution comes into contact with your skin, wash off immediately under cold water.
It is recommended that you wear suitable eye protection.
To estimate the concentration of ascorbic acid in the vegetable extract you will use iodine solution. The higher the concentration of ascorbic acid in the vegetable extract, the greater the volume of iodine solution needed to reach the end-point.
The end-point is when the blue colour remains for at least 10 seconds.
To find the volume of iodine solution needed to reach the end-point, iodine solution will be added to the vegetable extract, one drop at a time, using a syringe.
To practise releasing drops from a syringe, carry out step 1 to step 3.
step 1 Fill a syringe with distilled water, W.
step 2 Hold the syringe over an empty test-tube, as shown in Fig. 1.1, and push the plunger slowly to release one drop.
step 3 Repeat this until you can release one drop at a time.
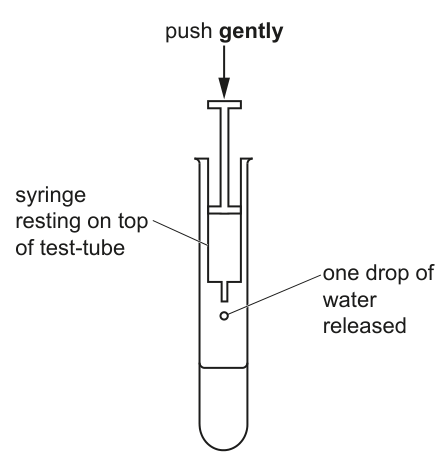
You will need to carry out a serial dilution of the 0.1% solution of ascorbic acid, A, to reduce the concentration by half between each successive dilution.
You will need to prepare four concentrations of ascorbic acid in addition to the 0.1% solution, A.
After the serial dilution is completed, you will need to have of each concentration available to use.
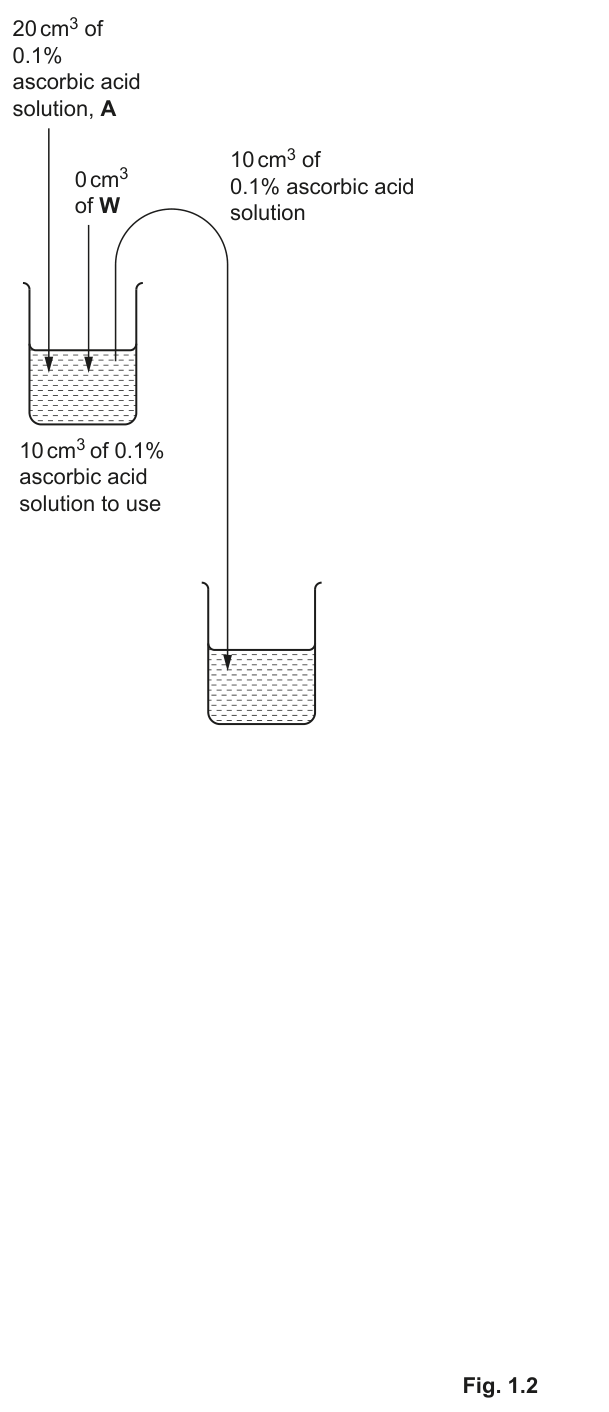
Complete Fig. 1.2 to show how you will prepare your serial dilution.
Fig. 1.2 shows the first two beakers you will use to make your serial dilution. You will need to draw three additional beakers.
For each beaker add labelled arrows to show:
- The volume of A transferred
- The volume of distilled water, W, added.
Under each beaker, state the concentration of ascorbic acid solution.
Answer
The dilution reduces the concentration by half at every step, so the four additional concentrations are:
For each successive beaker:
- Transfer of the previous beaker's solution into the next beaker.
- Add of distilled water, W, to the next beaker.
Each beaker therefore contains in total. Remove to use, leaving to carry forward to the next beaker.
Four beakers: 0.05%, 0.025%, 0.0125%, 0.00625%; each made by transferring 10 cm³ of the previous solution and adding 10 cm³ of W.
Background Concept
A serial dilution is a stepwise dilution in which the concentration is reduced by a fixed factor at each step. In a half-strength (1:2) serial dilution the concentration is halved between successive tubes or beakers. Serial dilutions are used to:
- produce a wide range of concentrations from a small volume of stock solution,
- keep all dilutions related to one another by a known factor (so an unknown sample can be read off the scale), and
- avoid the need to weigh out many separate masses of solute.
For a 1:2 dilution, equal volumes of solution and diluent (water) are mixed, so:
If of solution is added to of water, the total is and the concentration is exactly halved. After mixing, is taken for the assay and is carried forward to the next beaker.
Understanding the Question
The stem tells us we have of a stock solution, A, and that we must dilute it by half between each successive step to give four further concentrations in addition to A itself. We need of each concentration available to use. We have to complete Fig. 1.2 by drawing three more beakers and labelling, for each beaker, the volume of A (or transferred solution) entering it and the volume of W added, plus the resulting concentration beneath.
The command word here is complete — it is essentially a drawing/label task. The marks reward correct concentrations, correct transfer volumes and correct water volumes.
Approach
- Calculate the four new concentrations by halving four times.
- Recognise the procedure: each new beaker is made by mixing equal volumes (), so the concentration is halved.
- After mixing, remove for use; the remaining is carried forward as the source for the next beaker.
- Draw three additional beakers in a row, with arrows showing the transfer volume and the water volume for each.
Step-by-Step Reasoning
Starting concentration: .
- Beaker 1: — provided. The figure shows of A entering, of W added, and is removed "to use".
- Beaker 2: of from beaker 1 is transferred in, of W is added. The new concentration is .
- Beaker 3: of from beaker 2 is transferred in, of W is added. The new concentration is .
- Beaker 4: of from beaker 3 is transferred in, of W is added. The new concentration is .
- Beaker 5: of from beaker 4 is transferred in, of W is added. The new concentration is .
So the four new concentrations in order are: , , and . For each new beaker the arrows must clearly show of the previous solution entering and of W entering. The percentage label goes under each beaker.
Key Takeaways
- A 1:2 serial dilution halves the concentration at every step; successive concentrations follow a geometric series.
- When equal volumes are mixed, the new concentration is exactly the old concentration divided by 2.
- The " to use" message tells you how much is removed before the next transfer — always keep the carried-forward volume the same so each step halves the concentration.
Common Mistakes
- Halving only once and giving, e.g., and only: the question asks for four additional concentrations.
- Adding the wrong volume of water (e.g. ) — to halve the concentration by mixing, the volumes added must be equal.
- Forgetting to write the concentration below each beaker.
- Using units of for concentration (concentration is given as a percentage here).
Things to Be Careful About
- The first beaker is A at — it is supplied, not made by dilution. Your arrows for beaker 1 should show of W.
- The volumes in the diagram are transferred and of water added at every new beaker, not of the previous solution.
- is a small number but it is correct; don't round it to or — the mark scheme requires the exact value.
Carry out step 4 to step 17.
step 4 Prepare the concentrations of ascorbic acid solution, as decided in (a)(i), in the beakers provided.
step 5 Put of S into a test-tube.
step 6 Put of 0.1% ascorbic acid solution, A, into the same test-tube.
step 7 Shake the test-tube gently to mix the contents.
step 8 Put the nozzle of a syringe into the beaker containing iodine.
step 9 Pull the plunger out so that of iodine enters the syringe.
step 10 Wipe off any excess iodine from the outside of the syringe with a paper towel.
In step 11 to step 15, you will be finding the volume of iodine solution needed to reach the end-point.
step 11 Put one drop of iodine, as shown in Fig. 1.1, into the mixture of S and A in the test-tube.
step 12 Mix gently and observe any colour change.
step 13 Repeat step 11 to step 12 until a blue colour appears. You may need to refill the syringe with iodine as in step 8 to step 10.
step 14 When the blue colour appears, shake the test-tube gently for 10 seconds and see if the end-point has been reached.
step 15 If the blue colour disappears then repeat step 11 to step 14 until the mixture stays blue for at least 10 seconds. This is the end-point.
If the colour does not stay blue after adding of iodine solution, stop adding iodine solution.
step 16 Record in (a)(ii) the volume of iodine solution added to reach the end-point. If the colour does not stay blue after adding of iodine solution, record as 'more than 5.0'.
step 17 Repeat step 5 to step 16 for each of the concentrations of ascorbic acid solution prepared in step 4.
Record your results in an appropriate table.
Answer
| percentage concentration of ascorbic acid | volume of iodine / |
|---|---|
| 0.1000 | (largest) |
| 0.0500 | ↓ |
| 0.0250 | ↓ |
| 0.0125 | ↓ |
| 0.00625 | (smallest) |
Conventions used:
- The independent variable (percentage concentration of ascorbic acid) is the first column heading; the dependent variable (volume of iodine) is the second.
- Units () are in the heading only, not in the body of the table.
- Volumes are recorded to at least one decimal place.
- The volume of iodine needed increases as the concentration of ascorbic acid increases.
Five-row table (or six with 0.1% repeated if required) with headings 'percentage concentration of ascorbic acid' and 'volume of iodine / cm³'; volumes recorded to ≥1 d.p., increasing with concentration.
Background Concept
In any practical investigation the independent variable is the one the experimenter deliberately changes, and the dependent variable is the one measured. CIE expects results to be recorded in a table that:
- has a clear heading for each column that names the quantity and (where appropriate) gives the unit,
- puts the independent variable as the left-hand column,
- puts units only in the heading, not repeated against every value,
- uses a consistent number of decimal places down each column,
- has a ruled border and clear rows/columns.
The biological principle behind this titration: iodine () is reduced to colourless iodide () by ascorbic acid; once all the ascorbic acid has been oxidised, further drops of iodine react with starch to give the blue-black starch–iodine complex. The end-point is the volume at which the blue colour persists for . The higher the ascorbic acid concentration, the more iodine is needed to reach the end-point.
Understanding the Question
The candidate has just carried out the titration for each concentration of ascorbic acid prepared in (a)(i). They must now record their own results in an appropriate table. The marks reward:
- Correct headings (independent variable first, no units in the body).
- Results for all concentrations.
- Decimal places consistent and at least 1 d.p.
- Correct trend: more iodine needed for higher concentrations of ascorbic acid.
Approach
- Decide the layout: two columns — ascorbic acid concentration (independent) on the left, volume of iodine (dependent) on the right.
- Decide decimal places. Volumes from a syringe read to (one drop ≈ ) are typically recorded to one decimal place, e.g. , , , , .
- Order the rows by concentration (usually descending, so the largest value is at the top).
- Check the trend: the row with the highest ascorbic acid concentration should have the largest volume of iodine.
Step-by-Step Reasoning
Because the candidate performs the experiment, I cannot know their exact values. Representative values consistent with the trend expected by the mark scheme (and using an evenly-stepped dilution) are:
| percentage concentration of ascorbic acid | volume of iodine / |
|---|---|
| 0.1000 | 2.2 |
| 0.0500 | 1.4 |
| 0.0250 | 0.9 |
| 0.0125 | 0.6 |
| 0.00625 | 0.4 |
What matters for the marks:
- The values decrease down the second column as the concentration decreases (or equivalently, increase up the table as concentration increases).
- All five concentrations are present, with results to 1 d.p. (or more).
- The headings are correct and units are in the headings only.
Key Takeaways
- Independent variable → first column; dependent variable → subsequent columns.
- Units in the heading, not in the body.
- A consistent number of decimal places down each column.
- In an ascorbic-acid/iodine titration, more ascorbic acid means more iodine is needed to reach the end-point.
Common Mistakes
- Writing the units (e.g. , ) inside the data cells rather than only in the headings.
- Putting the dependent variable in the first column.
- Inconsistent decimal places (e.g. in one row, in another).
- Reversing the trend: writing a larger volume of iodine for a lower ascorbic acid concentration.
Things to Be Careful About
- "At least one decimal place" means is fine, but alone is not.
- The trend check is the most reliable way to catch errors: if the highest concentration has the smallest iodine volume, something is wrong.
- If a sample did not turn blue after , record "more than " — do not write exactly.
Describe one significant source of error when carrying out steps 8 to 17.
Answer
Any one of:
- The end-point is difficult to judge (the blue colour is subjective and the 10-second timing is not precise).
- The iodine solution is dark / opaque so it is difficult to read the volume on the syringe accurately.
Difficult to judge the end-point / difficult to read the syringe as the iodine solution is too dark.
Background Concept
A "source of error" in practical work is anything that introduces uncertainty into the measurement. For titrations the dominant errors are usually end-point detection (when does the indicator change?) and volume reading (how precisely can the syringe or burette be read?). Both are made worse if the solution is dark or intensely coloured.
In this experiment the end-point is the appearance of a blue colour that persists for at least . This requires a subjective judgement — the colour change is gradual, and a candidate may declare the end-point too early (when the blue colour is transient) or too late (after adding more iodine than was strictly needed).
Understanding the Question
The question asks for one significant source of error in steps 8 to 17 — that is, in drawing up the iodine, releasing it drop by drop, judging the end-point, and reading the syringe. The mark scheme gives two credited errors: difficulty judging the end-point, and difficulty reading the syringe because the iodine solution is too dark.
Approach
- Identify where the result is most uncertain.
- Match it to a specific feature of the procedure (end-point, syringe reading, drop size, mixing).
- State the error clearly and concisely.
Step-by-Step Reasoning
- The end-point requires a subjective "blue for at least " judgement. Different candidates will stop at different points. This is a recognised, significant error.
- The iodine solution is a dark brown liquid, so the markings on the syringe barrel are hard to read through it. The reading is therefore imprecise. This is also a recognised, significant error.
Either answer is sufficient. The mark scheme does not credit vague answers like "human error" or "parallax error".
Key Takeaways
- For a colour-change titration, the end-point is usually the dominant source of error.
- For coloured solutions, reading the syringe or burette is the second-biggest source of error.
- Vague answers ("human error") are not credited; be specific about what was hard to do and why.
Common Mistakes
- Writing "human error" — too vague, not credited.
- Writing "parallax error" — the syringe is vertical and the candidate looks straight down at it, so parallax is not the issue.
- Naming an error that is not actually significant, e.g. "the test-tube might fall over".
Things to Be Careful About
- "Significant" means the error noticeably affects the recorded volume. The two end-point / reading errors are the ones that change the result by a measurable amount.
- If the candidate is asked for one error, do not list several — credit is only for the first error and the rest are ignored.
You will now estimate the concentration of ascorbic acid in vegetable extracts U and C.
step 18 Repeat step 5 to step 15 with U, instead of A.
step 19 Record in (a)(iv) the volume of iodine solution added to reach the end-point.
step 20 Repeat step 5 to step 15 with C, instead of A.
step 21 Record in (a)(iv) the volume of iodine solution added to reach the end-point.
If the colour does not stay blue after adding of iodine solution, record as 'more than 5.0'.
Record the volume of iodine solution needed to reach the end-point for U and C.
volume for U = ______
volume for C = ______
Answer
Record the volume of iodine required for each vegetable extract to the same precision used in (a)(ii) (e.g. one decimal place). The volume for U (uncooked) must be greater than the volume for C (cooked), because cooking destroys ascorbic acid.
Representative student values:
(Exact values are student-dependent; the mark is awarded as long as the value for U is greater than the value for C.)
Two recorded volumes, e.g. U = 1.6 cm³ and C = 0.8 cm³, with U > C.
Background Concept
The investigation is comparing two treatments of the same vegetable extract: U (uncooked) and C (cooked for ). Because both are run through the same procedure as the standard concentrations, the volume of iodine required gives a relative measure of their ascorbic acid content. The biological expectation is that heating decreases the ascorbic acid concentration (ascorbic acid is heat-labile and oxidises on heating), so the cooked extract C should require less iodine than the uncooked extract U.
Understanding the Question
The candidate has just carried out steps 18–21: titrate U against iodine, record the volume; then titrate C against iodine, record the volume. The marks reward both volumes being recorded and the volume for U being greater than the volume for C.
The actual numerical values depend on the candidate's own experiment, so the mark scheme cannot pin down a single "correct" answer — it just requires the qualitative ordering to be correct.
Approach
- Read the syringe to the same precision as in (a)(ii).
- If the blue colour did not persist after of iodine, write "more than ".
- Confirm the expected trend: .
Step-by-Step Reasoning
Using the representative data above: of iodine was needed for U and for C. Because , the cooked extract has roughly half the ascorbic acid of the uncooked extract, which is consistent with the prediction. The candidate's own values may differ but the ordering U > C is what the mark scheme checks.
Key Takeaways
- An unknown sample can be compared to a calibration series by the volume of titrant needed to reach the end-point.
- Heating destroys ascorbic acid, so the cooked extract should always require less iodine than the uncooked one.
- Always record to the same precision across all measurements in an experiment.
Common Mistakes
- Writing the volumes with different decimal places (e.g. for U and for C).
- Reversing the trend (writing C > U) — this contradicts the biology and forfeits the mark.
- Writing "more than " for C when the blue colour did in fact appear within .
Things to Be Careful About
- The result is student-dependent; the mark is awarded for the correct ordering and a numerical value with units, not for a specific value.
- Be consistent with the precision of your earlier results in (a)(ii).
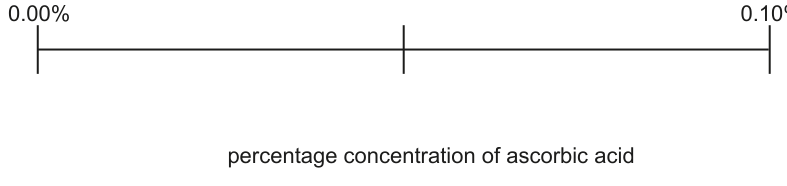
Complete Fig. 1.3 to show the positions of each of the percentage concentrations of ascorbic acid, recorded in (a)(ii).
Answer
Add labels to the scale bar so the five standard concentrations are positioned proportionally along the line. From left to right:
(Each successive label is half the previous one, so the gap between and is the same as the gap between and .)
Five intermediate labels — 0.00625%, 0.0125%, 0.025%, 0.05% and 0.10% — placed in proportion along the scale bar.
Background Concept
A scale bar (or number line) is a way of representing a continuous range of values when you have a calibration series. Once the positions of the standards are marked, any unknown can be placed on the same line by eye and its value read off.
The serial dilution in (a)(i) was a 1:2 (half-concentration) series. The five standard concentrations are , , , , . On a linear scale, however, halving the concentration does not mean equal spacing on the bar — the spacing is proportional to the absolute concentration, not the log. So a mark is twice as far from as a mark, and the smallest concentrations ( and ) cluster very close to the left end.
Understanding the Question
The question shows a horizontal line with the two ends labelled and , and a single tick already marked at the midpoint. The candidate must label the scale bar with the five standard concentrations used in the experiment, in the correct positions.
The mark scheme requires the scale to be correctly labelled with the different concentrations.
Approach
- Mark at the left end and at the right end.
- Place each of the five known concentrations at a position proportional to its value:
- is exactly halfway along the bar (this is the tick already drawn).
- is at of the way along.
- is at of the way along.
- is at of the way along.
- Write each label clearly above or below the tick mark.
Step-by-Step Reasoning
The mid-tick already shown is at the position (half of ). The other labels are placed at the proportional positions: at of the total length, at , and at . The candidate's own data from (a)(ii) has already established that these concentrations are valid, and they should now be placed in proportion on the bar.
Key Takeaways
- A linear scale bar places values at positions proportional to their magnitude, not logarithmically.
- A dilution series gives values that compress near zero on a linear scale — most of the bar's length is taken up by the higher concentrations.
Common Mistakes
- Spacing the values evenly (e.g. equal gaps between , , , , ) — this is wrong because the gaps on a linear scale should be proportional to the values, not equal.
- Forgetting the smallest concentration , which sits very close to the left end and is easy to miss.
Things to Be Careful About
- The midpoint tick is at , not at .
- The scale bar is linear, not logarithmic — the spacing must be proportional.
Use your results in (a)(ii) and (a)(iv) to estimate the concentration of ascorbic acid in U and C.
Show these estimates on Fig. 1.3 by placing the letters U and C in the correct positions along the line.
Answer
Using the volume of iodine recorded in (a)(iv):
- The volume for U corresponds to a higher concentration than that for C.
- The position of U is therefore to the right of the position of C on the scale bar.
With the representative values and , the two estimates from the calibration series are:
Place U to the right of C on the bar, each in the position that best matches its iodine volume.
U and C placed on the scale bar with U to the right of C, in positions consistent with U's larger iodine volume.
Background Concept
This part uses the calibration scale built up in (a)(v). The volume of iodine is directly proportional to the ascorbic acid concentration (more ascorbic acid = more iodine required). A standard curve or scale bar therefore lets us read the concentration of an unknown by locating the position on the bar where the iodine volume matches.
Because the serial dilution halves concentration at each step, equal volumes of iodine map to concentrations in a simple ratio. For example, if a standard needs of iodine and a standard needs , then an extract needing of iodine has a concentration slightly higher than (interpolated between and the next-higher standard, , which needs ).
Understanding the Question
The candidate must place the letters U and C on the scale bar in positions consistent with the volumes of iodine recorded in (a)(iv). The mark scheme requires both to be in the correct position.
Approach
- Compare the volume of iodine for U with the volumes for the standards (from (a)(ii)).
- Locate the standard whose iodine volume is the same (or interpolate between the two nearest standards).
- Repeat for C.
- Place U and C on the bar.
Step-by-Step Reasoning
Using the representative data:
| sample | volume of iodine / | estimate of ascorbic acid concentration |
|---|---|---|
| between and ; closer to | ||
| between and ; closer to |
So U is plotted a little to the right of the mark, and C is plotted about halfway between and (slightly to the right of ). Importantly, U must be to the right of C on the bar.
Key Takeaways
- A standard series converts a measured quantity (here, volume of titrant) into the concentration of an unknown by interpolation.
- The accuracy of the estimate is limited by the spread of the standards: with five standards covering , the resolution is about near zero and much coarser near the high end.
Common Mistakes
- Reversing the order (placing C to the right of U) — this contradicts both the recorded volumes and the biology.
- Placing U and C at the same position, which implies equal ascorbic acid concentrations in cooked and uncooked extract.
- Forgetting to write the letters at all.
Things to Be Careful About
- The scale bar is a calibration curve, not a bar chart. Each unknown is placed on the same axis as the standards, not on a separate axis.
- The position of the letters should be consistent with the candidate's own volumes from (a)(iv), even if those volumes are unusual.
Describe how you could modify this procedure to obtain a more accurate estimate of the concentration of ascorbic acid in the vegetable extract U and C.
Do not include the use of a colorimeter in your answer.
Answer
Any one of:
- Use a narrower range of concentrations (e.g. only between and ) so the calibration scale is denser in the region of interest.
- Repeat each titration and calculate a mean volume of iodine to reduce the effect of the end-point error.
- Use a micropipette (or smaller syringe) to release more controlled, smaller drops, so the end-point can be reached more precisely.
One valid improvement: narrower concentration range, or repeat and mean, or use a micropipette.
Background Concept
"Improving" a procedure means reducing the dominant sources of uncertainty. For this titration there are two big ones: the end-point is subjective, and the concentration scale is coarse (only five standards spanning to ). Improvements therefore target one of those two issues, or replace the drop-by-drop method with a more precise dispenser.
Understanding the Question
The question asks for one modification that would give a more accurate estimate of the concentration of ascorbic acid in U and C, without using a colorimeter. The mark scheme accepts three categories: (1) a narrower range of standards, (2) repeats and a mean, (3) a more precise dispenser (micropipette).
Approach
- Identify the dominant source of error (end-point, coarse scale, or coarse drop size).
- Choose a modification that directly addresses it.
- State the modification clearly and specifically.
Step-by-Step Reasoning
- Narrower range: with standards clustered around the unknown's value, the interpolation is more accurate. For example, if U is near , prepare standards at , , , and — much finer resolution than the original series.
- Repeat and mean: doing each titration three times and averaging smooths out the random end-point error. The improvement is paired with the error identified in (a)(iii).
- Micropipette: a micropipette delivers a fixed, smaller volume per "drop" (typically microlitres), so the resolution around the end-point is finer — you can stop closer to the true equivalence point.
Any one of these is accepted.
Key Takeaways
- Improvements should target the dominant source of error identified earlier in the question.
- Repeats and a mean reduce random error; finer standards reduce systematic interpolation error; finer dispensers reduce end-point error.
Common Mistakes
- Vague answers like "be more careful" or "do it more accurately" — not credited.
- "Use a colorimeter" — explicitly excluded by the question.
- Suggesting changes that don't affect the precision, e.g. "use a different vegetable".
Things to Be Careful About
- The mark scheme credits only one improvement; if you list several, only the first is read.
- The improvement must be specific and actionable (e.g. "repeat three times and take a mean" not just "repeat").
U is a vegetable extract before heating and C is the same vegetable extract after heating.
Suggest an explanation for the effect of heating on the concentration of ascorbic acid in the vegetable extract.
Answer
Heating breaks down (oxidises / denatures) ascorbic acid, so the cooked extract C contains less ascorbic acid than the uncooked extract U, and therefore requires less iodine to reach the end-point.
Heating breaks down ascorbic acid.
Background Concept
Ascorbic acid (vitamin C) is a small, water-soluble, reducing molecule. It is chemically unstable: it is readily oxidised to dehydroascorbic acid, especially in the presence of heat, oxygen, light and metal ions. Cooking vegetables in water (boiling, simmering) accelerates this oxidation and also leaches ascorbic acid out of the cells into the cooking water, so the vegetable itself loses vitamin C. Both effects reduce the ascorbic acid concentration of the cooked extract relative to the uncooked one.
In this experiment the cooked extract C required less iodine to reach the end-point than the uncooked extract U, indicating a lower concentration of ascorbic acid. The biological explanation is therefore that heating breaks down ascorbic acid.
Understanding the Question
The question asks the candidate to suggest an explanation for the effect of heating on the ascorbic acid concentration. The mark scheme accepts either:
- Heating breaks down ascorbic acid (the credited biological explanation), or
- Heating has no effect on ascorbic acid (accepted if the candidate's data happened to show no difference — for example, if the iodine volumes for U and C were equal).
Approach
- State the expected effect of heating on ascorbic acid.
- Link it to the observation (less iodine needed for the cooked extract).
Step-by-Step Reasoning
The result expected, and obtained by most candidates, is that U required more iodine than C because ascorbic acid was destroyed by heating. The explanation is therefore: heating breaks down (oxidises) ascorbic acid, so the cooked extract has a lower concentration.
If a candidate's data shows no change, the alternative answer "heating has no effect on ascorbic acid" is also credited.
Key Takeaways
- Ascorbic acid is heat-labile; heating destroys it.
- A lower ascorbic acid concentration in a sample corresponds to a lower volume of iodine at the end-point.
Common Mistakes
- Vague answers like "cooking changes the vegetable" — not specific to ascorbic acid.
- "Heating increases the ascorbic acid concentration" — biologically incorrect; the trend is the opposite.
- Failing to link the explanation to the data (e.g. just writing "ascorbic acid is destroyed by heat" without mentioning the iodine volumes).
Things to Be Careful About
- The mark scheme awards the mark for either accepted explanation, so a candidate with anomalous data (e.g. C > U) is not penalised as long as the explanation is consistent with their data.
In the investigation you have carried out, vegetable extract, C, was heated for 60 minutes.
Outline how you could investigate the effect of different heating times on the concentration of ascorbic acid in a vegetable extract.
Answer
A controlled investigation of the effect of heating time on ascorbic acid concentration would include:
- Same concentration of vegetable extract (use the same volume of the same batch of extract in each test).
- Same temperature of heating (e.g. for boiling, or a fixed temperature below boiling).
- Use a thermostatically controlled water-bath to maintain the chosen temperature throughout each heating period.
- Five different times of heating (e.g. , , , and ), evenly spaced across a sensible range.
- After heating, titrate each sample against iodine in the same way as in (a)(ii), and record the volume of iodine needed to reach the end-point for each time.
- Compare the volumes to see how ascorbic acid concentration changes with heating time.
Five evenly-spaced heating times; same concentration of extract, same temperature (use a thermostatically controlled water-bath).
Background Concept
This is a Planning sub-question: it asks how to extend the experiment to investigate a different independent variable (heating time). The general structure of a controlled experiment is:
- Independent variable — what you deliberately change. Here: heating time.
- Dependent variable — what you measure. Here: volume of iodine needed to reach the end-point, which is then converted to ascorbic acid concentration via the standard curve.
- Controlled variables — factors that must be kept the same so the change in the dependent variable can be attributed to the independent variable. Here: concentration of extract, temperature, volume of extract, volume of starch, drop size, etc.
- Range and intervals — a minimum of five values, evenly spaced, to show a trend.
- Reliability — repeats and means.
Understanding the Question
The candidate is told that the extract C was heated for minutes. The question asks how to investigate the effect of different heating times on ascorbic acid concentration. The mark scheme awards marks for any three of:
- Same concentration.
- Same temperature.
- Thermostatically controlled water-bath.
- Five different times.
- Times evenly spaced.
Approach
- State the independent variable (heating time) and the range of times (e.g. – min) — at least five values, evenly spaced.
- State what must be kept the same (concentration of extract, temperature, volume).
- State the apparatus used to control temperature (thermostatic water-bath).
- Describe how the ascorbic acid concentration is measured (same iodine titration as in (a)(ii)).
Step-by-Step Reasoning
- Heating times: pick five values evenly spaced across a sensible range. For example, , , , , min (interval of min). Other equally valid choices are , , , , min or , , , , min.
- Same concentration: use the same volume of the same batch of vegetable extract for every time point — otherwise any change in ascorbic acid could be due to the starting concentration rather than the heating time.
- Same temperature: heat at a fixed temperature (e.g. boiling or in a water-bath). Without this, you cannot tell whether the effect is due to time or temperature.
- Thermostatically controlled water-bath: this is the standard way to maintain a constant temperature throughout the experiment; a beaker on a hot plate would fluctuate.
- Measurement: after each heating period, the extract is cooled, then titrated against iodine as in (a)(ii), recording the volume of iodine at the end-point. Plot time (x) against volume of iodine (y), or against calculated ascorbic acid concentration (y).
Any three of these earn the marks.
Key Takeaways
- A controlled experiment varies only the independent variable and keeps all other relevant variables constant.
- A thermostatically controlled water-bath is the standard way to maintain a constant temperature.
- A minimum of five values of the independent variable, evenly spaced, is needed to identify a trend.
Common Mistakes
- Varying the temperature as well as the time — this confounds the experiment.
- Using only two or three time points — too few to identify a trend.
- Suggesting unevenly spaced times (e.g. , , , , min).
- "Use a Bunsen burner to heat the extract" — open flames are unsuitable for controlled temperature work and a hazard.
Things to Be Careful About
- "Heating time" is the independent variable; the temperature is a controlled variable, not the independent one.
- A thermostatically controlled water-bath is more controllable than a Bunsen burner and is the expected answer.
Some chemicals, such as ascorbic acid, have antimicrobial properties. A scientist carried out an investigation to determine the effect of ascorbic acid on the growth of a species of bacterium, B. subtilis.
The growth of bacteria was investigated by measuring the mass of the bacteria when grown on agar containing different concentrations of ascorbic acid.
All other variables were kept constant.
The results are shown in Table 1.2.
Table 1.2
| ascorbic acid concentration / mM | mass of B. subtilis / mg |
|---|---|
| 2.5 | 9.7 |
| 10.0 | 7.2 |
| 20.0 | 4.7 |
| 30.0 | 3.1 |
| 40.0 | 2.4 |
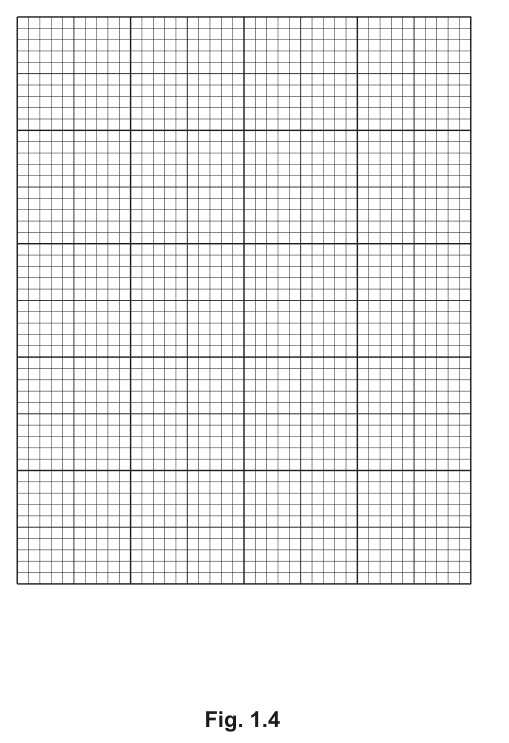
Plot a graph of the data shown in Table 1.2, on the grid in Fig. 1.4.
Use a sharp pencil.
Working
Axes
- x-axis: ascorbic acid concentration / — scale from to (or similar), with taking and labels at least every (i.e. every ).
- y-axis: mass of B. subtilis / — scale from to , with taking and labels at least every (i.e. every ).
Points (small crosses or dots in circles)
Line: thin, smooth, passing through (or very close to) all five points.
Answer
| ascorbic acid concentration / | mass of B. subtilis / |
|---|---|
Plot these five points on the given grid with the axes above, then join them with a thin continuous line. The line will slope steeply downward at first and then level off, indicating that ascorbic acid at low concentrations strongly inhibits B. subtilis growth, while at higher concentrations the effect plateaus.
Scatter graph of ascorbic acid concentration (x) against mass of B. subtilis (y), five points plotted, joined with a thin line.
Background Concept
The data show how the mass of B. subtilis changes as the ascorbic acid concentration is increased. The biology: ascorbic acid is antimicrobial, so increasing its concentration should reduce bacterial growth (lower mass). The graph should show a downward trend that levels off at higher concentrations — the bacteria have a minimum viable mass and cannot be reduced further.
Understanding the Question
The candidate is given five (x, y) pairs and a blank grid. They must plot the data and join the points. The mark scheme rewards four features:
- Correct axis labels with units.
- Sensible scales ( per on x; per on y) and labels at every major tick.
- All five points plotted accurately, with small crosses or dots in circles.
- A thin line joining the points.
Approach
- Choose the axes: ascorbic acid concentration is the independent variable, so it goes on the x-axis; mass of bacteria is the dependent variable, so it goes on the y-axis.
- Choose scales that use at least half the grid in both directions and make plotting easy (e.g. , ).
- Plot each point carefully as a small cross or a dot in a circle.
- Join the points with a thin line — do not extrapolate beyond the first and last points.
Step-by-Step Reasoning
- x-axis: the data range from to . A scale of to with major ticks every uses most of the grid and allows easy plotting. per is the suggested scale.
- y-axis: the data range from to . A scale of to with major ticks every works well; per is the suggested scale.
- Points: plot each (x, y) pair with a small cross (or a dot inside a small circle). Read the x-value off the x-axis to the nearest and the y-value off the y-axis to the nearest .
- Line: join the points with a single thin continuous line. Because the data show a clear non-linear (curved) trend, the line should be a smooth curve rather than a series of straight segments.
Key Takeaways
- The independent variable goes on the x-axis; the dependent variable on the y-axis.
- Choose scales that use at least half the grid and make plotting straightforward.
- A line graph is appropriate when the independent variable is continuous (concentration); use a bar chart only for discrete categories.
- A smooth curve is appropriate when the trend is non-linear; a straight line of best fit is appropriate when the trend is linear.
Common Mistakes
- Swapping the axes (mass on x, concentration on y).
- Using awkward scales, e.g. to with no labels in between, or to which compresses all the data into the bottom-left corner.
- Plotting points as large blobs rather than small crosses or dots in circles.
- Drawing a thick line or extending the line beyond the data range.
- Drawing a straight line through a curved set of points.
Things to Be Careful About
- Use a sharp pencil so points and lines are precise.
- Make sure each point is plotted to the correct precision: x to the nearest , y to the nearest .
- The line should not extrapolate; it should stop at the first and last data points.
Use your graph to calculate the percentage decrease in the mass of the bacteria between and ascorbic acid.
Show your working.
percentage decrease = ______
Working
Step 1 — read the two values from the graph.
- Mass of B. subtilis at ascorbic acid: read directly from the plotted point at .
- Mass of B. subtilis at ascorbic acid: this is between the plotted points at () and (). Read from the line at .
Step 2 — calculate the percentage decrease.
The percentage decrease is the fall divided by the starting value (the value), multiplied by .
(Using the exact midpoint between and : , giving . Other values read from a correctly drawn curve are within ecf tolerance.)
Answer
≈ 62%
Background Concept
A percentage decrease measures the size of a fall relative to the original value. The formula is:
The original value is the starting point of the change, not the final value. In this question the starting concentration is , so the original mass is the one at . Reading both masses from the graph is therefore essential.
Understanding the Question
The candidate has plotted a graph of ascorbic acid concentration (x) against mass of B. subtilis (y) in (b)(i). They must now use that graph to find the percentage decrease in mass as the ascorbic acid concentration is raised from to . The mark scheme awards:
- Correct figures for and from the graph.
- (Decrease ÷ value) × .
Approach
- Read at — this is the original value.
- Read at — this is the final value. The candidate may need to interpolate between and .
- Subtract the final value from the original to get the decrease.
- Divide the decrease by the original value and multiply by .
Step-by-Step Reasoning
- At : the point is plotted at . This is the original value.
- At : this lies halfway between the points at () and (). The line is slightly curved here (it's flattening off), so a careful read at the midpoint gives . The mark scheme allows ecf from a correctly drawn line.
- Decrease: .
- Percentage decrease: .
Key Takeaways
- A percentage change always uses the starting value as the denominator.
- Reading the starting value directly from a plotted point is more reliable than interpolating; the final value at must be interpolated from the curve.
- The line drawn in (b)(i) determines the precision of the read-off — a poorly drawn line will lead to a wrong value in (b)(ii).
Common Mistakes
- Dividing by the final value instead of the original (e.g. ) — biologically this is wrong and the mark scheme rejects it.
- Reading the value at as (using the point) — this gives , a small under-estimate.
- Forgetting to multiply by — gives a value of rather than .
- Forgetting the percentage sign.
Things to Be Careful About
- "Decrease" means the fall, so it is
original − final, notfinal − original. - The denominator is the original value (at ), not the average or the final value.
- The final value is read from the line drawn in (b)(i), not from the data table — the data table only has values at and , so the candidate must interpolate.
The rest of this paper
1 more questions- Q2Use of the Light Microscope · Manipulation, Measurement and Observation · Analysis, Conclusions and Evaluation18M