Biology 9700/33 — October/November 2022
Cambridge AS Level · Advanced Practical Skills · worked solutions for every part, with the mark scheme
Topics Analysis, Conclusions and Evaluation · Manipulation, Measurement and Observation · Presentation of Data and Observations · Use of the Light Microscope
You are provided with a solution labelled E containing an enzyme which coagulates (clots) milk.
Enzyme E hydrolyses (breaks) peptide bonds between certain amino acids in a protein found in milk and this results in the coagulation of the milk.
Calcium ions are needed for this coagulation.
When a mixture of milk, calcium chloride solution and E is gently turned in a test-tube, the milk will coagulate, producing lumps of a white solid in a liquid.
The end-point of the enzyme-catalysed coagulation is when all the milk coagulates, as shown in Fig. 1.1.
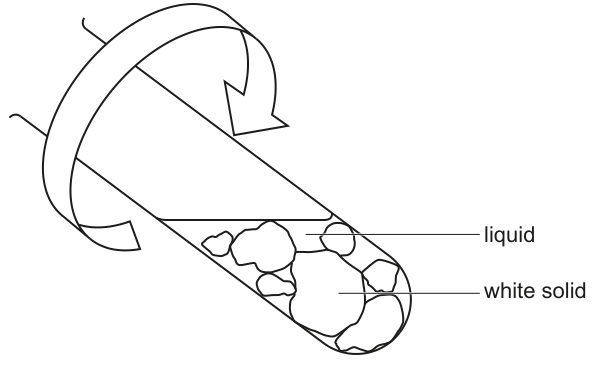
You will investigate the effect of temperature on the time taken to reach the end-point.
You are provided with the materials shown in Table 1.1.
Table 1.1
| labelled | contents | hazard | volume / |
|---|---|---|---|
| M | 100% milk | none | 150 |
| E | enzyme solution | harmful irritant | 20 |
| C | calcium chloride solution | harmful irritant | 20 |
If C or E comes into contact with your skin, wash off immediately under cold water.
It is recommended that you wear suitable eye protection.
You will test the activity of enzyme E at and other temperatures up to a maximum of .
Complete Table 1.2 to show three other temperatures that you will use to show the effect of temperature on the activity of enzyme E.
Table 1.2
| temperature / | ||||
|---|---|---|---|---|
| 30 | ______ | ______ | ______ | 50 |
Carry out step 1 to step 14.
step 1 Set up a water-bath ready for step 6. The starting temperature of the water-bath should be , as shown in Table 1.2.
step 2 Put of M into a test-tube.
step 3 Repeat step 2 so that you have two test-tubes containing M.
step 4 Put of C into each test-tube.
step 5 Gently shake the test-tubes to mix M and C.
step 6 Put the test-tubes into the water-bath and leave for 3 minutes.
Explain why the test-tubes are left in the water-bath for 3 minutes in step 6.
step 7 Remove one of the test-tubes from the water-bath.
The process of coagulation will start when E is added to the test-tube.
step 8 Put of E into the test-tube, so that it runs down the side of the test-tube and forms a layer on the surface of the mixture, as shown in Fig. 1.2.
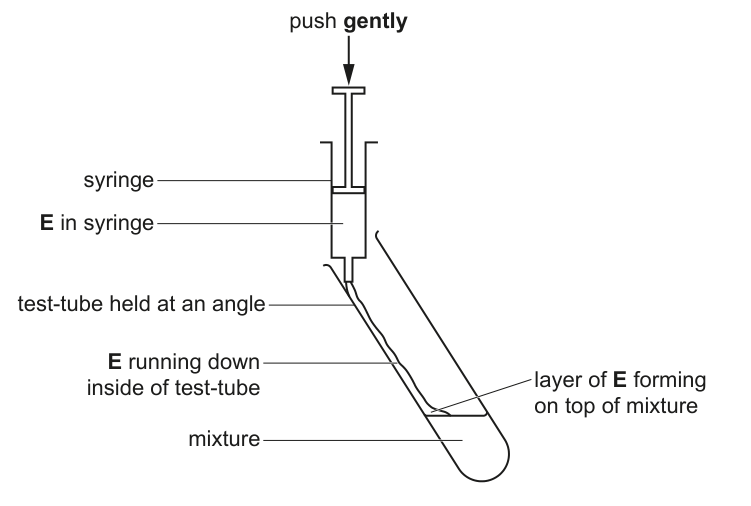
step 9 Gently shake the test-tube to mix the solutions and start timing.
step 10 Rotate the test-tube and continue to rotate it while observing the mixture until the end-point is reached. Stop timing when the end-point is reached.
If the end-point has not been reached by 180 seconds, stop timing and record this as 'more than 180'.
step 11 Record in (a)(iii) the time to reach the end-point.
step 12 Repeat step 7 to step 11 with the other test-tube in the water-bath.
step 13 Set up the water-bath at the next temperature after stated in Table 1.2.
step 14 Repeat step 2 to step 13 for each temperature stated in Table 1.2.
Record your results in an appropriate table.
State the independent variable in this experiment.
Suggest a suitable control for this investigation to show that it is the enzyme E that coagulates the milk.
The procedure described by step 1 to step 14 investigated the effect of temperature on the activity of enzyme E, using the time taken to reach the end-point.
Describe how you would modify the procedure to investigate the effect of changing the concentration of milk on the time taken to reach the end-point.
A scientist carried out an investigation into the effect of enzyme concentration on the coagulation of milk. The scientist calculated the activity of the enzyme for each concentration of enzyme.
The results are shown in Table 1.3.
Table 1.3
| % enzyme concentration | activity of enzyme / arbitrary units (au) |
|---|---|
| 0.05 | 19 |
| 0.10 | 34 |
| 0.15 | 50 |
| 0.20 | 65 |
| 0.30 | 96 |
Plot a graph of the data in Table 1.3 on the grid in Fig. 1.3.
Use a sharp pencil.

Use your graph to determine the activity of the enzyme when the enzyme concentration is 0.25%.
Show on your graph how you determined this value.
activity of the enzyme = ______
Describe the trend in the results shown by your graph.
Suggest an explanation for the trend you described in (b)(iii).
The rest of this paper
1 more questions- Q2Use of the Light Microscope · Analysis, Conclusions and Evaluation19M