Biology 9700/34 — May/June 2022
Cambridge AS Level · Advanced Practical Skills · worked solutions for every part, with the mark scheme
Topics Analysis, Conclusions and Evaluation · Manipulation, Measurement and Observation · Presentation of Data and Observations · Use of the Light Microscope
In industry it is important that scientists are able to estimate the concentration of chemicals in plant extracts such as fruit juice.
Sucrose is a non-reducing sugar that can be hydrolysed to form reducing sugars.
You will prepare known concentrations of a reducing sugar by serial dilution. You will then use the known concentrations to estimate the concentration of a reducing sugar produced by hydrolysis of a sucrose solution.
You are provided with the materials shown in Table 1.1.
Table 1.1
| labelled | contents | hazard | volume / |
|---|---|---|---|
| R | 1.0% reducing sugar solution | none | 50 |
| B | Benedict's solution | harmful irritant | 30 |
| W | distilled water | none | 100 |
If any solution comes into contact with your skin, wash off immediately under cold water.
It is recommended that you wear suitable eye protection.
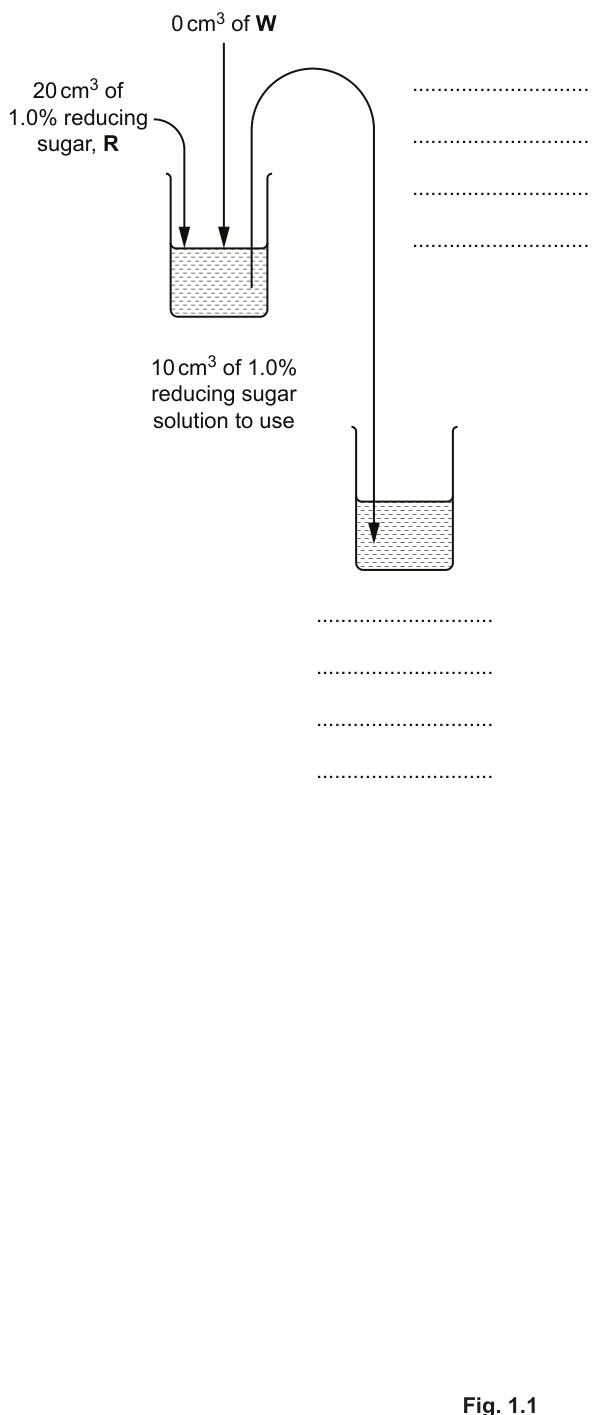
You will need to carry out a serial dilution of the 1.0% reducing sugar solution, R, to reduce the concentration by half between each successive dilution.
You will need to prepare four concentrations of solution in addition to the 1.0% reducing sugar solution, R.
After the serial dilution is completed, you will need to have of each concentration available to use.
Complete Fig. 1.1 to show how you will prepare your serial dilution.
Fig. 1.1 shows the first two beakers you will use to make your serial dilution. You will need to draw three additional beakers.
For each beaker add labelled arrows to show:
- the volume of reducing sugar solution transferred
- the volume of distilled water, W, added.
Under each beaker, state the concentration of reducing sugar solution.
Carry out step 1 to step 11.
step 1 Set up a water-bath and heat it to boiling ready for step 6.
step 2 Prepare the concentrations of reducing sugar solution, as decided in (a)(i), in the beakers provided.
step 3 Label the test-tubes with the concentrations you prepared in step 2.
step 4 Put of each reducing sugar concentration into the appropriately labelled test-tube. Put these test-tubes into a test-tube rack.
step 5 Put of Benedict's solution, B, into each of the test-tubes from step 3. Shake gently to mix.
step 6 Put the test-tube labelled 1.0% into the boiling water-bath. Start timing.
step 7 Measure the time taken to the first appearance of a colour change in the test-tube. If there is no colour change after 120 seconds, stop timing and record as 'more than 120'.
step 8 Record the result from step 7 in (a)(ii).
step 9 Remove the test-tube from the water-bath. Put the test-tube in the test-tube rack.
step 10 Repeat step 6 to step 9 with the remaining concentrations of reducing sugar.
step 11 Turn off the water-bath. You will need this again in step 16 and in step 23.
Record your results in an appropriate table.
State one significant source of error when measuring the dependent variable in this investigation.
Suggest how you could improve the procedure to reduce the error you stated in (a)(iii).
You will:
- carry out the test for non-reducing sugar on the unknown concentration of sucrose, U
- estimate the concentration of the reducing sugar fructose in U.
You are provided with the materials shown in Table 1.2. You will also need to use the Benedict's solution, B, shown in Table 1.1.
Table 1.2
| labelled | contents | hazard | volume / |
|---|---|---|---|
| U | unknown concentration of sucrose solution | none | 20 |
| H | dilute hydrochloric acid | irritant | 10 |
| A | 10g sodium hydrogencarbonate powder | none | — |
If any solution comes into contact with your skin, wash off immediately under cold water.
It is recommended that you wear suitable eye protection.
Carry out step 12 to step 27.
step 12 Heat the water-bath to boiling ready for step 16 and step 23.
step 13 Label a clean test-tube U.
step 14 Put of U into the test-tube labelled U.
step 15 Put of H into this test-tube. Shake gently to mix.
step 16 Put test-tube U into the boiling water-bath. Leave the test-tube for 2 minutes.
step 17 After 2 minutes, remove the test-tube from the water-bath and put it into the beaker labelled For cooling.
step 18 Leave the test-tube in the beaker for 3 minutes.
step 19 After 3 minutes, use a spatula to put a small amount of A into test-tube U. The mixture will fizz and rise up the test-tube.
step 20 Repeat step 19 until there is no more fizzing and there is a small amount of A in the bottom of the test-tube.
step 21 Put of B into test-tube U.
step 22 Shake the test-tube gently to mix.
step 23 Put test-tube U into the boiling water-bath. Start timing.
step 24 Measure the time taken to the first appearance of a colour change in the test-tube. If there is no colour change after 120 seconds, stop timing and record as 'more than 120'.
step 25 Record the result in (a)(v).
step 26 Remove the test-tube from the water-bath. Put the test-tube in the test-tube rack.
step 27 Turn off the water-bath.
State the result for U.
result for U = ______
Using results from (a)(ii) and (a)(v), estimate the concentration of reducing sugars in U.
concentration of reducing sugars in U = ______
Calculate the concentration of fructose in U. Explain how you determined this concentration.
concentration of fructose in U = ______
explanation
A student investigated the effect of different concentrations of sucrose solution on the mass of pieces of potato tissue.
The mass of each piece of potato tissue was measured before and after soaking in different concentrations of sucrose for 1 hour and the change in mass calculated.
Table 1.3 shows the results of this investigation.
Table 1.3
| concentration of sucrose solution / | change in mass / |
|---|---|
| 0 | +0.60 |
| 0.2 | +0.31 |
| 0.4 | 0.00 |
| 0.6 | -0.29 |
| 0.8 | -0.45 |
| 1.0 | -0.66 |
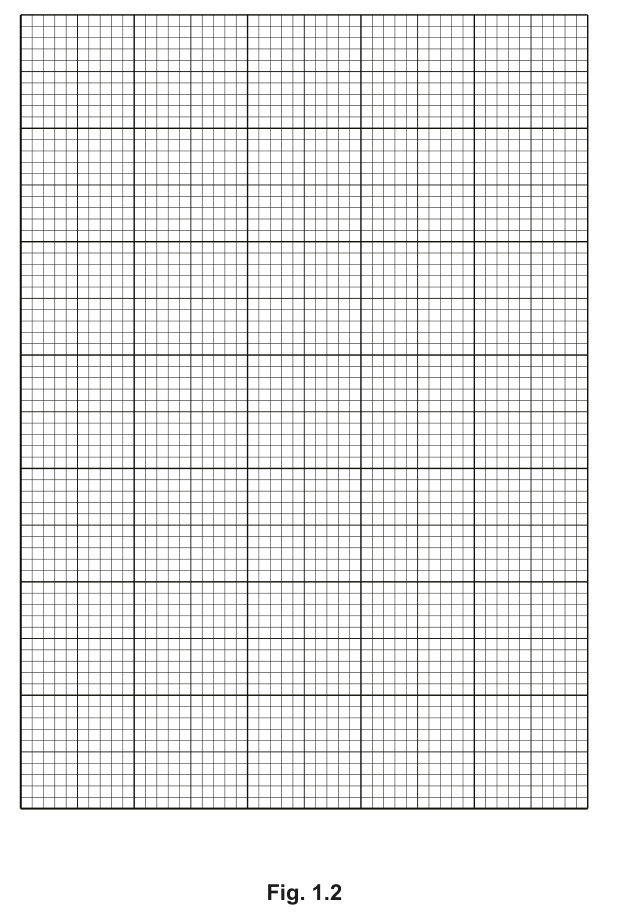
Plot a graph of the data shown in Table 1.3 on the grid in Fig. 1.2.
Use a sharp pencil.
Using your knowledge of water potential, explain the difference in the change of mass between the potato piece in the sucrose solution and the potato piece in the sucrose solution.
The rest of this paper
1 more questions- Q2Use of the Light Microscope · Analysis, Conclusions and Evaluation20M