Biology 9700/32 — May/June 2022
Cambridge AS Level · Advanced Practical Skills · worked solutions for every part, with the mark scheme
Topics Manipulation, Measurement and Observation · Presentation of Data and Observations · Analysis, Conclusions and Evaluation · Use of the Light Microscope
Plant tissues contain the enzyme catalase which catalyses the breakdown of hydrogen peroxide into oxygen gas and water.
Ascorbic acid acts as an inhibitor of catalase.
You will investigate the effect of changing ascorbic acid concentration on catalase inhibition.
You are provided with the materials shown in Table 1.1.
Table 1.1
| labelled | contents | hazard | volume / |
|---|---|---|---|
| H | hydrogen peroxide solution | harmful irritant | 50 |
| W | distilled water | none | 50 |
| A | ascorbic acid solution | irritant | 10 |
If H or A comes into contact with your skin, wash off immediately under cold water.
It is recommended that you wear suitable eye protection.
You are also provided with five cylinders of potato tissue, labelled P.
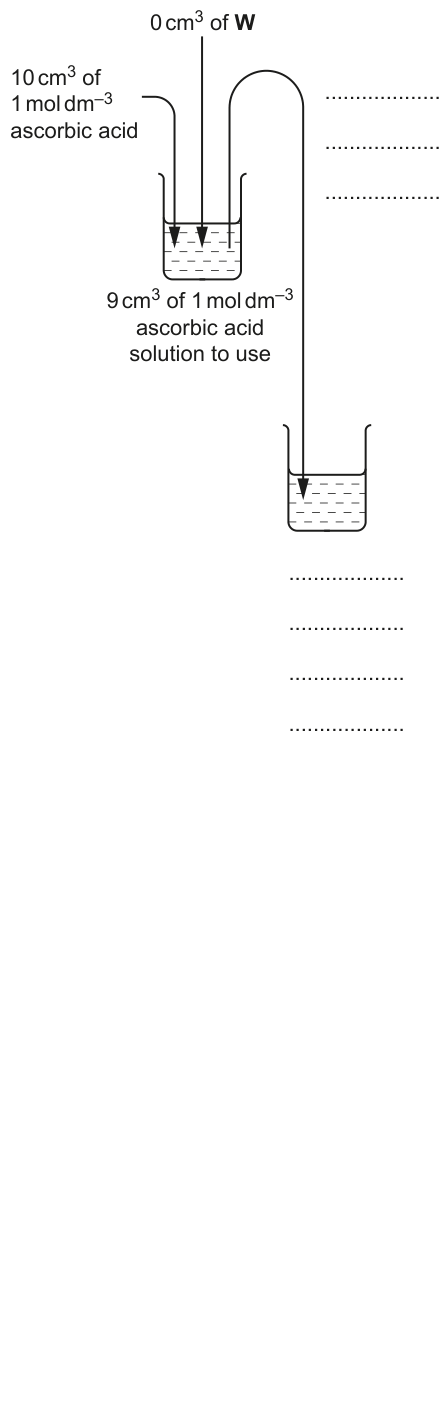
You will need to carry out a serial dilution of the ascorbic acid, A, to reduce the concentration by a factor of ten between each successive dilution.
You will need to prepare four concentrations of ascorbic acid in addition to the ascorbic acid solution, A.
After the serial dilution is completed, you will need to have of each concentration available to use.
Complete Fig. 1.1 to show how you will prepare your serial dilution.
Fig. 1.1 shows the first two beakers you will use to make your serial dilution. You will need to draw three additional beakers.
For each beaker, add labelled arrows to show:
- the volume of ascorbic acid solution transferred
- the volume of distilled water, W, added.
Under each beaker, state the concentration of ascorbic acid solution.
Carry out step 1 to step 13.
step 1 Prepare the concentrations of ascorbic acid solution, as decided in (a)(i), in the beakers provided.
step 2 Label test-tubes with the ascorbic acid concentrations prepared in step 1.
step 3 Label another test-tube 0.
step 4 On a white tile carefully cut the cylinders of potato tissue into thin discs that are approximately thick.
You will need to cut at least 70 discs.
step 5 Place 10 potato discs into each labelled test-tube.
step 6 Add distilled water, W, to the test-tube labelled 0.
step 7 Add of each concentration of ascorbic acid to the appropriately labelled test-tubes.
step 8 Set up the apparatus as shown in Fig. 1.2 using the test-tube labelled 0. The syringe barrel should be fully submerged in the beaker of water, B.
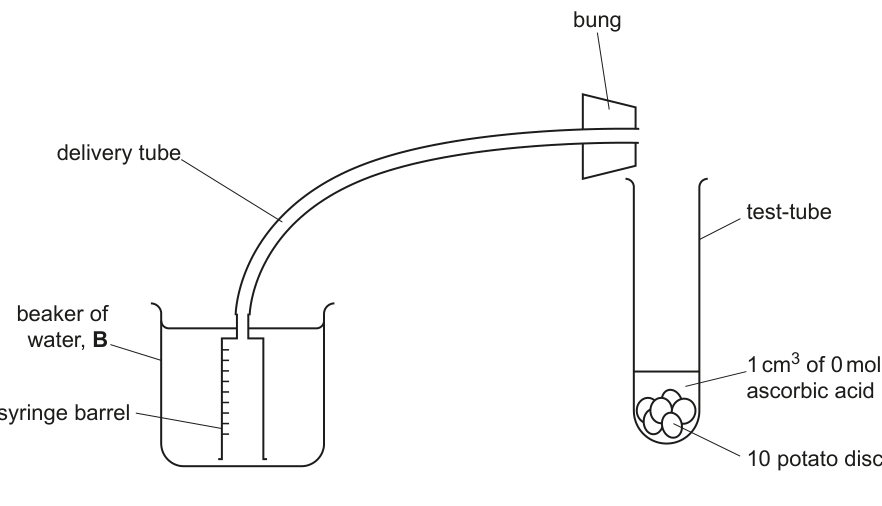
step 9 Add of hydrogen peroxide solution H to the test-tube labelled 0. Place the bung into the top of the test-tube, making sure that the syringe barrel stays fully submerged.
step 10 Record in (a)(ii) the initial volume of gas in the syringe barrel then start the stop-clock.
step 11 After 2 minutes record in (a)(ii) the final volume of gas in the syringe barrel. If the syringe barrel is full of gas, record as 10.
step 12 Repeat step 9 to step 11 with each of the test-tubes labelled in step 2.
step 13 Calculate the total volume of gas produced at each concentration of ascorbic acid. Record these processed results in (a)(ii).
Record your results in an appropriate table, including raw results and processed results.
Use your results in (a)(ii) to identify the greatest volume of gas produced in the reaction.
greatest volume of gas produced = ______
Use your answer to calculate the rate of gas production.
Show your working.
rate of gas production = ______
Describe two improvements to the procedure that would make the measurements more accurate.
1 ______
2 ______
Carry out step 14 to step 18.
step 14 Label a test-tube T.
step 15 Put of H into test-tube T.
step 16 Use a thermometer to measure the temperature of H in test-tube T. Record this value, to the nearest , in (b)(i).
step 17 Add 10 discs of potato tissue to test-tube T and start timing.
step 18 After 2 minutes measure the temperature of the mixture in test-tube T. Record this value, to the nearest , in (b)(i).
State the temperature of H before adding potato discs (step 16). ______
State the temperature of H 2 minutes after adding potato discs (step 18).
______
Calculate the change in temperature after 2 minutes. ______
State whether temperature is a significant source of error in this investigation.
Explain your answer.
A study was carried out in which volunteers were given different daily doses of ascorbic acid (vitamin C) in addition to their normal diet. The maximum ascorbic acid concentration in the blood plasma of each volunteer was measured.
The results are shown in Table 1.2.
Table 1.2
| ascorbic acid daily dose / mg | maximum ascorbic acid concentration in blood plasma / |
|---|---|
| 0 | 6 |
| 50 | 25 |
| 200 | 68 |
| 500 | 75 |
| 1000 | 75 |
Plot a graph of the data in Table 1.2 on the grid in Fig. 1.3.
Use a sharp pencil.

Suggest an explanation for the results for a daily dose of and the results for daily doses of between .
______
______
The rest of this paper
1 more questions- Q2Use of the Light Microscope18M