Biology 9700/31 — May/June 2022
Cambridge AS Level · Advanced Practical Skills · worked solutions for every part, with the mark scheme
Topics Manipulation, Measurement and Observation · Presentation of Data and Observations · Analysis, Conclusions and Evaluation · Use of the Light Microscope
Plant extracts contain molecules which have many uses in industry and as medicines.
It is important for scientists to be able to estimate the concentration of these molecules in plant extracts.
You will estimate the concentration of molecule R in a sample of plant extract U.
You are provided with the materials shown in Table 1.1.
Table 1.1
| labelled | contents | hazard | volume / |
|---|---|---|---|
| 10R | 10% solution of molecule R | none | 100 |
| W | distilled water | none | 100 |
| U | unknown concentration of molecule R in a plant extract | none | 40 |
| A | sulfuric acid solution | harmful irritant | 20 |
| K | potassium manganate(VII) solution | irritant | 20 |
If any of the solutions come into contact with your skin, wash off immediately under cold water.
It is recommended that you wear suitable eye protection and wear gloves to protect your hands when using A and K.
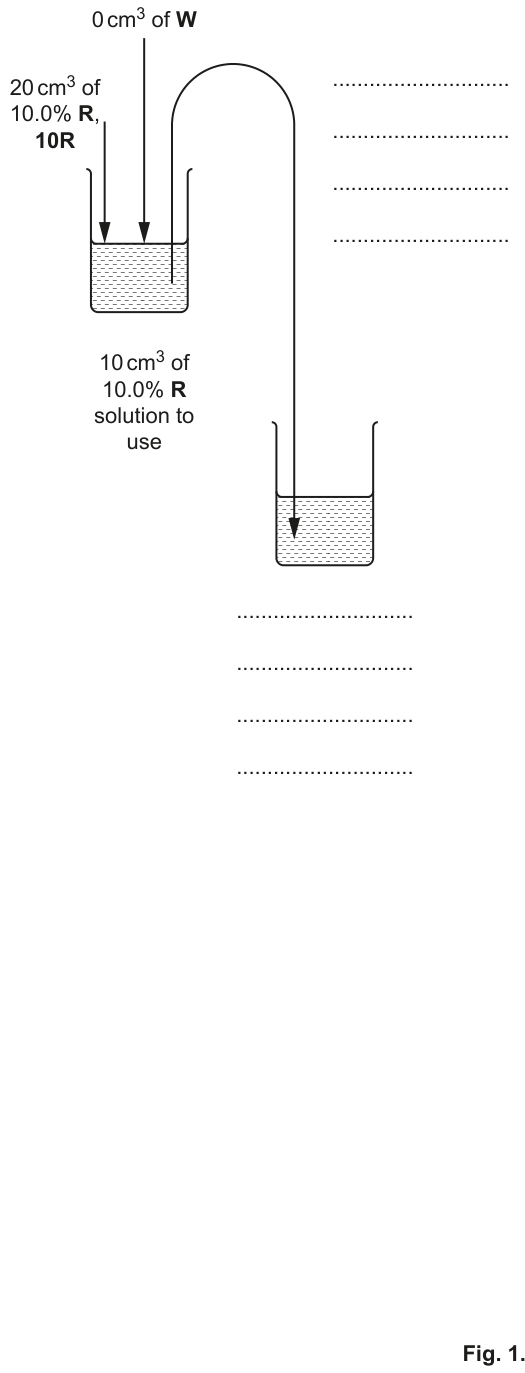
You will need to carry out a serial dilution of the 10% molecule R solution, 10R, to reduce the concentration by half between each successive dilution.
You will need to prepare four concentrations of molecule R solution in addition to the 10% molecule R solution, 10R.
After the serial dilution is completed, you will need to have of each concentration available to use.
Complete Fig. 1.1 to show how you will prepare your serial dilution.
Fig. 1.1 shows the first two beakers you will use to make your serial dilution. You will need to draw three additional beakers.
For each beaker add labelled arrows to show:
- the volume of molecule R solution transferred
- the volume of distilled water, W, added.
Under each beaker, state the concentration of molecule R solution.
Molecule R changes an acidified potassium manganate(VII) solution, K, from a pink colour to colourless.
The lower the concentration of molecule R, the greater the volume of R needed to change the potassium manganate(VII) from pink to colourless (the end-point).
Carry out step 1 to step 12.
step 1 Prepare the concentrations of molecule R solution, as decided in (a)(i), in the beakers provided.
step 2 Label 5 test-tubes with the concentrations of R you prepared in step 1.
step 3 Put of A into the test-tube labelled 10%.
step 4 Put of K into the same test-tube and mix well.
step 5 Put the nozzle of a clean syringe into the beaker containing 10% R.
step 6 Pull the plunger out to the mark so that of 10% R enters the syringe.
step 7 Put the syringe containing 10% R into the test-tube from step 4 as shown in Fig. 1.2.
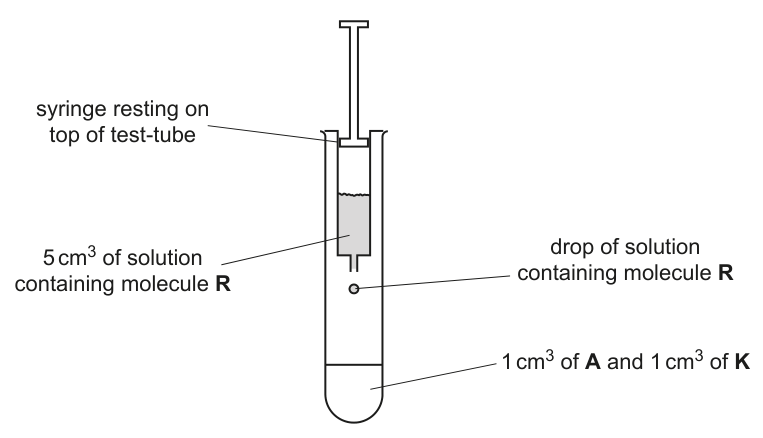
You will be counting the number of drops needed to change K from pink to colourless (the end-point).
step 8 Gently press the plunger to add one drop of solution containing molecule R.
step 9 Mix well.
step 10 If the mixture stays pink repeat step 8 and step 9. Count the number of drops released to reach the end-point. If the number of drops needed to reach the end-point is more than 100, record as 'more than 100'.
step 11 Record the results in (a)(ii).
step 12 Repeat step 3 to step 11 for each of the concentrations of molecule R prepared in step 1.
Record your results in an appropriate table.
State two significant sources of error when measuring the dependent variable in this investigation.
Suggest how you could improve the procedure to reduce one of the errors stated in (a)(iii).
step 13 Repeat step 3 to step 10 with U, the unknown concentration of molecule R.
step 14 Record your result in (a)(v).
State the number of drops of U needed to reach the end-point.
number of drops of U = ______
Complete Fig. 1.3 to show the positions of each of the percentage concentrations of molecule R solution recorded in (a)(ii).
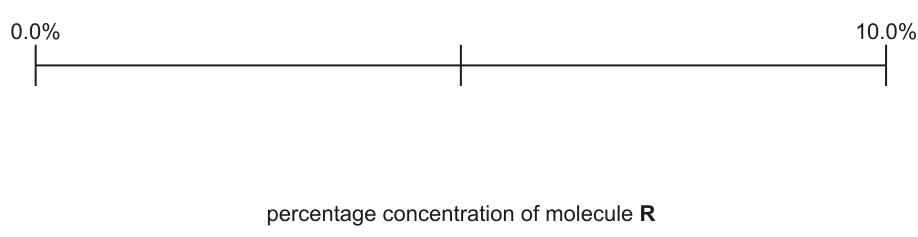
Use your results in (a)(ii) and (a)(v) to estimate the concentration of molecule R in solution U.
Show this estimate of the concentration of U on Fig. 1.3, by placing the letter U on the line in the correct position.
A student investigated the concentration of molecule R in extracts from different plants.
The student added a fixed volume of the extract to acidified potassium manganate(VII) and timed how long it took to reach the end-point.
The results are shown in Table 1.2.
Table 1.2
| plant extract | time / s |
|---|---|
| B | 15 |
| C | 59 |
| D | 42 |
| E | 10 |
| F | 7 |
Plot a bar chart of the data shown in Table 1.2 on the grid in Fig. 1.4.
Use a sharp pencil.

Suggest which plant extract would contain the highest concentration of R.
Scientists have suggested that a different molecule in the plant extract might act as an antibiotic.
The scientists tested this by:
- spreading bacteria over the surface of agar gel containing nutrients
- putting small drops () of different concentrations of the plant extract into separate wells in the agar gel
- incubating the agar gel for 20 hours
- measuring the inhibition area (where the bacteria were not observed) for each concentration of plant extract.
The results are shown in Fig. 1.5.
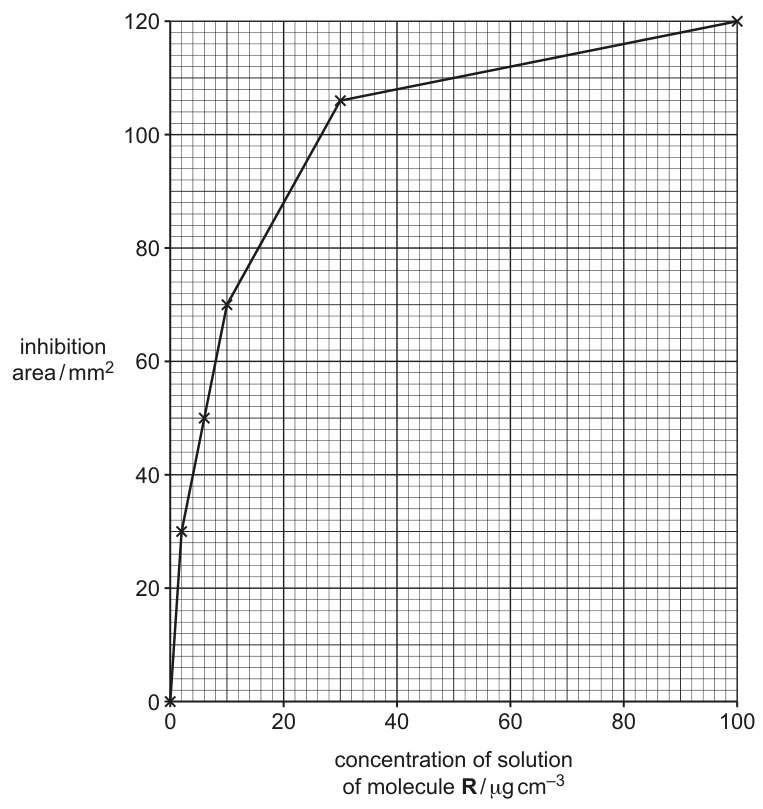
Use the graph in Fig. 1.5 to estimate the concentration of plant extract that results in an inhibition area of .
concentration of plant extract = ______
Suggest how the molecule in the plant extract may inhibit the growth of the bacteria.
The rest of this paper
1 more questions- Q2Use of the Light Microscope18M