Biology 9700/21 — May/June 2022
Cambridge AS Level · AS Level Structured Questions · worked solutions for every part, with the mark scheme
Topics Cell Membranes and Transport · Cell Structure · Gas Exchange · Transport in Mammals · Immunity · Enzymes · +4 more
Fig. 1.1 and Fig. 1.2 are photomicrographs showing the distribution of tissues in the lungs.
Fig. 1.1 is a photomicrograph of a section through part of the lungs.
Fig. 1.2 is a high-power view of the area indicated on Fig. 1.1.
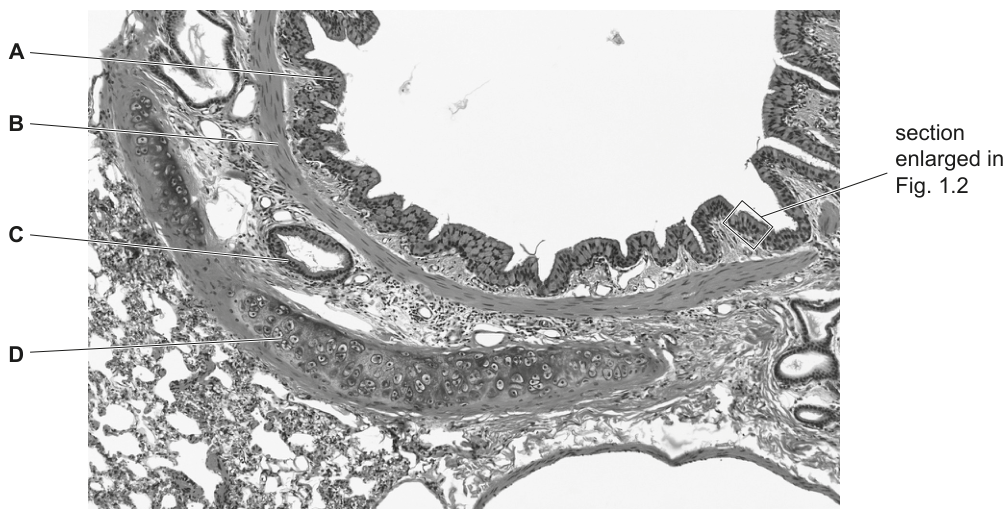
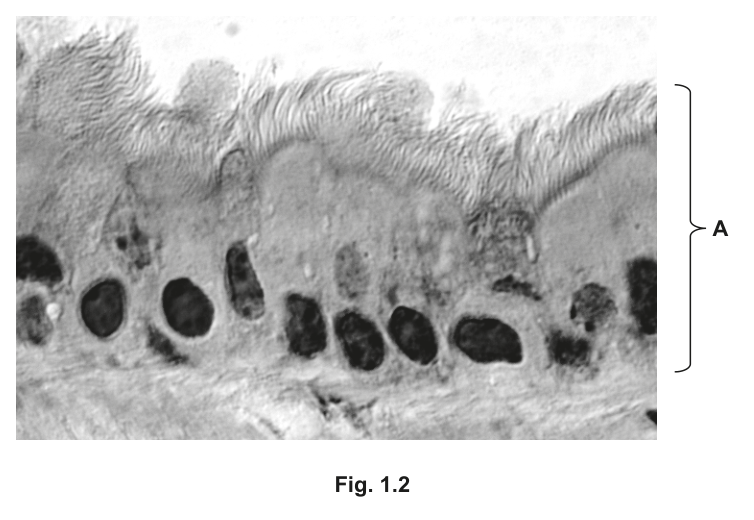
State the names of the tissues A, B and D.
A ______
B ______
D ______
Answer
- A: ciliated epithelium
- B: smooth muscle
- D: cartilage
A: ciliated epithelium; B: smooth muscle; D: cartilage
Background Concept
The conducting airways of the human gas exchange system (trachea → primary bronchi → secondary bronchi → bronchioles) are lined by a characteristic set of tissues, each with a recognisable appearance under the light microscope. Knowing their structure helps link form to function in the lung.
- Ciliated epithelium (also called ciliated columnar epithelium): a single layer of tall cells with cilia projecting from the apical (luminal) surface, and interspersed goblet cells. It appears as a folded, wavy band of cells lining the airway lumen. Its role is to move mucus (the mucociliary escalator).
- Smooth muscle: a layer of spindle-shaped, unstriated muscle cells lying beneath the epithelium. It appears as a paler, more uniform band; in the bronchi/bronchioles it controls airway diameter (bronchoconstriction/bronchodilation).
- Cartilage: supporting tissue that, in the trachea and bronchi, appears as irregular plates of pale, glassy matrix with chondrocytes sitting in lacunae. It keeps the larger airways open during breathing.
- Mucous glands (C): acinar clusters of secretory cells in the submucosa that produce mucus.
Understanding the Question
The question supplies a low-power photomicrograph (Fig. 1.1) of a section through part of the lungs. Four labels — A, B, C, D — point to different identifiable features of the airway wall. You are asked to name tissues A, B and D (glands C are dealt with in part (b)).
Approach
Read each label and identify the tissue by its position in the airway wall and its microscopic appearance. Use the typical arrangement of an airway, from lumen outwards: ciliated epithelium → smooth muscle → glands (in the submucosa of bronchi) → cartilage plates (in trachea and bronchi).
Step-by-Step Reasoning
- Label A points to the folded, wavy tissue that lines the lumen of the airway. Its free surface is covered by fine projections (cilia), and the dark-stained nuclei of the epithelial cells can be seen in a row. This is ciliated epithelium.
- Label B points to the layer just beneath the epithelium, which appears as a uniform, paler band of elongated cells with no striations and no cilia. This is smooth muscle.
- Label D points to a pale, glassy plate with cells sitting in small spaces (lacunae), located deep in the airway wall. This is cartilage.
Key Takeaways
The wall of a bronchus (from lumen outwards) is: ciliated epithelium (with goblet cells) → lamina propria → smooth muscle → submucosa containing mucous glands → cartilage (C-shaped rings in trachea/bronchi, plates in smaller bronchi). Recognising each layer in a micrograph is a transferable skill for any histology image of a tubular organ.
Common Mistakes
- Calling A "columnar epithelium" alone — the mark scheme requires the term ciliated epithelium (and "columnar" by itself is not credited without "ciliated").
- Confusing cartilage with smooth muscle — cartilage looks glassy with chondrocytes in lacunae, whereas smooth muscle is more fibrous and uniform.
- Naming goblet cells as a separate tissue in answer to A — goblet cells are part of the ciliated epithelium.
Things to Be Careful About
Always include the qualifier "ciliated" when naming the lining of the conducting airways; "epithelium" alone is too vague and loses the mark.
Describe the role of the glands labelled C in Fig. 1.1 in maintaining the health of the gas exchange system.
Answer
- Glands C secrete mucus (mucin).
- The mucus forms a layer over the ciliated epithelium lining the airways.
- The mucus traps pathogens and particles (bacteria, viruses, dust, pollen, fungal spores).
- The cilia beat to move the mucus (with trapped particles) away from the alveoli / towards the back of the mouth.
- This prevents pathogens reaching the gas exchange surface (alveoli).
Mucous glands secrete mucus which forms a layer over the ciliated epithelium; it traps pathogens/dust; cilia move the mucus away from the alveoli so pathogens cannot reach the gas exchange surface.
Background Concept
The gas exchange surface in the lungs (alveoli) is delicate, moist and extremely thin — ideal for rapid diffusion of gases, but also vulnerable to invasion by inhaled microorganisms and particulates. The conducting airways therefore act as an air-conditioning and defence system before the air ever reaches the alveoli. Two cell/tissue types collaborate in this defence:
- Mucous glands in the submucosa of the trachea and bronchi secrete mucus (a sticky glycoprotein-rich fluid, sometimes called mucin when referring to its active component).
- Ciliated epithelium lining the airways bears motile cilia that beat in a coordinated, wave-like manner.
Together they form the mucociliary escalator: mucus traps inhaled debris, and the cilia push that mucus — and its trapped cargo — up and out of the lungs.
Understanding the Question
Glands labelled C in Fig. 1.1 are the mucous (submucosal) glands seen in the wall of the bronchus. You are asked to describe how they help keep the gas exchange system healthy — that is, how they fit into the body's defence of the alveoli.
Approach
The mark scheme requires (1) the secretion of mucus as a basic fact, and (2) any two further points describing how that mucus protects the gas exchange surface. Cover the secretion → layer formation → trapping → ciliary transport → protection sequence.
Step-by-Step Reasoning
- Secretion: Glands C secrete mucus (mucin). This is the basic starting fact (1 mark).
- Layer formation: The secreted mucus spreads as a thin sticky layer over the ciliated epithelium lining the airway.
- Trapping: Inhaled particles — bacteria, viruses, other pathogens, dust, pollen, fungal spores — stick to the mucus and are held there rather than reaching the alveolar surface.
- Transport: The cilia of the ciliated epithelium beat in a coordinated rhythm, propelling the mucus layer (with trapped debris) upwards, away from the alveoli and towards the back of the throat, where it is swallowed or expectorated.
- Protection of gas exchange: Because pathogens are trapped and removed before they reach the alveoli, the delicate gas exchange surface is shielded from infection and damage.
Key Takeaways
The mucous glands and the ciliated epithelium work together as the mucociliary escalator: mucus traps; cilia transport. Removing debris before it reaches the alveoli is essential because infection of the gas exchange surface (e.g. pneumonia) seriously impairs oxygen uptake.
Common Mistakes
- Writing "excrete mucus" — rejected by the mark scheme. The correct verb is secrete (or produce/release).
- Writing "mucus is moved by ciliated cells" — also rejected. It must be moved by cilia, not by the cells themselves.
- Forgetting the trapping step — saying only that "mucus moves" without explaining what it carries.
- Not linking the action to the protection of the gas exchange surface specifically.
Things to Be Careful About
Read the command word: this is a describe question with three marks, so write three distinct points (secretion + two of {layer / trapping / transport / protection}). Use precise terminology — "mucus", "cilia", "pathogens" — rather than vague words such as "germs" or "stuff".
Hyperventilation occurs when a person breathes too fast or too deeply.
The effects of hyperventilation are:
- a decrease in the partial pressure of carbon dioxide in alveolar air
- an increase in the pH of the blood.
Fig. 1.3 shows the change in the oxygen dissociation curve as a result of hyperventilation.
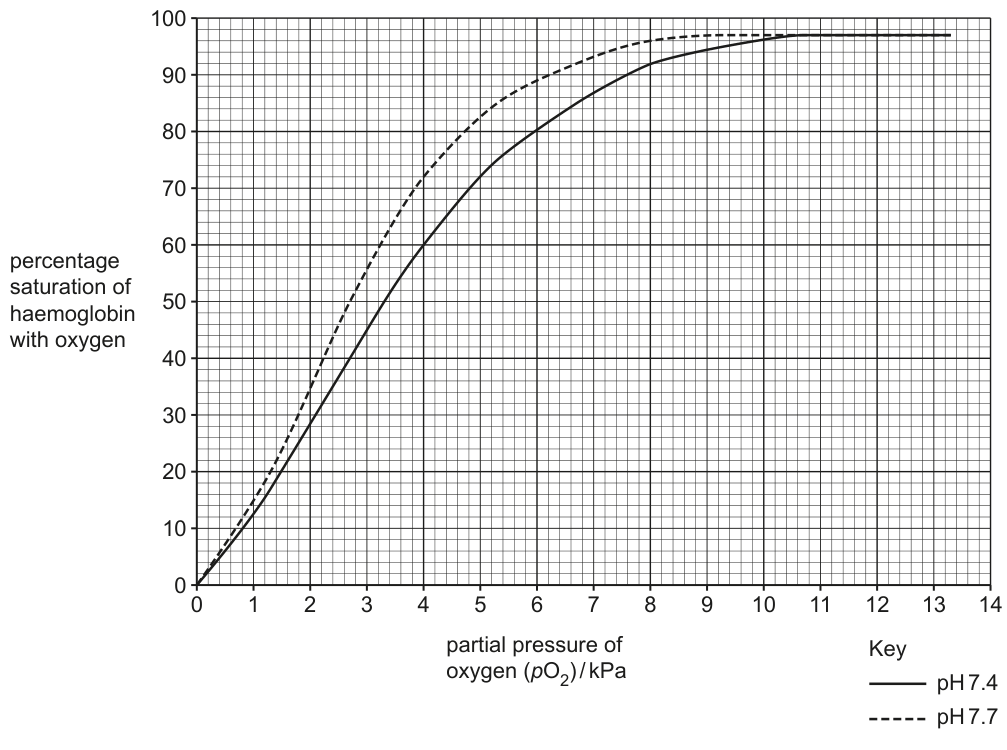
State the percentage saturation of haemoglobin at a of .
pH = 7.7 ______
pH = 7.4 ______
Working
Locate on the x-axis. Move vertically up to each curve and read the percentage saturation on the y-axis.
Answer
- pH 7.7 ≈ 72%
- pH 7.4 ≈ 60%
pH 7.7 = 72%; pH 7.4 = 60%
Background Concept
The oxygen dissociation curve plots the percentage saturation of haemoglobin with oxygen against the partial pressure of oxygen (). Its characteristic sigmoid (S-shaped) form arises from cooperative binding between the four globin subunits of haemoglobin. Shifts in the curve indicate changes in haemoglobin's affinity for oxygen:
- Curve shifts left = haemoglobin has a higher affinity for O2 (binds O2 more readily at any given ).
- Curve shifts right = haemoglobin has a lower affinity for O2 (releases O2 more readily).
A higher blood pH (lower ) shifts the curve to the left — this is the basis of the Bohr shift that occurs in the lungs.
Understanding the Question
Fig. 1.3 shows two dissociation curves: the standard curve at pH 7.4 (solid line) and the curve at pH 7.7 (dashed line, shifted to the left). You are asked to read off, from each curve, the percentage saturation of haemoglobin at — a value representative of the partial pressure of oxygen in respiring tissues.
Approach
Trace a vertical line up from on the x-axis. Where it crosses each curve, read horizontally to the y-axis.
Step-by-Step Reasoning
- At the pH 7.4 curve is read at approximately 60% saturation.
- At the pH 7.7 curve is read at approximately 72% saturation (it sits higher because the leftward shift means more O2 is bound at every ).
Both readings are within the mark scheme's accepted ranges.
Key Takeaways
Being able to extract numerical values from a dissociation curve and to interpret the direction of any shift is a key skill in gas-exchange physiology.
Common Mistakes
- Reading the values at the wrong — always go vertically from the x-axis value first.
- Confusing the two curves — the dashed line (pH 7.7) sits above the solid line (pH 7.4) at any given in the rising part of the curve.
- Quoting with incorrect units (e.g. "kPa" for a percentage saturation) — the answer is a percentage.
Things to Be Careful About
Read to the nearest whole percent on the y-axis. The mark scheme accepts 72% / 60% (or anything within a tight tolerance, e.g. 70–73 / 58–62).
Use the information in Fig. 1.3 to state and explain the effect of hyperventilation on the supply of oxygen to the respiring tissues.
Answer
- Hyperventilation decreases the supply of oxygen to the respiring tissues.
- At higher blood pH (lower ) haemoglobin has a higher affinity for oxygen, so less oxygen dissociates from haemoglobin at the respiring tissues.
Hyperventilation decreases the supply of oxygen to respiring tissues because, at higher pH, haemoglobin has a higher affinity for oxygen and so releases less of it to the tissues.
Background Concept
Haemoglobin must do two opposing things efficiently:
- Load O2 in the lungs, where is high.
- Unload O2 at respiring tissues, where is low.
Its affinity for O2 is therefore not fixed — it is modulated by local conditions. The Bohr shift describes the effect of pH / :
- In respiring tissues, is produced and combines with water (catalysed by carbonic anhydrase) to form carbonic acid, lowering the pH. The lower pH decreases haemoglobin's affinity for O2, shifting the curve to the right and favouring O2 release exactly where it is needed.
- In the lungs, diffuses out, pH rises, affinity rises, and the curve shifts to the left — favouring O2 loading.
This elegant reciprocity is what makes haemoglobin such an efficient oxygen transporter.
Understanding the Question
Hyperventilation lowers alveolar , which raises blood pH. The dashed curve at pH 7.7 in Fig. 1.3 shows the consequence: the dissociation curve has shifted to the left, meaning haemoglobin now holds on to O2 more tightly. The question asks you to predict and explain what this means for the delivery of oxygen to tissues.
The instinctive wrong answer is "more oxygen is delivered" — because the curve is higher (more saturation at any given ). The correct answer is the opposite: a leftward shift helps loading but hurts unloading, because haemoglobin will not release O2 readily even where is low.
Approach
Combine two ideas:
- Identify the direction of the curve shift (left) caused by hyperventilation.
- Translate this into a statement about oxygen release at the tissues — not just saturation.
Step-by-Step Reasoning
- Effect of hyperventilation on the curve: higher pH (7.7) shifts the dissociation curve to the left, so haemoglobin has a higher affinity for oxygen.
- Consequence in respiring tissues: although haemoglobin becomes more saturated in the lungs, it is now less willing to release that oxygen when it reaches the tissues. Less O2 dissociates from haemoglobin at the low of respiring cells.
- Data support (optional credit): at , haemoglobin remains 72% saturated at pH 7.7 versus only 60% at pH 7.4 — i.e. an extra ~12% of the carrying capacity is being held back at the tissues.
- Conclusion: hyperventilation reduces the supply of oxygen to the respiring tissues.
Key Takeaways
- A leftward shift of the dissociation curve favours loading but hinders unloading.
- The Bohr effect is a physiological mechanism: -rich, more acidic tissues automatically promote O2 release, while -poor, more alkaline lungs promote O2 uptake.
- Hyperventilation disrupts this balance — even though arterial rises a little, the leftward Bohr shift reduces the delivery of O2 to cells. This is part of why hyperventilating (e.g. before underwater swimming) can cause dizziness.
Common Mistakes
- Saying that hyperventilation increases oxygen supply because the curve is higher — this confuses saturation with delivery.
- Stating only the direction of the shift ("the curve moves left") without explaining its consequence at the tissues.
- Failing to mention that less oxygen dissociates at the tissues.
- Misidentifying the Bohr shift as a rightward shift — the shift caused by high pH is leftward.
Things to Be Careful About
The mark scheme explicitly requires the explanation to be in the context of the tissues (not the lungs). Saying "haemoglobin has a higher affinity for oxygen" alone is not enough unless it is tied to reduced release at the respiring cells. A useful data quote (e.g. 72% vs 60% at within 2–6 kPa) earns the alternative second mark.
The rest of this paper
5 more questions- Q2Cell Membranes and Transport · Cell Structure · Immunity12M
- Q3Enzymes8M
- Q4Biological Molecules · Cell Membranes and Transport9M
- Q5Infectious Diseases · Cell Structure9M
- Q6Nucleic Acids and Protein Synthesis · Transport in Plants13M