Biology 9700/13 — May/June 2022
Cambridge AS Level · Multiple Choice (AS Level) · answer key with instant marking and worked solutions
Topics Nucleic Acids and Protein Synthesis · Cell Structure · Biological Molecules · Transport in Mammals · Cell Membranes and Transport · The Mitotic Cell Cycle · +5 more
Tap an option under each question to check it — your score builds as you go.
The diagram shows a section through epithelium found in part of the respiratory system.
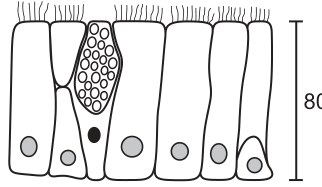
What is the magnification of the diagram?
Options
A
B
C
D
Working
The scale bar in Fig. 1.1 represents an actual length of .
Measuring the scale bar on the diagram gives an image length of approximately .
Convert to the same units:
Apply the magnification formula:
Answer
B
B
Background Concept
Magnification describes how many times larger a drawing (or micrograph) is than the actual specimen. It is calculated as:
Whenever image size and actual size are compared, they MUST be in the same units. Common conversions to remember: and . A printed scale bar (the line drawn next to a figure and labelled with its real length) is the easiest way to work out magnification because the actual size is given to you — you only have to measure the line on the page.
The tissue in the figure is ciliated columnar epithelium of the type lining the trachea and large bronchi. Tall columnar cells bear apical cilia that beat mucus upwards; the flask-shaped cell with vesicles is a goblet cell that secretes mucus. Recognising the tissue is not required to answer this question, but it confirms the cells are real, micrometre-scale objects rather than nanometre-scale.
Understanding the Question
You are given a diagram of ciliated epithelium with a scale bar labelled . The task is to find the magnification of the diagram. There is no other way to obtain a number here — the only actual size stated is the scale bar, so the answer must come from measuring the bar on the page and dividing by .
Approach
- Use a ruler to measure the length of the scale bar in millimetres.
- Convert that measurement into the same units as the scale bar label (micrometres).
- Apply .
- Match the result to the closest option.
Step-by-Step Reasoning
- The scale bar in the printed diagram measures approximately on the page.
- Converting: .
- Substituting into the magnification equation:
- The magnification is , which corresponds to option B.
You can sanity-check this: an epithelial cell is typically about wide, and in the diagram each cell is roughly across. , consistent with the scale-bar calculation.
Key Takeaways
- Magnification is image size divided by actual size; both must be in the same unit.
- A labelled scale bar on a diagram lets you calculate magnification without knowing the object's real size.
- For paper-based measurements, convert mm to µm () before dividing.
Common Mistakes
- Forgetting to convert units. Dividing by directly gives — a tempting trap that points to option A (). Always convert first.
- Using the wrong end of the scale bar. Some figures have a scale with major divisions; make sure you measure the full length indicated by the label, not just one subdivision.
- Confusing magnification with resolution. Magnification is a ratio (no units); resolution is the smallest distance two points can be distinguished (a real distance, in nm or µm). They are not interchangeable.
Things to Be Careful About
- The scale bar label is (micrometres), NOT or . A nanometre-scale bar would be unrealistic for a light micrograph of whole cells.
- Significant figures: a measurement taken with a millimetre ruler is only reliable to about , so a quoted magnification of is appropriate; do not write or similar over-precise figures.
- Diagrams of light-micrograph tissue typically sit in the – range; is too low (it would not show cell detail) and belongs to electron micrographs, not this kind of line drawing.
The rest of this paper
39 more questions- Q2Cell Structure1M
- Q3Cell Structure1M
- Q4Nucleic Acids and Protein Synthesis1M
- Q5Cell Structure1M
- Q6Cell Structure1M
- Q7Biological Molecules1M
- Q8Biological Molecules1M
- Q9Biological Molecules1M
- Q10Biological Molecules1M
- Q11Biological Molecules1M
- Q12Nucleic Acids and Protein Synthesis · Enzymes1M
- Q13Enzymes1M
- Q14Cell Membranes and Transport1M
- Q15Cell Membranes and Transport1M
- Q16Cell Membranes and Transport1M
- Q17Cell Membranes and Transport1M
- Q18The Mitotic Cell Cycle1M
- Q19The Mitotic Cell Cycle1M
- Q20The Mitotic Cell Cycle1M
- Q21The Mitotic Cell Cycle1M
- Q22Nucleic Acids and Protein Synthesis1M
- Q23Nucleic Acids and Protein Synthesis1M
- Q24Nucleic Acids and Protein Synthesis1M
- Q25Nucleic Acids and Protein Synthesis1M
- Q26Transport in Plants1M
- Q27Transport in Plants1M
- Q28Transport in Plants1M
- Q29Transport in Plants1M
- Q30Transport in Mammals1M
- Q31Transport in Mammals1M
- Q32Transport in Mammals1M
- Q33Transport in Mammals1M
- Q34Transport in Mammals1M
- Q35Gas Exchange1M
- Q36Gas Exchange1M
- Q37Infectious Diseases1M
- Q38Immunity1M
- Q39Immunity1M
- Q40Immunity1M