Biology 9700/36 — October/November 2021
Cambridge AS Level · Advanced Practical Skills · worked solutions for every part, with the mark scheme
Topics Manipulation, Measurement and Observation · Presentation of Data and Observations · Analysis, Conclusions and Evaluation · Use of the Light Microscope
Catalase is an enzyme produced by bacteria. Catalase breaks down hydrogen peroxide to produce oxygen gas, as shown in Fig. 1.1.
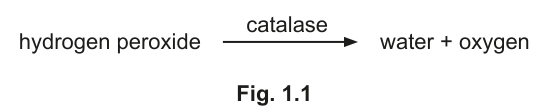
Fig. 1.1
The activity of catalase can be used to determine the level of bacterial contamination in a food sample.
You will investigate catalase activity in two food samples, F1 and F2.
You are provided with the materials shown in Table 1.1.
Table 1.1
| labelled | contents | hazard | volume / |
|---|---|---|---|
| E | 10.0% catalase solution | harmful irritant | 30 |
| F1 | food sample 1 | none | 20 |
| F2 | food sample 2 | none | 20 |
| H | hydrogen peroxide solution | harmful irritant | 50 |
| D | detergent solution | irritant | 20 |
| W | distilled water | none | 200 |
If any solution comes into contact with your skin, wash off immediately under cold water.
It is recommended that you wear suitable eye protection.
You will need to carry out a serial dilution of the 10.0% catalase solution, E, to reduce the concentration of catalase by half between each successive dilution.
You will need to prepare four concentrations of catalase solution in addition to the 10.0% catalase solution, E.
After the serial dilution is completed, you will need to have of each concentration available to use.
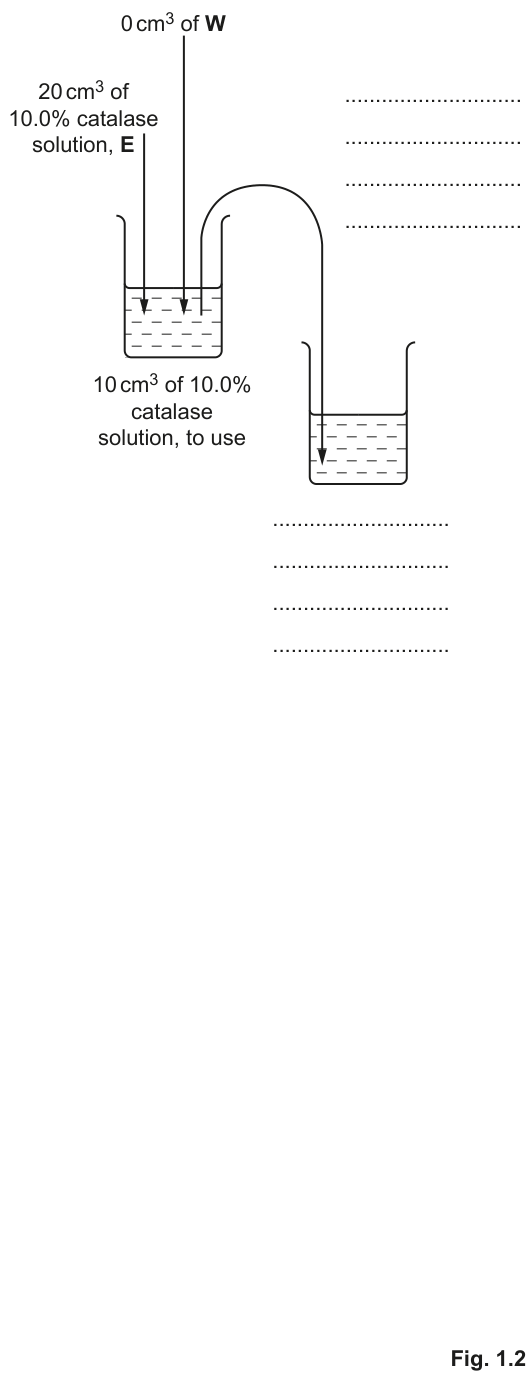
Complete Fig. 1.2 to show how you will prepare your serial dilution.
Fig. 1.2 shows the first two beakers you will use to make your serial dilution. You will need to draw three additional beakers.
For each beaker add labelled arrows to show:
- the volume of catalase solution transferred
- the volume of distilled water, W, added.
Under each beaker, state the concentration of catalase solution.
Answer
Complete Fig. 1.2 by adding three further beakers to the right of the second beaker. For each new beaker, draw:
- a curved arrow labelled " of (previous concentration) catalase solution" showing the volume transferred from the previous beaker
- a downward arrow labelled " of W" showing the volume of distilled water added
State the catalase concentration under each beaker:
- Beaker 1:
- Beaker 2:
- Beaker 3:
- Beaker 4:
- Beaker 5:
See diagram — concentrations 10.0%, 5.0%, 2.5%, 1.25%, 0.625%, each made by transferring 10 cm³ into 10 cm³ of W.
Background Concept
A serial dilution is a stepwise reduction of concentration, normally by a fixed factor (here, half). Each step takes a fixed volume of the previous solution and adds the same volume of diluent (distilled water, W, in this case). When equal volumes are mixed, the original concentration is halved:
Catalase is an enzyme that catalyses the breakdown of hydrogen peroxide into water and oxygen:
The volume of oxygen released per unit time depends on catalase concentration, so a series of known catalase concentrations can be used as a standard (calibration) series against which the catalase content of unknown samples (food samples F1 and F2) can later be estimated.
Understanding the Question
Fig. 1.2 already shows the first beaker (containing of catalase solution E) and an empty second beaker. You must add three more beakers, label the transfer and diluent volumes, and write the concentration of catalase solution below each of the five beakers. The end requirement is available at each of the four new concentrations (plus the original ).
Approach
Work out the dilutions backwards. To have available at each concentration AND left over to seed the next beaker, each beaker must contain total after the dilution. The simplest scheme is therefore:
- start with at the starting concentration
- transfer to the next beaker and add of W → at half the concentration
- repeat until four extra concentrations have been made
The halving sequence from is therefore:
Step-by-Step Reasoning
- Beaker 1 (given): receives of catalase E and of W. Use of catalase; transfer to beaker 2.
- Beaker 2 (partially drawn — complete it): receives of catalase from beaker 1 plus of W → at . Use of catalase; transfer to beaker 3.
- Beaker 3: receives of catalase plus of W → at . Use of catalase; transfer to beaker 4.
- Beaker 4: receives of catalase plus of W → at . Use of catalase; transfer to beaker 5.
- Beaker 5: receives of catalase plus of W → at . Use of catalase.
Each beaker supplies at its labelled concentration, satisfying the brief.
Key Takeaways
- Equal volumes of solution and diluent halve the concentration.
- A halving serial dilution produces a geometric sequence: , , , , .
- Each intermediate beaker must retain enough solution to seed the next beaker.
Common Mistakes
- Using unequal volumes (e.g. + ) — this does not halve the concentration and will be rejected.
- Forgetting to write the concentration under each beaker — the mark scheme explicitly requires this.
- Omitting the water-addition arrow so the diluent volume is unclear.
- Quoting approximate concentrations (e.g. ) instead of the exact .
Things to Be Careful About
- The four new concentrations must be exactly , , and — written with the % symbol.
- Use the same arrow style as the printed first beaker (curved arrow for transfer, straight downward arrow for water) for visual consistency.
- The transfer volume () must equal the diluent volume (); equal volumes are what produce the halving.
Carry out step 1 to step 15.
- Prepare the concentrations of catalase solution, as decided in (a)(i), in the beakers provided.
- Label five of the test-tubes with the concentrations you prepared in step 1.
- Put of each concentration of catalase solution into the appropriately labelled test-tube.
- Label another test-tube 0.0% and put of distilled water, W, into this test-tube.
- Put one drop of detergent solution, D, into each labelled test-tube. Mix gently.
When detergent is used, any oxygen produced by the breakdown of hydrogen peroxide is trapped as foam. The height of the foam can be used as a measure of the volume of oxygen produced.
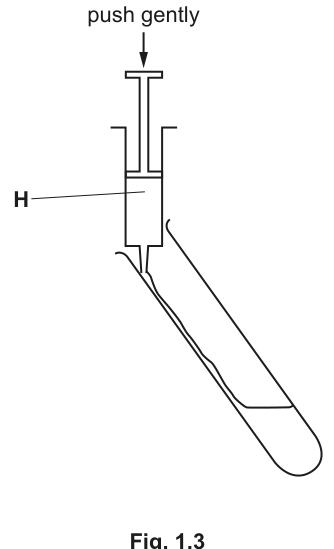
- Put of H into each labelled test-tube. This should be done by touching the nozzle of the syringe against the inside of the test-tube, as shown in Fig. 1.3. Gently push the plunger of the syringe so that H runs down the inside of the test-tube.
- Start timing. When the foam reaches the top of at least one of the test-tubes, stop timing and record this time.
If the foam does not reach the top of any test-tube after 3 minutes, stop timing and record this time as '3 minutes'.
time = ______
- Measure the height of the foam in each test-tube. Record your results in (a)(ii).
Record your results in an appropriate table.
Answer
| Percentage concentration of catalase / % | Height of foam / mm |
|---|---|
| 0.0 | 0 |
| 0.625 | 3 |
| 1.25 | 6 |
| 2.5 | 12 |
| 5.0 | 22 |
| 10.0 | 35 |
Trend: height of foam increases as catalase concentration increases.
Representative table — height of foam (mm) increases from 0 (0.0%) to ~35 (10.0%); record candidate's actual readings.
Background Concept
The activity of an enzyme can be quantified indirectly by measuring the rate at which product is formed. Here, catalase breaks down hydrogen peroxide to release oxygen, and the detergent (D) traps the oxygen as a foam. The height of the foam column is therefore proportional to the volume of oxygen released in the fixed reaction time.
By running the reaction at several known catalase concentrations and recording the foam height, a calibration set is produced. Unknown samples (later, F1 and F2) can be compared against this set.
Understanding the Question
Steps 1–8 describe a procedure in which you prepare the catalase dilutions from part (i), place of each concentration (plus a water control) into labelled test-tubes, add one drop of D to each, then add of hydrogen peroxide H by running it down the inside of a tilted tube (Fig. 1.3 — this gentle mixing prevents loss of the early foam). You time until foam reaches the top of at least one tube (or maximum), then measure the foam height in every tube.
You must record these measurements in an appropriate table.
Approach
The table must:
- carry a clear heading for the independent variable (catalase concentration, with %), since the experimenter chooses this;
- carry a clear heading for the dependent variable (foam height, with mm), since this is what is measured;
- include all concentrations tested, including the control;
- show the expected biological trend (more enzyme → more product → taller foam).
Step-by-Step Reasoning
- The independent variable is the percentage concentration of catalase. A suitable heading is "Percentage concentration of catalase / %" — both a quantity name and a unit.
- The dependent variable is the height of the foam column. A suitable heading is "Height of foam / mm".
- The table needs a row for every concentration: , , , , and — six rows in all.
- The biological expectation is that as concentration rises, more enzyme molecules are available to break down hydrogen peroxide, so more oxygen is released and the foam is taller.
- At there is no catalase, so no foam should appear (control). All other tubes should show increasing foam height up to (although at high concentrations the foam may reach the top of the tube before and the height is "saturated").
The representative table shown above matches these requirements; the candidate's actual values will differ but must follow the same increasing trend (within experimental scatter).
Key Takeaways
- The independent variable's heading needs both a descriptor and a unit.
- The dependent variable's heading needs both a descriptor and a unit.
- Trend: more catalase → more foam (positive correlation).
- Always include the control in the table.
Common Mistakes
- Heading written as "concentration of catalase" with no unit symbol — mark scheme requires "%" / "percentage".
- Heading written as "amount of foam" or "volume of foam" — mark scheme requires "height" and mm.
- Omitting one or more concentrations, especially the control.
- Recording decreasing values or a random scatter instead of the expected rising trend.
Things to Be Careful About
- Use consistent units throughout the dependent-variable column (all mm, or all cm — but if cm, state the unit in the heading).
- Don't write "amount" where "concentration" is meant.
- If foam reached the top of the tube before , still record the height — write the tube length as the height and consider it a saturating value.
- Label a test-tube F1, and label another test-tube F2.
- Put of F1 into the appropriately labelled test-tube.
- Put of F2 into the appropriately labelled test-tube.
- Put one drop of D into each labelled test-tube. Mix gently.
- Put of H into each labelled test-tube as described in step 6.
- Start timing and leave for the time you recorded in step 7.
- After this time (step 14), measure the height of the foam in each test-tube.
Record the height of the foam in each test-tube. Include appropriate units.
F1 ______
F2 ______
Answer
F1 = 14 mm (representative — actual reading depends on candidate's experiment)
F2 = 7 mm (representative — must be lower than F1)
Units must be given (mm or cm).
F1 > F2 with units; representative example: F1 = 14 mm, F2 = 7 mm.
Background Concept
Steps 9–15 ask you to repeat the catalase assay, this time on the two unknown food samples F1 and F2. Each sample is treated exactly like the catalase standards in step 8 — of sample, one drop of D, of H, run down the inside of a tilted tube, then left for the same time recorded in step 7 (so the foam heights are directly comparable with the calibration series).
The more catalase a sample contains, the more hydrogen peroxide it can break down, and the taller the foam column it will produce in the fixed time.
Understanding the Question
You have to record the height of the foam in each tube with an appropriate unit. The two readings — F1 and F2 — will then be compared with the calibration series in (a)(ii) in part (a)(iv) to estimate the catalase concentration in each food sample.
Approach
- Use a ruler held vertically against each tube and read the height of the foam (not the liquid) in mm (or cm).
- State the unit explicitly next to each value.
- Because F1 is the more contaminated of the two food samples in this experiment, its foam should be taller than F2's.
Step-by-Step Reasoning
- Read the foam height in the tube labelled F1 to the nearest mm. (Representative value: .)
- Read the foam height in the tube labelled F2 to the nearest mm. (Representative value: .)
- Write each value next to the correct label, with the unit mm (or cm).
- The mark scheme expects the height for F1 to be higher than for F2 — record what you actually see, but check this trend before moving on, as it is what the examiner is looking for.
Key Takeaways
- Always quote a unit with a measured value.
- Use the same fixed time (recorded in step 7) for F1 and F2 so the readings are comparable with the standards.
Common Mistakes
- Forgetting the unit (just writing "14" with no mm/cm) — mark scheme specifically requires units.
- Recording the height of the liquid rather than the foam.
- Reporting F2 higher than F1 (this would indicate the tube labels were swapped or the wrong sample was used).
Things to Be Careful About
- Use the eyepiece-graticule-style ruler or a mm ruler held against the back of the tube.
- If foam has reached the top of the tube, record the tube length as the height and note that it has saturated.
- The two readings should be comparable — read both tubes in the same orientation.
Use your results from (a)(ii) and (a)(iii) to estimate the concentration of catalase in food samples F1 and F2.
F1 = ______
F2 = ______
Answer
Using the calibration series in (a)(ii):
- F1 ≈ catalase (interpolated from a foam height of )
- F2 ≈ catalase (interpolated from a foam height of )
(Actual values depend on the candidate's own readings.)
F1 ≈ 3.0 %, F2 ≈ 1.5 % (interpolated from candidate's calibration curve; representative values shown).
Background Concept
The calibration series built in (a)(ii) maps each known catalase concentration to a measured foam height. This is a standard curve. Any unknown sample that is run under identical conditions (same volume of sample, same volume of detergent, same volume of hydrogen peroxide, same reaction time) will produce a foam height that corresponds to a point on that curve. Reading the concentration back off the curve is called interpolation.
Understanding the Question
You must use the foam heights measured in (a)(iii) for F1 and F2, together with the calibration series from (a)(ii), to estimate the catalase concentration in each food sample. The estimate is read off the trend line of the standard series.
Approach
- Plot a graph of catalase concentration (x-axis) vs foam height (y-axis) using the standard-series data — or simply read directly from the table.
- Locate the F1 foam height on the y-axis and trace horizontally to the trend line, then vertically down to the x-axis to read the catalase concentration.
- Repeat for F2.
Step-by-Step Reasoning
- From (a)(ii) the standard series gives (e.g.): , , , , , .
- F1 produced a foam height of . Following the calibration, this lies between the and points, closer to — interpolating gives approximately .
- F2 produced a foam height of . This lies between the and points, very close to — interpolating gives approximately .
- Both estimates depend on the candidate's own readings; the important point is that the method (use the calibration series as a reference) is correct.
Key Takeaways
- A calibration series converts an indirect measurement (foam height) into a direct measurement (concentration).
- Interpolation between two known points is valid when the trend is smooth and approximately linear over the interval.
- The estimates carry the same uncertainty as the underlying calibration readings.
Common Mistakes
- Guessing concentrations that are not on the calibration series (e.g. "" when no standard gives that height) — the mark scheme rejects wild estimates.
- Confusing the x- and y-axes (reading foam height as concentration).
- Reporting F1's concentration as lower than F2's, which contradicts the foam-height data.
Things to Be Careful About
- Use the same units and same time interval as the calibration series; otherwise the comparison is invalid.
- If foam reached the top of the tube, the height is saturated — only a minimum concentration can be stated (e.g. ">").
A source of error in this investigation is the difficulty of measuring the height of the foam.
Suggest an improvement to the procedure to provide a more accurate measurement of the volume of oxygen produced.
Answer
Use a gas syringe (or a water-displacement apparatus with an inverted measuring cylinder / burette) connected to the test-tube to measure the volume of oxygen gas produced directly, instead of measuring foam height.
Measure the volume of oxygen using a gas syringe / water-displacement apparatus.
Background Concept
Foam height is a proxy for the volume of oxygen released. It works because detergent traps the gas as bubbles, but the bubbles are of variable size, the foam is uneven, the column can be hard to read against a ruler, and small volumes are easy to misjudge by eye. A more direct, quantitative measure is the actual volume of gas evolved.
Understanding the Question
The question highlights a specific source of error — "the difficulty of measuring the height of the foam" — and asks for one improvement that gives a more accurate measurement of the volume of oxygen produced.
Approach
The improvement must:
- address the named limitation (measuring foam height is awkward and imprecise);
- give a more accurate measurement of the volume of oxygen (not just a more accurate foam height);
- be practical in a school/college lab.
Step-by-Step Reasoning
- Foam height is hard to read because bubbles vary in size and the top of the foam is irregular.
- A gas syringe collects the oxygen directly and the plunger is read against a graduated scale — much more accurate.
- Alternatively, the oxygen can be led through a tube into an inverted measuring cylinder / burette over water and the displaced water measured (water displacement).
- Either method returns a value in (or mL), with proper units and significant figures.
Key Takeaways
- When the proxy measurement is unreliable, change the measurement technique rather than refining the proxy.
- "Gas syringe" or "water displacement" are the standard CIE-accepted improvements.
Common Mistakes
- Suggesting "measure more carefully" or "use a finer ruler" — these do not address the fundamental problem of foam height being a poor proxy for gas volume.
- Suggesting "use a colorimeter" — irrelevant to gas evolution.
- Describing an improvement without linking it to the volume of oxygen.
Things to Be Careful About
- The improvement must be specific — name the apparatus (gas syringe / inverted measuring cylinder / burette).
- The improvement must target the volume of oxygen, not the height of the foam.
Suggest one reason for using a 0.0% concentration in this investigation.
Answer
The tube acts as a control, showing that hydrogen peroxide does not break down on its own (without catalase) — any foam in the other tubes must therefore be due to catalase activity.
Control — to show that hydrogen peroxide does not break down spontaneously without catalase.
Background Concept
A control is a tube or sample that lacks the variable being tested, while every other condition is held constant. It establishes the baseline — what happens in the absence of the supposed cause. Without it, you cannot tell whether an observed effect (foam) is due to your independent variable (catalase) or to something else (e.g. spontaneous decomposition of hydrogen peroxide, or a reaction with the detergent).
Understanding the Question
Step 4 instructs you to label one tube 0.0% and put of distilled water into it instead of catalase solution. Every other reagent (one drop of D, of H) is added exactly as for the catalase tubes. The question asks for one reason for including this tube.
Approach
A 0.0% tube has two legitimate purposes, both accepted by the mark scheme:
- It acts as a control against which the catalase tubes can be compared.
- It demonstrates that hydrogen peroxide does not break down on its own — confirming that any foam in the other tubes is due to the catalase, not to some other factor.
Step-by-Step Reasoning
- If the 0.0% tube produces no foam, then any foam in the catalase tubes is unequivocally due to catalase activity.
- If the 0.0% tube does produce some foam (because hydrogen peroxide can slowly decompose spontaneously), then that baseline foam height must be subtracted from all the other tubes' readings.
- Either way, the 0.0% tube provides a reference point for the calibration series.
Key Takeaways
- A control isolates the effect of the independent variable.
- The 0% control is essential whenever you need to confirm that the reaction is enzyme-dependent.
Common Mistakes
- Saying the control "checks the detergent" or "checks the hydrogen peroxide" — vague; the mark scheme requires linking the control to the role of the enzyme (or as a general control).
- Saying the control "makes the experiment more accurate" without explaining how.
Things to Be Careful About
- Either of the two reasons (control / shows enzyme breaks down H₂O₂) earns the mark — give the one you can express most clearly.
- Do not credit reasons that apply to any control in any experiment (e.g. "for comparison") — the reason must be specific to this reaction.
Describe how you could modify this procedure to obtain more accurate estimates of the concentrations of F1 and F2 in (a)(iv).
Answer
Use more intermediate concentrations of catalase solution between the existing ones (e.g. , as well) so the calibration curve has more data points — then plot a graph of catalase concentration vs foam height and read the F1 and F2 concentrations off the graph.
(Either of these earns the mark; the mark scheme accepts both.)
Use more intermediate concentrations and/or plot a calibration graph to read off the F1 and F2 values.
Background Concept
A halving serial dilution gives only five widely spaced concentrations: , , , , . When the foam heights for F1 and F2 fall between two of these standards, the catalase concentration can only be estimated roughly. The accuracy of the estimate is limited by the gap between successive standards.
Understanding the Question
Part (a)(iv) asks you to estimate the catalase concentrations in F1 and F2 from the calibration series. The question in (a)(vii) asks how to modify the procedure to obtain more accurate estimates.
Approach
Two improvements are accepted by the mark scheme:
- Increase the number of standard concentrations in the calibration series, particularly between the existing points (more intermediates → smaller gaps → better resolution).
- Plot a calibration graph of catalase concentration against foam height and read the F1 and F2 values off the fitted line, rather than estimating by eye from a sparse table.
Step-by-Step Reasoning
- With only five standards, a foam height that falls between, say, the and points can only be estimated as somewhere in that range.
- Adding intermediate concentrations (e.g. , etc.) reduces the gap and therefore the uncertainty in the interpolated value.
- Alternatively, treating the calibration as a continuous curve (a graph) and reading off F1 and F2 gives a smoother estimate than picking the "nearest" standard.
- Either approach reduces the error in the final concentration estimate.
Key Takeaways
- The resolution of an indirect estimate is set by the density of the calibration standards.
- Graphical interpolation is generally more accurate than "nearest-neighbour" tabulation.
Common Mistakes
- Suggesting "repeat the experiment" — repetition reduces random error but does not improve the resolution of the calibration curve.
- Suggesting "use more accurate measuring equipment" — irrelevant; the limiting factor is the gap between standards, not the ruler.
- Suggesting "use a longer time" or "higher temperature" — these would change the calibration, not improve its resolution.
Things to Be Careful About
- The mark scheme accepts either modification; you need only one clear suggestion.
- The suggestion must be specific to improving the estimate in (a)(iv), not to improving the experiment as a whole.
A culture of Escherichia coli bacteria was grown for 10 days and then placed in solutions of different glucose concentration. The rate of glucose uptake into the bacterial cells was calculated.
The results for E. coli are shown in Table 1.2.
Table 1.2
| glucose concentration / | glucose uptake rate / |
|---|---|
| 0 | 0.0 |
| 25 | 1.0 |
| 40 | 2.5 |
| 60 | 4.8 |
| 75 | 5.1 |
| 100 | 5.1 |
Plot a graph of the data shown in Table 1.2 on the grid in Fig. 1.4.
Use a sharp pencil.

Answer
Axes (with units):
- -axis: glucose concentration /
- -axis: glucose uptake rate /
Scales:
- -axis: (i.e. per cm), labelled at least every
- -axis: , labelled at least every
Points (plotted as small crosses):
| Glucose concentration / | Glucose uptake rate / |
|---|---|
| 0 | 0.0 |
| 25 | 1.0 |
| 40 | 2.5 |
| 60 | 4.8 |
| 75 | 5.1 |
| 100 | 5.1 |
Line: thin, smooth curve drawn through all six points — rising steeply at first and plateauing at .
Line graph with x-axis 'glucose concentration / mg dm⁻³' (20 mg = 2 cm) and y-axis 'glucose uptake rate / mg min⁻¹' (1 mg min⁻¹ = 2 cm); six points plotted; thin smooth curve through all points.
Background Concept
When one variable is deliberately changed (here, the glucose concentration in the surrounding solution) and the resulting change in another variable is measured (the rate at which the bacterial cells take up glucose), the relationship between them is best displayed as a line graph. The independent variable goes on the -axis and the dependent variable on the -axis. Conventions — labelled axes with units, sensible scales, accurate plotting, a smooth line — make the graph interpretable by anyone.
Understanding the Question
Table 1.2 gives six paired values for glucose concentration and glucose uptake rate in Escherichia coli. You must plot these on the grid provided (Fig. 1.4), using a sharp pencil, following the CIE conventions for axes, scales, plotting and the line.
Approach
- Decide which variable is independent (chosen by the experimenter → glucose concentration → -axis) and which is dependent (measured → uptake rate → -axis).
- Choose scales that use at least half the grid in both directions and are not awkward (i.e. each major gridline represents , or units — not or ).
- Label every along each axis with the value.
- Plot each of the six points as a small, sharp cross.
- Join the points with a thin, smooth line — either point-to-point or a smooth curve.
Step-by-Step Reasoning
- Axes — mark scheme requires the unit symbols (, ) on the axis labels.
- -axis scale — occupies , so occupies . The data span to , so the axis uses of the grid (leaving the rest blank). Labels at every : , , , , , .
- -axis scale — occupies . The data span to about , so the axis can comfortably use to , taking . Labels at every : , , , , , , .
- Plotting — locate each pair carefully: , , , , , . Mark each with a small ×.
- Line — because the relationship is non-linear (it plateaus), a smooth curve through the points is more appropriate than a series of straight segments. The curve rises steeply from the origin and levels off at about once the carriers are saturated.
Key Takeaways
- Independent variable → -axis; dependent variable → -axis.
- Axis labels must include both the quantity and the unit.
- Scales should be linear, easy to read and use at least half the grid.
- When data do not lie on a straight line, draw a smooth curve, not zig-zag segments.
Common Mistakes
- Plotting concentration on the -axis and rate on the -axis (the most common error).
- Forgetting the unit on the axis label (e.g. "glucose concentration" with no ).
- Choosing an awkward scale such as , which makes points hard to read.
- Joining the points with straight, zig-zag segments instead of a smooth curve.
- Drawing the line as a thick, felt-tip line — mark scheme requires a thin line, drawn with a sharp pencil.
Things to Be Careful About
- The mark scheme requires the scale unit () to be labelled every along each axis — do not skip labels.
- The points at and lie on a horizontal section of the curve — do not slope the line down between them.
Use your graph in Fig. 1.4 to suggest how glucose is transported into bacterial cells.
Suggest an explanation for your answer.
Answer
Mechanism: facilitated diffusion (or active transport).
Explanation: the rate of glucose uptake is (initially) in direct proportion to the glucose concentration, but then plateaus at high concentrations. This is characteristic of transport by carrier proteins in the membrane, which become saturated when all binding sites are occupied — behaviour not seen in simple diffusion.
Facilitated diffusion (or active transport); uptake is in direct proportion to concentration and plateaus due to saturation of carrier proteins.
Background Concept
Small molecules cross plasma membranes by three main routes:
- Simple diffusion — directly through the phospholipid bilayer; rate rises linearly with the concentration gradient (Fick's law) and does not saturate.
- Facilitated diffusion — through carrier proteins or channel proteins; rate rises with concentration but saturates when all the carriers are occupied.
- Active transport — also via carrier proteins, but against the concentration gradient using ATP; shows the same saturation behaviour because the carrier is the limiting factor.
A graph of uptake rate vs external concentration therefore distinguishes simple diffusion (no plateau) from facilitated diffusion or active transport (clear plateau).
Understanding the Question
You must look at the curve you have just plotted in (b)(i) and decide how glucose enters the bacterial cell. The mark scheme accepts either facilitated diffusion or active transport as the answer, provided the explanation accounts for the shape of the curve.
Approach
- Note the shape of the curve: it rises from the origin and then levels off at about for concentrations .
- A plateau in uptake rate at high concentrations is the signature of a carrier-mediated process with a limited number of carrier proteins.
- Simple diffusion cannot produce a plateau — its rate would keep increasing linearly with the gradient.
- Therefore the transport must be facilitated diffusion (down the concentration gradient, via carriers) or active transport (against the gradient, via carriers, using ATP). Both fit the data.
Step-by-Step Reasoning
- At low glucose concentrations, only some carrier proteins are occupied; the uptake rate is limited by the availability of substrate, so it is (approximately) proportional to the external glucose concentration.
- As concentration rises, more carriers are occupied; the rate of increase slows.
- Beyond about , virtually all carrier proteins are occupied at any instant; the rate is limited by the number of carriers and cannot rise further — the curve plateaus.
- This saturation behaviour rules out simple diffusion and identifies the mechanism as facilitated diffusion or active transport.
Key Takeaways
- A plateau in a rate-vs-concentration curve = carrier-mediated transport.
- Facilitated diffusion and active transport both show saturation; they differ in direction relative to the gradient and in energy requirement, which the data here cannot distinguish.
Common Mistakes
- Answering "diffusion" (or "simple diffusion") — the plateau rules this out.
- Answering "osmosis" — osmosis is the diffusion of water, not glucose.
- Naming the mechanism but not giving the saturation/plateau explanation.
- Giving the explanation without naming the mechanism.
Things to Be Careful About
- Either mechanism is acceptable — do not lose a mark for choosing one and not the other.
- The explanation must explicitly mention proportionality (or "in direct proportion") AND saturation/plateau to earn both marks.
The rate of glucose uptake in another culture of bacteria, Chelatobacter heintzii, was also calculated.
The results for C. heintzii are shown in Table 1.3.
Table 1.3
| glucose concentration / | glucose uptake rate / |
|---|---|
| 0 | 0 |
| 25 | 4.6 |
| 40 | 6.2 |
| 60 | 7.0 |
| 75 | 7.0 |
| 100 | 7.0 |
Cultures of E. coli and C. heintzii bacteria were placed in the same container with glucose.
Use the data in Table 1.3 and your graph in (b)(i) to suggest which population of bacteria would grow the fastest.
Suggest an explanation for your answer.
Answer
Chelatobacter heintzii would grow fastest.
At glucose (from Table 1.3 and the graph in (b)(i)), the uptake rate for C. heintzii is , whereas for E. coli it is only . More glucose is taken up per minute, providing more substrate for respiration and cell division.
C. heintzii — higher glucose uptake at 40 mg dm⁻³ gives more glucose for division.
Background Concept
Bacterial cells need a source of carbon and energy to grow and divide. Glucose is a very common carbon source; it is taken up from the surrounding medium, broken down by respiration (or fermentation) to release ATP, and its carbon atoms are built into new cellular components during cell division. Faster glucose uptake → faster generation of ATP and new biomass → faster cell division → faster population growth.
Understanding the Question
Both species are placed in a shared container with glucose. You must decide which species would grow faster and justify the decision using:
- the graph you drew in (b)(i) for E. coli (Table 1.2 data);
- Table 1.3 for C. heintzii.
Approach
- Read the E. coli uptake rate at off your graph → it is the third plotted point, .
- Read the C. heintzii uptake rate at from Table 1.3 → it is the third row, .
- Compare: C. heintzii > E. coli at this concentration.
- Link the higher uptake rate to faster growth (more glucose for division).
Step-by-Step Reasoning
- At , C. heintzii takes up — about the rate of E. coli ().
- More glucose per minute → more substrate for respiration (more ATP) and more carbon for the synthesis of new cellular materials (proteins, nucleic acids, cell-wall components) required when a cell divides.
- Therefore C. heintzii cells can complete division cycles faster, and the population grows faster than that of E. coli in the same container.
Key Takeaways
- Uptake rate at a common external concentration is a valid comparison of "how fast" two species feed.
- Faster feeding → faster growth, provided other resources (e.g. other nutrients, space) are not limiting.
Common Mistakes
- Naming the wrong species (e.g. E. coli) — this is the species with the lower uptake rate at .
- Naming the correct species but giving no comparison of uptake rates.
- Naming the correct species and giving the comparison but not linking uptake to cell division.
- Saying C. heintzii grows faster "because it has more glucose" — the glucose concentration is the same in both species' environment; the difference is the rate at which they take it up.
Things to Be Careful About
- Both the comparison of rates at AND the link to cell division are required for full marks.
- Read the value from your graph (or Table 1.2) — do not invent a number.
- Make sure the units are quoted correctly: (rate), not (concentration).
The rest of this paper
1 more questions- Q2Use of the Light Microscope · Manipulation, Measurement and Observation · Presentation of Data and Observations · Analysis, Conclusions and Evaluation18M