Biology 9700/35 — October/November 2021
Cambridge AS Level · Advanced Practical Skills · worked solutions for every part, with the mark scheme
Topics Manipulation, Measurement and Observation · Presentation of Data and Observations · Analysis, Conclusions and Evaluation
Plant cells contain the enzyme catalase which catalyses the breakdown of hydrogen peroxide, releasing oxygen.
When a mixture of hydrogen peroxide and plant extract is put into a syringe, bubbles of oxygen are released.
You are going to investigate the effect of substrate concentration on the activity of catalase.
You are provided with the materials shown in Table 1.1.
Table 1.1
| labelled | contents | hazard | volume / |
|---|---|---|---|
| H | 3.0% hydrogen peroxide solution | irritant | 30 |
| P | plant extract solution | none | 40 |
| U | unknown concentration of hydrogen peroxide solution | irritant | 10 |
| W | distilled water | none | 100 |
If any of the solutions come into contact with your skin, wash off immediately with cold water.
It is recommended that you wear suitable eye protection and wear gloves to protect your hands when using hydrogen peroxide, H and U.
You will need to carry out a serial dilution of the 3.0% hydrogen peroxide solution, H, to reduce the concentration by half between each successive dilution.
You will need to prepare four concentrations of hydrogen peroxide solution in addition to the 3.0% hydrogen peroxide solution, H.
After the serial dilution is completed, you will need to have of each concentration available to use.
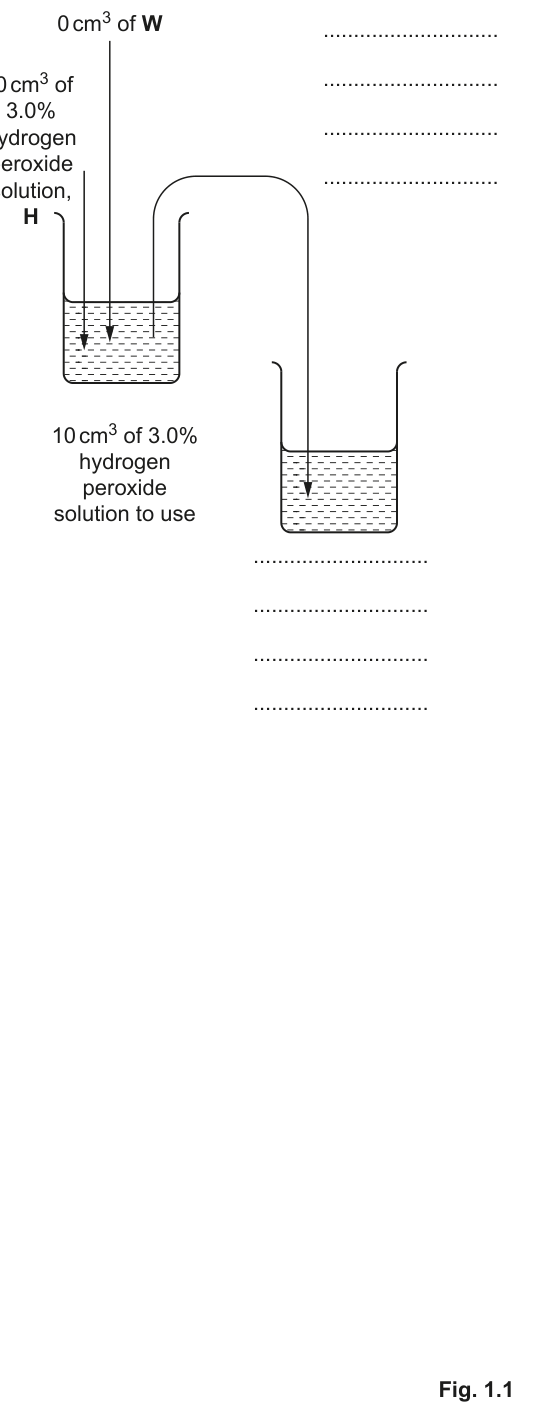
Complete Fig. 1.1 to show how you will prepare your serial dilution.
Fig. 1.1 shows the first two beakers you will use to make your serial dilution. You will need to draw three additional beakers.
For each beaker add labelled arrows to show:
- the volume of hydrogen peroxide solution transferred
- the volume of distilled water, W, added.
Under each beaker, state the concentration of hydrogen peroxide solution.
Answer
Add to Fig. 1.1 so that the full serial dilution shows five beakers in a row. For each of beakers 2–5 add a curved transfer arrow from the previous beaker and a straight downward arrow into the beaker.
Volumes to be labelled on each beaker:
- Beaker 1 (given): no transfer in, 0 cm³ of W added, 10 cm³ of 3.0% to use
- Beaker 2: 10 cm³ of 3.0% H transferred from beaker 1, 10 cm³ of W added, 10 cm³ of 1.5% to use
- Beaker 3: 10 cm³ of 1.5% H transferred from beaker 2, 10 cm³ of W added, 10 cm³ of 0.75% to use
- Beaker 4: 10 cm³ of 0.75% H transferred from beaker 3, 10 cm³ of W added, 10 cm³ of 0.375% to use
- Beaker 5: 10 cm³ of 0.375% H transferred from beaker 4, 10 cm³ of W added, 10 cm³ of 0.1875% to use
See diagram — five beakers with 10 cm³ transferred and 10 cm³ of W added at each step, giving 1.5%, 0.75%, 0.375% and 0.1875%.
Background Concept
A serial dilution is a stepwise dilution in which the same dilution factor is applied at each step. For a 1:1 (halving) dilution, equal volumes of solution and diluent (water) are mixed. The new concentration is half of the previous one. Repeating the process gives a geometric series of concentrations, which is much more efficient than preparing each concentration independently from a stock solution.
The concentration in each beaker follows:
where is the starting concentration and is the number of dilution steps. Starting from 3.0%:
- Step 1:
- Step 2:
- Step 3:
- Step 4:
Understanding the Question
Part (a)(i) gives you the first beaker of a serial dilution (containing 20 cm³ of 3.0% hydrogen peroxide) and a second partially drawn beaker. You must complete Fig. 1.1 by:
- Drawing three more beakers so the series has five beakers in total (3.0% plus four dilutions).
- Labelling each beaker with the volume of hydrogen peroxide transferred from the previous beaker (a curved transfer arrow).
- Labelling each beaker with the volume of distilled water, W, added (a downward arrow).
- Stating the concentration of the solution available for use, below each beaker.
The dilution is 1:1 (10 cm³ of peroxide + 10 cm³ of W = 20 cm³), and exactly 10 cm³ must be left in each beaker for use in step 1 of the procedure.
Approach
In a halving serial dilution, the volume transferred at each step equals the volume of diluent added. The total in each beaker is therefore constant (20 cm³), and 10 cm³ is taken to the next beaker while 10 cm³ is kept for the experiment. Halve the concentration at every step and write the four new concentrations under the new beakers.
Step-by-Step Reasoning
Beaker 1 (already drawn in Fig. 1.1):
- Contents: 20 cm³ of 3.0% hydrogen peroxide solution, H
- 0 cm³ of W added (it is the stock)
- 10 cm³ of 3.0% hydrogen peroxide solution to use
Beaker 2 (partially drawn — to be completed):
- Curved transfer arrow: 10 cm³ of 3.0% H from beaker 1
- Downward arrow: 10 cm³ of W added
- New concentration:
- 10 cm³ of 1.5% hydrogen peroxide solution to use
Beaker 3 (to be drawn):
- Curved transfer arrow: 10 cm³ of 1.5% H from beaker 2
- Downward arrow: 10 cm³ of W added
- New concentration:
- 10 cm³ of 0.75% hydrogen peroxide solution to use
Beaker 4 (to be drawn):
- Curved transfer arrow: 10 cm³ of 0.75% H from beaker 3
- Downward arrow: 10 cm³ of W added
- New concentration:
- 10 cm³ of 0.375% hydrogen peroxide solution to use
Beaker 5 (to be drawn):
- Curved transfer arrow: 10 cm³ of 0.375% H from beaker 4
- Downward arrow: 10 cm³ of W added
- New concentration:
- 10 cm³ of 0.1875% hydrogen peroxide solution to use
Key Takeaways
- Serial dilutions produce a geometric concentration series (each step is a constant fraction of the previous one).
- The dilution factor at each step equals (volume transferred) / (total volume in beaker).
- Always state the concentration with the % sign under each beaker, and ensure exactly 10 cm³ is available for use in each.
Common Mistakes
- Forgetting to add 10 cm³ of W to a beaker (the dilution is not actually 1:1 without it).
- Halving only once and repeating the same concentration.
- Forgetting the % sign on the concentration statements.
- Drawing a transfer arrow from beaker 1 directly to all later beakers — each transfer must be from the immediately previous beaker.
Things to Be Careful About
- The mark scheme requires BOTH the volume transferred AND the volume of W added to be shown.
- Concentrations must be given to a sensible number of significant figures (1.5, 0.75, 0.375, 0.1875 — do not round 0.375 to 0.38 or 0.1875 to 0.2).
- The wording under each beaker should be consistent with the stem: '___ cm³ of ___% hydrogen peroxide solution to use'.
Carry out step 1 to step 24.
- Prepare the concentrations of hydrogen peroxide solution, as decided in (a)(i), in the beakers provided.
- Put W into the test-tube so that it is approximately half-full.
- Use the glass rod to stir the plant extract solution, P.
- Put the nozzle of a clean syringe into the beaker containing P.
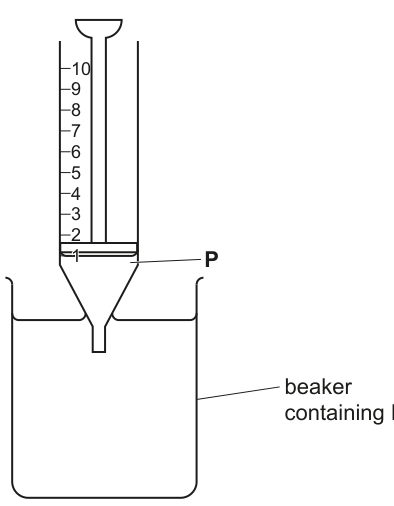
- Pull the plunger out to the mark so that P enters the syringe, as shown in Fig. 1.2.
- Remove the syringe from the beaker containing P and wipe the nozzle with a paper towel.
- Put the nozzle of the same syringe into the beaker containing 3.0% hydrogen peroxide solution, H.
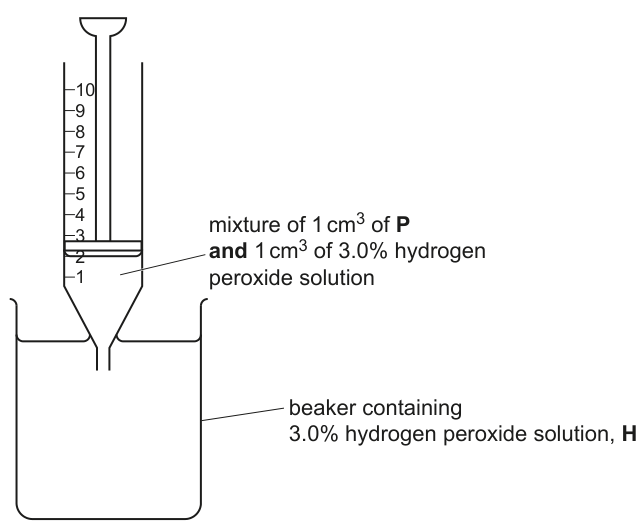
- Pull the plunger out to the mark so that of the 3.0% hydrogen peroxide solution enters the syringe, as shown in Fig. 1.3.
- Carefully wipe the nozzle with a paper towel to remove excess hydrogen peroxide solution.
- Put the tubing onto the syringe nozzle.
- Put the syringe into a beaker as shown in Fig. 1.4.
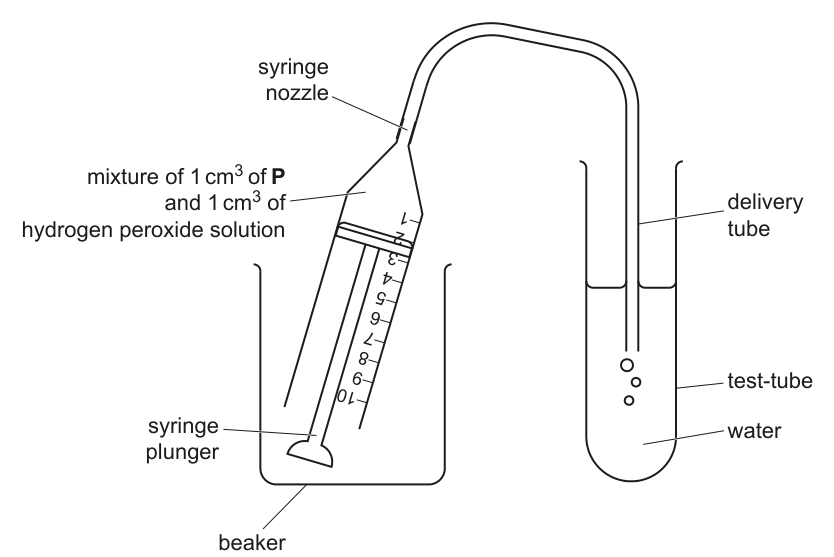
- Put the end of the delivery tube into the test-tube as shown in Fig. 1.4.
- Start timing when the first bubble is observed in the water in the test-tube.
- Count the number of bubbles produced in 120 seconds. Record the results in (a)(ii).
- Hold the syringe with the nozzle up and remove the tubing from the syringe. Put the tubing onto a paper towel.
- Hold the syringe with the nozzle pointing downwards over the container labelled ‘For waste’ and empty the syringe.
- Fill the syringe with water from the container labelled ‘For washing’.
- Put the tubing back onto the syringe nozzle.
- Empty the syringe through the tubing into the container labelled ‘For waste’.
- Repeat step 15 to step 19 twice more to wash the syringe and the tubing.
- Remove the tubing from the syringe. Put the tubing onto a paper towel.
- Repeat step 3 to step 21 with each of the other concentrations of hydrogen peroxide solution prepared in step 1.
Record your results in an appropriate table.
Answer
Record the results in the following table format (values shown are representative — the candidate's own counts will differ, but the trend must be the same: more bubbles for higher concentration).
| percentage concentration of hydrogen peroxide / % | number of bubbles |
|---|---|
| 3.0 | 60 |
| 1.5 | 42 |
| 0.75 | 28 |
| 0.375 | 16 |
| 0.1875 | 8 |
Mark-scheme requirements all satisfied:
- Heading for the independent variable (percentage concentration of hydrogen peroxide / %) comes BEFORE the heading for the dependent variable (number of bubbles)
- % is in the heading only; no units in the body of the table
- Results recorded for all five samples
- Number of bubbles at 3.0% (60) is more than at 0.1875% (8)
- All values recorded as whole numbers
Table of bubble counts for the five concentrations, highest count at 3.0% and lowest at 0.1875%.
Background Concept
In a practical investigation the candidate records their OWN observations in a results table. The table must follow specific conventions: each column has a heading that states the quantity being measured and its unit; the independent variable is listed first and the dependent variable second; units appear in the heading (not in the body of the table); and all values are recorded to a consistent number of significant figures. For an experiment where bubbles are counted, only whole numbers are meaningful.
Understanding the Question
Step 1 to step 14 of the procedure are carried out for each of the five concentrations prepared in (a)(i). The candidate counts the number of bubbles emerging from the delivery tube in 120 seconds and records these counts. The independent variable is the concentration of hydrogen peroxide; the dependent variable is the number of bubbles produced (a proxy for the volume of oxygen released and therefore the rate of catalase activity).
Approach
Before the experiment, the candidate should have planned the table layout. The independent variable column heading goes first, with / % (or ( % )) to attach the unit. The dependent variable column heading goes second. Bubble counts are integers, so the body of the table contains whole numbers only. As substrate concentration increases, the rate of reaction increases, so the bubble count should also increase.
Step-by-Step Reasoning
The expected pattern is that higher substrate concentrations give more bubbles in 120 s, because catalase has more hydrogen peroxide molecules to act on, so more enzyme–substrate complexes form per unit time and more oxygen is released. The actual numbers are candidate-dependent, but the trend (decreasing bubble count with decreasing concentration) is the marking point.
Representative values consistent with a typical catalase preparation:
- 3.0% → 60 bubbles
- 1.5% → 42 bubbles
- 0.75% → 28 bubbles
- 0.375% → 16 bubbles
- 0.1875% → 8 bubbles
These show the required trend (60 > 8) and are all whole numbers.
Key Takeaways
- Headings must include the quantity and its unit; the unit does not appear in the body.
- The independent variable column must come before the dependent variable column.
- Bubble counts are always whole numbers.
- The expected trend for a catalase rate experiment is that activity increases with substrate concentration up to a saturating concentration.
Common Mistakes
- Putting units (e.g. %) in the body of the table as well as in the heading.
- Recording bubble counts as ranges (e.g. '30–35') or estimates (e.g. 'about 30').
- Reversing the order of the two column headings.
- Omitting the unit on the independent variable heading.
Things to Be Careful About
- The mark scheme requires the heading 'percentage concentration of hydrogen peroxide' to appear BEFORE the heading 'number of bubbles'.
- Units must not appear in the body of the table — only in the heading.
- The highest count must be greater than the lowest count. If the candidate's own results do not show this trend, they have likely made a timing, mixing, or counting error.
- Repeat step 3 to step 13 with the unknown concentration of hydrogen peroxide solution, U.
- Count the number of bubbles produced in 120 seconds. Record the result in (a)(iii).
State the number of bubbles produced in 120 seconds for U.
number of bubbles = ______
Answer
number of bubbles = 45 (representative; any whole number less than the count obtained for 3.0% in (a)(ii) is accepted)
45 (representative; any whole number less than the 3.0% result)
Background Concept
U is a hydrogen peroxide solution of unknown concentration. The candidate carries out steps 3–13 with U and counts the bubbles produced in 120 s. Because U is supplied at 10 cm³ (less than the volumes for the other concentrations) and is tested only once, the reading is a single observation rather than a mean. The mark scheme requires the value to be a whole number and to be less than the count obtained for the 3.0% stock in (a)(ii).
Understanding the Question
Part (a)(iii) asks for a single integer recording the bubble count for U over 120 s. This is the candidate's own observation and the only mark-bearing requirement is that the value be less than the candidate's 3.0% result from (a)(ii) (i.e. the unknown is at a lower concentration than the 3.0% stock).
Approach
After completing the experiment for U, write the bubble count in the space provided. Make sure the value is a whole number. There is no further calculation here.
Step-by-Step Reasoning
Using the representative result from (a)(ii) where 3.0% gave 60 bubbles, a value less than 60 — for example 45 bubbles — is consistent with U being at a lower concentration than 3.0%. The exact value depends on the candidate's own data and on the actual concentration of U prepared for the exam; any whole number less than the 3.0% count is accepted.
Key Takeaways
- Practical readings are recorded as they stand — do not round, average, or estimate.
- Bubble counts are always whole numbers.
- A 'less than' comparison to a known value is a quick way to sanity-check a result.
Common Mistakes
- Recording the count as a decimal or fraction (bubbles cannot be partial).
- Writing a value equal to or greater than the 3.0% result, which is inconsistent with U being less concentrated than the stock.
Things to Be Careful About
- The mark scheme requires the number to be less than the candidate's 3.0% result. There is no specific expected value because the concentration of U is set by the exam centre and varies between sittings.
Using your results from (a)(ii) and (a)(iii) estimate the concentration of U.
concentration of U = ______
Answer
concentration of U = 2.0 % (representative; based on the candidate's own results, interpolated between 1.5% and 3.0%)
A value between 1.5% and 3.0% — closer to one end depending on where the count for U falls — is the expected answer.
2.0% (representative; any value between 1.5% and 3.0% based on the candidate's own results)
Background Concept
A calibration curve (or in this simplified case, the table from (a)(ii)) lets you estimate an unknown by interpolation: find the unknown's reading on the dependent variable, then read off the corresponding independent variable value. Because U gave fewer bubbles than 3.0% but (in this case) more than 1.5%, its concentration must lie between 1.5% and 3.0%.
Understanding the Question
Part (a)(iv) asks the candidate to use their own results to estimate the percentage concentration of U. The mark scheme is explicit that the estimate must be 'based on the candidate's results' — there is no single correct answer because U's true concentration is not disclosed to the candidate.
Approach
Locate the bubble count for U in the table from (a)(ii). The concentration is read from the row whose bubble count is closest to (or between two values for which you interpolate). If the count lies between two rows, interpolate: the closer the count is to the lower of the two, the closer the concentration is to that row's value.
Step-by-Step Reasoning
Using the representative values from (a)(ii) and (a)(iii):
- 3.0% → 60 bubbles
- 1.5% → 42 bubbles
- U → 45 bubbles (representative)
45 is much closer to 42 than to 60, so U is just slightly more concentrated than 1.5%. Linear interpolation between 1.5% (42 bubbles) and 3.0% (60 bubbles):
So a reasonable estimate is around 1.75%–2.0%, depending on the candidate's exact reading for U. The mark scheme accepts any value between 1.5% and 3.0% that is consistent with the candidate's own data.
Key Takeaways
- Estimates from a calibration series are read off (or interpolated from) the candidate's own data — not from a textbook value.
- The closer an unknown's reading is to a known point, the closer its estimated value is to that point's concentration.
- Always quote the estimated concentration with a % sign and to a sensible number of significant figures.
Common Mistakes
- Recalling a fixed value (e.g. '2%') that does not match the candidate's own results — this loses the mark.
- Giving an estimate outside the range covered by the calibration (i.e. below 0.1875% or above 3.0%) — the table does not support it.
Things to Be Careful About
- The mark scheme insists the estimate be based on the candidate's results. The candidate should not state a 'textbook' value.
- If the count for U is exactly the same as one of the knowns, the estimate equals that known concentration.
The volume of oxygen was measured by counting the number of bubbles.
Suggest why this is a source of error.
Answer
The size of the bubbles varies, so each bubble does not represent the same volume of oxygen. The count is therefore not proportional to the true volume of oxygen produced.
Size of bubble varies — each bubble does not represent the same volume of oxygen.
Background Concept
Counting bubbles assumes that one bubble is one unit of gas, but bubbles emerging from a delivery tube are rarely uniform. Small bubbles contain less gas than large ones, and bubbles can sometimes coalesce into larger bubbles or break into smaller ones. The volume of gas represented by each counted 'bubble' is therefore not constant.
Understanding the Question
Part (a)(v) asks the candidate to identify ONE source of error in measuring the volume of oxygen by counting bubbles. The mark scheme gives 'size of bubble varies' as the example. Other acceptable ideas (in the spirit of the mark scheme) include bubbles not being spherical, bubbles sticking to the tube and not being counted, or the candidate miscounting at high rates.
Approach
Think about what the bubble count is meant to represent (volume of oxygen released) and what assumption is being made (each bubble has the same volume). The most direct failure of that assumption is that bubbles have different sizes.
Step-by-Step Reasoning
When oxygen is released quickly (high substrate concentration), it tends to come out in larger bubbles or in rapid bursts that are hard to count. When released slowly (low substrate concentration), it forms small, discrete bubbles. Because bubble volume is not constant, the count is at best a rough proxy for the true gas volume, and a given percentage error in bubble size translates to a comparable error in the calculated rate of reaction.
Key Takeaways
- Bubble counting is a low-precision method of measuring gas volume.
- Variability in bubble size is the most fundamental source of error in this method.
- Any quantitative statement made using bubble counts carries an implicit assumption of uniform bubble size.
Common Mistakes
- Vague answers such as 'human error' or 'not accurate' — the mark scheme requires a specific source of error.
- Confusing a source of error with a limitation or an improvement (these are tested in (a)(vi)).
Things to Be Careful About
- The question asks for a SOURCE of error, not a way to fix it. State the problem, not the solution.
- The most credit-worthy answer specifically mentions the variability in bubble size.
Suggest an improvement to the procedure to provide a more accurate measurement of the volume of oxygen produced.
Answer
Use a gas syringe to collect the oxygen and read the volume directly from the syringe scale (instead of counting bubbles).
[Acceptable alternative: use an up-turned measuring cylinder over water to collect and measure the displaced water.]
Use a gas syringe (or an up-turned measuring cylinder over water) to measure the volume of oxygen directly.
Background Concept
There are two standard ways to measure the volume of a gas released by a reaction in a school or college lab: a gas syringe, or water displacement into an up-turned measuring cylinder. Both give a direct volume reading in cm³ on a calibrated scale, so they are not affected by bubble-size variability or by the human difficulty of counting rapid bubbles.
Understanding the Question
Part (a)(vi) asks the candidate to suggest ONE improvement that gives a more accurate measurement of the volume of oxygen produced. The mark scheme accepts either a gas syringe OR an up-turned measuring cylinder over water. Either is a complete answer on its own.
Approach
The error identified in (a)(v) is variability in bubble size. The improvement should therefore remove the dependence on bubble size, by measuring the gas volume directly rather than inferring it from a count.
Step-by-Step Reasoning
A gas syringe has a plunger that moves back as gas enters. The volume can be read directly from the calibrated barrel (typical resolution 0.5–1 cm³), with no need to count bubbles. An up-turned measuring cylinder filled with water, with the delivery tube leading into its open end, collects the gas at the top and the displaced water level is read on the cylinder scale. Both approaches are CIE-accepted for catalase investigations.
Key Takeaways
- Direct gas-volume measurement (gas syringe or water displacement) is more accurate than bubble counting.
- An improvement must address the specific error identified in the previous part.
- A complete improvement is named in terms of apparatus AND explains briefly why it is better.
Common Mistakes
- Suggesting vague improvements like 'be more careful' or 'use a better timer' — these do not address the bubble-size error.
- Naming an apparatus without saying what it would do (e.g. 'use a gas syringe' on its own is acceptable here, but 'use a different syringe' is not).
- Suggesting to count bubbles more times — the method itself is the problem, not the number of repeats.
Things to Be Careful About
- Either 'gas syringe' or 'up-turned measuring cylinder over water' is sufficient.
- The improvement does not need to be elaborate — one clear suggestion is enough for the single mark.
In the procedure described in step 1 to step 14, the effect of the concentration of hydrogen peroxide on catalase activity was investigated.
Describe how you would modify this procedure to investigate the effect of changing pH on the number of bubbles of oxygen produced.
Answer
To investigate the effect of pH, modify the procedure as follows:
- Use the SAME concentration of hydrogen peroxide (e.g. the 3.0% stock, H) for every test.
- Replace the W (distilled water) with a series of FIVE different pH buffer solutions, and add 1 cm³ of the chosen buffer to the syringe together with the 1 cm³ of P (plant extract) and 1 cm³ of H.
- Carry out the rest of the procedure (steps 4–14) as before and record the number of bubbles produced in 120 s at each pH.
Keep the concentration of hydrogen peroxide the same for every test; use five different pH buffers as the new independent variable.
Background Concept
To investigate the effect of a variable on a reaction, ONLY that variable may change. Everything else — substrate concentration, enzyme concentration, temperature, reaction time, apparatus — must be kept constant (these are 'controlled variables'). The variable that is deliberately changed is the independent variable; the variable that is measured is the dependent variable. For the original procedure, the independent variable was substrate concentration; for the modification, it becomes pH, so substrate concentration must now be standardised.
Understanding the Question
Part (a)(vii) asks the candidate to describe how the procedure could be modified to investigate the effect of pH on catalase activity (measured as number of bubbles). The mark scheme requires two specific points:
- the SAME concentration of hydrogen peroxide must be used (so that pH becomes the only variable)
- FIVE different pH buffers must be used (so that pH is the variable and the effect of a range of pH values can be observed)
Approach
Identify what must stay the same (the substrate concentration) and what must change (the pH). In practice the pH can be set by adding a small volume of a pH buffer solution to the reaction mixture, in place of some or all of the distilled water W that was previously added (in this experiment W is not actually added to the syringe, so the buffer would be added directly to the plant extract, or used to prepare the substrate).
Step-by-Step Reasoning
Original procedure: 1 cm³ of P + 1 cm³ of hydrogen peroxide of varying concentration → counted bubbles in 120 s.
Modified procedure: 1 cm³ of P + 1 cm³ of the SAME concentration of hydrogen peroxide (e.g. 3.0% H) + a small volume of pH buffer, with the buffer being one of FIVE different pH values (typically pH 3, 5, 7, 9 and 11, or any other set of five). Count the bubbles at each pH in the same way and over the same time (120 s).
The only change from the original is the substitution of W (or part of the reaction volume) with a pH buffer, and the use of the same H concentration throughout. Everything else (volumes, temperature, timing, washing) stays the same.
Key Takeaways
- Changing the independent variable means standardising (controlling) everything that is not the independent variable.
- pH is set using a buffer solution, not by adding acid or alkali directly (buffers resist changes in pH and give a known, stable value).
- A range of at least five pH values is needed to see a clear pattern of pH effect (the typical bell-shaped activity curve).
Common Mistakes
- Suggesting that the concentration of hydrogen peroxide should be varied as well as the pH — this confounds the two variables.
- Saying 'use different pH values' without specifying buffers or without saying how many.
- Suggesting the use of universal indicator paper to set the pH, rather than a buffer — the buffer sets a known pH, whereas the indicator only reports it.
Things to Be Careful About
- The mark scheme awards 2 marks: one for the same concentration of hydrogen peroxide, one for five different pH buffers. Both must be stated for full marks.
- A buffer is a solution that maintains a particular pH; the candidate should name 'buffer' rather than 'acid' or 'alkali'.
A student carried out another investigation into the effect of temperature on the activity of catalase. Test-tubes containing plant extract and hydrogen peroxide were placed in thermostatically controlled water-baths at five different temperatures for 120 seconds.
The results are shown in Table 1.2.
The activity of the enzyme is shown in arbitrary units (au).
Table 1.2
| temperature / | activity of enzyme / au |
|---|---|
| 15.5 | 3.4 |
| 26.0 | 6.5 |
| 37.5 | 10.1 |
| 45.5 | 8.2 |
| 55.0 | 1.2 |
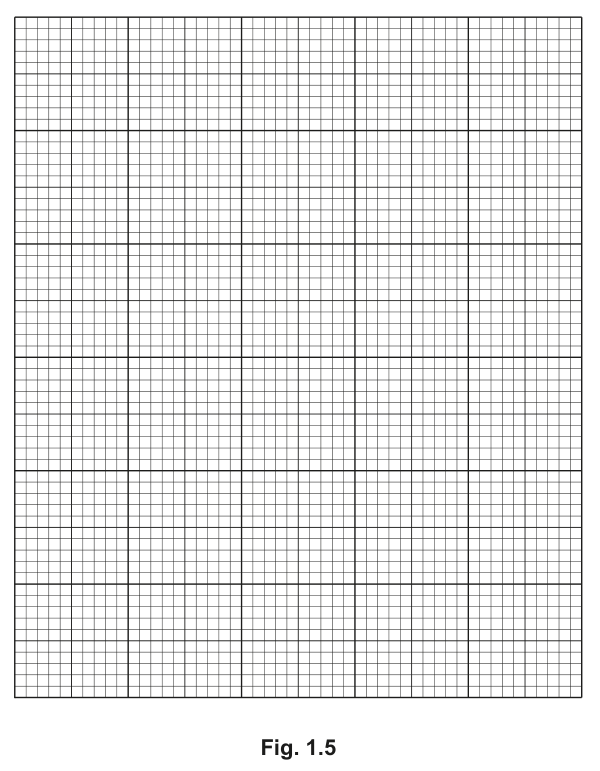
Plot a graph of the data in Table 1.2 on the grid in Fig. 1.5.
Use a sharp pencil for drawing graphs.
Answer
Plot Fig. 1.5 as follows:
- x-axis: temperature / °C, with a scale of 10 °C to 2 cm, labelled at least every 2 cm (e.g. 10, 20, 30, 40, 50, 60).
- y-axis: activity of enzyme / au, with a scale of 2 au to 2 cm, labelled at least every 2 cm (e.g. 0, 2, 4, 6, 8, 10, 12).
- Five data points plotted as small crosses (×) or dots in circles (⊙) at:
(15.5 °C, 3.4 au), (26.0 °C, 6.5 au), (37.5 °C, 10.1 au), (45.5 °C, 8.2 au), (55.0 °C, 1.2 au) - The five points joined with a thin straight line passing through every point.
Line graph with temperature on x-axis and activity on y-axis; five points plotted at the given coordinates and joined with a thin line.
Background Concept
A line graph is used to show how a continuous variable (here, temperature) affects another continuous variable (here, enzyme activity). The independent variable is plotted on the x-axis and the dependent variable on the y-axis. Each axis must have a heading that states the quantity and its unit, and the scale must be linear, easy to read, and use at least half the printed grid. Points are plotted as small, clear crosses (×) or dots inside circles (⊙) and joined with a thin line.
Understanding the Question
The data in Table 1.2 show the activity of catalase (in arbitrary units) at five different temperatures. The candidate must plot these on the blank grid in Fig. 1.5. The mark scheme awards four marks for: (1) correct axis labels with units, (2) appropriate scales, (3) correct plotting of all five points, (4) the points joined with a thin line through all of them.
Approach
Choose scales that are simple (10 or 2 per 2 cm) and that use at least half the grid in both directions. Plot the points carefully using a sharp pencil. Join them with thin straight lines (not a smooth curve of best fit, and not freehand thick lines).
Step-by-Step Reasoning
Axes:
- x-axis: temperature / °C, range 0 to 60 °C. With 10 °C per 2 cm, the major labels are at 10, 20, 30, 40, 50, 60 — every 2 cm is labelled, satisfying the mark scheme.
- y-axis: activity of enzyme / au, range 0 to 12 au. With 2 au per 2 cm, the major labels are at 0, 2, 4, 6, 8, 10, 12 — every 2 cm is labelled.
Both axes use at least half of the printed grid in Fig. 1.5 (which is approximately 20 cm × 30 cm, so a 12 cm × 6 cm plot uses a comfortable portion of the grid).
Plots:
- (15.5, 3.4)
- (26.0, 6.5)
- (37.5, 10.1)
- (45.5, 8.2)
- (55.0, 1.2)
Each is marked with a small × or ⊙, large enough to see but not so large that its position is uncertain.
Line:
- A thin (pencil) line joins the five points in order of increasing temperature. Because the mark scheme requires the line to pass through all points, the line is drawn point-to-point (not a freehand curve of best fit).
Key Takeaways
- Independent variable on x-axis, dependent variable on y-axis; both labelled with quantity and unit.
- A simple scale (1, 2, 5 or 10 per 2 cm) is easiest to read and label.
- The line must pass through every point exactly; if a smooth curve is intended, it should be a curve of best fit and is drawn freehand — but the mark scheme here requires a point-to-point line.
Common Mistakes
- Transposing the axes (temperature on y, activity on x).
- Forgetting the unit (°C, au) in the axis labels.
- Using awkward scales (e.g. 3 or 7 per 2 cm) that make plotting and reading difficult.
- Drawing a thick line, a freehand curve, or omitting the line entirely.
- Using the wrong symbol (large filled-in dots are not as clear as small × or ⊙).
Things to Be Careful About
- The mark scheme is explicit: 'five plots joined with thin line passing through all points'. The line is therefore point-to-point, not a smooth best-fit curve.
- The x-axis must be labelled at least every 2 cm. With 10 °C per 2 cm, every labelled division is 10 °C, satisfying this.
- Each axis label must include the unit, written as / °C or (°C) on the x-axis and / au or (au) on the y-axis.
Use your graph to find the activity of the enzyme when the temperature was .
activity of the enzyme = ______
Answer
activity of the enzyme = 7.8 au (representative; read from the candidate's own graph at 30.1 °C by interpolation between the 26.0 °C and 37.5 °C points)
The exact value depends on how the candidate's line was drawn. A reading anywhere in the range 7.5–8.0 au is consistent with the underlying data and the typical point-to-point line of the mark scheme.
7.8 au (representative; any value in the range 7.5–8.0 au read from the candidate's own graph)
Background Concept
Reading a value from a line graph at an x-coordinate that is not one of the original data points is done by interpolation. The line is followed vertically up from the required x value, and then horizontally across to the y-axis to read off the y value. For a point-to-point line (as required by the mark scheme in (b)(i)), the value at 30.1 °C is found on the straight segment joining the points at 26.0 °C and 37.5 °C.
Understanding the Question
Part (b)(ii) asks the candidate to use the graph drawn in (b)(i) to find the activity of the enzyme at 30.1 °C. 30.1 °C is between the 26.0 °C and 37.5 °C data points, so the answer is read by interpolation. The mark scheme accepts any value consistent with the candidate's own line.
Approach
Mark 30.1 °C on the x-axis, draw a vertical line up to the plotted line, then a horizontal line across to the y-axis, and read the value.
Step-by-Step Reasoning
The straight line segment between (26.0 °C, 6.5 au) and (37.5 °C, 10.1 au) has slope:
At 30.1 °C, which is 4.1 °C above 26.0 °C, the activity is:
The candidate's own reading from their graph should fall close to this (between about 7.5 and 8.0 au), depending on how accurately the line was drawn.
Key Takeaways
- Interpolation is used when the required x value lies between two data points on the line.
- The mark scheme accepts any reading consistent with the candidate's own line — there is no single 'correct' value.
- A reading should always be quoted to a sensible number of significant figures (here, one decimal place matches the original data).
Common Mistakes
- Reading off the y-axis at the wrong x-coordinate.
- Extrapolating beyond the plotted line (e.g. reading at 30.1 °C using the segment to the right of 37.5 °C).
- Quoting the value with too many significant figures (e.g. 7.7826 au) — the precision of the original data does not support this.
Things to Be Careful About
- Use a sharp pencil to draw the construction lines (vertical from 30.1 °C, then horizontal to the y-axis) so they are easy to see and erase if needed.
- Read the y-axis at the point where the horizontal line crosses it, taking care to read to the nearest minor gridline (here, 0.1 au if the minor gridlines are at 0.2 au per 1 mm, or 0.2 au per 2 mm).
Suggest an explanation for the difference in activity of the enzyme between and .
Answer
Any three of the following:
- At 37.5 °C, more enzyme–substrate complexes are formed per unit time than at 55.0 °C (because at 55.0 °C many active sites have been lost).
- Above 37.5 °C, the enzyme catalase is denatured (its tertiary structure is disrupted by the high temperature).
- The shape of the active site changes (it is no longer complementary to hydrogen peroxide).
- As a result, substrate molecules can no longer bind to the active site, so the rate of reaction falls sharply.
At 55.0 °C the enzyme is denatured; the active site changes shape and is no longer complementary to the substrate, so fewer enzyme–substrate complexes form and the activity is much lower than at 37.5 °C.
Background Concept
Enzymes are proteins. Their three-dimensional shape is held by relatively weak interactions (hydrogen bonds, ionic interactions, hydrophobic interactions). Above a certain temperature, the kinetic energy of the molecules is enough to disrupt these interactions, the tertiary structure is lost, and the active site loses its specific shape. This is called denaturation. Once denatured, the enzyme does not recover its activity on cooling (it is a permanent change). The optimum temperature for catalase is around 37 °C, which is why activity peaks at 37.5 °C in Table 1.2 and then falls steeply as the temperature rises above this.
Understanding the Question
Part (b)(iii) asks the candidate to suggest an explanation for the difference in activity between 37.5 °C (10.1 au) and 55.0 °C (1.2 au). The mark scheme awards up to 3 marks for any three of the following four points.
Approach
Recall the induced-fit model of enzyme action: substrate binds to a specifically shaped active site to form an enzyme–substrate complex. Anything that alters the shape of the active site reduces the rate of complex formation. Above the optimum temperature, heat denatures the enzyme, so the active site is no longer complementary to the substrate.
Step-by-Step Reasoning
- 37.5 °C is close to the optimum temperature for catalase, so the active site is correctly shaped and many enzyme–substrate complexes form per second, giving the highest activity (10.1 au).
- At 55.0 °C the kinetic energy is high enough to break the weak bonds that maintain the tertiary structure of catalase, so the enzyme is denatured.
- Once denatured, the active site is no longer the correct shape to bind hydrogen peroxide.
- Because the substrate and active site are no longer complementary, very few enzyme–substrate complexes form, and the activity falls to 1.2 au — about an eight-fold decrease.
Key Takeaways
- Enzymes have an optimum temperature at which activity is maximal.
- Above the optimum, enzymes denature: the tertiary structure is disrupted and the active site loses its specific shape.
- Denaturation is (for most practical purposes) irreversible; activity does not recover on cooling.
- The fall in activity above the optimum is sharp because the active site of every enzyme molecule is affected, not just a fraction of them.
Common Mistakes
- Saying the enzyme is 'killed' (enzymes are not alive).
- Saying the substrate is denatured (it is the enzyme that denatures, not the substrate).
- Saying the enzyme 'stops working' without explaining why (the explanation must invoke the change in active-site shape).
- Confusing denaturation with the reversible effect of high temperature on reaction rate (Q10 effect), which applies below the optimum, not above.
Things to Be Careful About
- The mark scheme allows EITHER direction of argument: 'at 37.5 °C more enzyme–substrate complexes form than at 55.0 °C' OR (ora) 'at 55.0 °C fewer complexes form than at 37.5 °C'. Either is accepted.
- A complete answer mentions: denaturation, change in active-site shape, and loss of complementarity between substrate and active site.
- The substrate (hydrogen peroxide) is a small molecule and is not affected by temperature in the way a protein is — the change is in the enzyme, not the substrate.
The rest of this paper
1 more questions- Q2—18M