Biology 9700/34 — October/November 2021
Cambridge AS Level · Advanced Practical Skills · worked solutions for every part, with the mark scheme
Topics Presentation of Data and Observations · Manipulation, Measurement and Observation · Analysis, Conclusions and Evaluation · Use of the Light Microscope
Visking tubing is a selectively permeable membrane, similar to a cell membrane. Some biological molecules are able to diffuse through the Visking tubing membrane.
You will investigate the effect of temperature on the diffusion of reducing sugar through the Visking tubing membrane into the surrounding water.
You will need to:
- prepare a serial dilution of 10.0% reducing sugar, R
- estimate the concentration of reducing sugar in the water at two different temperatures.
You are provided with the materials shown in Table 1.1 and Table 1.2.
Table 1.1
| labelled | contents | hazard | volume/ |
|---|---|---|---|
| R | 10.0% reducing sugar solution | none | 30 |
| G | 20.0% reducing sugar solution | none | 30 |
| B | Benedict’s solution | harmful irritant | 30 |
| W | distilled water | none | 100 |
Table 1.2
| labelled | details |
|---|---|
| V | 2 lengths (15 cm) of Visking tubing in a beaker of water |
| P | beaker containing water at room temperature |
| Q | beaker containing hot water |
If any solution comes into contact with your skin, wash off immediately under cold water.
It is recommended that you wear suitable eye protection.
You will set up the apparatus as shown in Fig. 1.1 using step 1 to step 6.
- Tie a knot in one piece of the Visking tubing as close as possible to one end, so that the end is sealed.
- To open the other end, wet the Visking tubing and rub the tubing gently between your fingers and thumb.
- Put of G into the Visking tubing.
- Rinse the outside of the Visking tubing by dipping it into the water in the beaker labelled V.
- Put the Visking tubing into the large test-tube labelled P1. Put this test-tube into a test-tube rack.
- Fold the open end of the Visking tubing over the top of the large test-tube. Use a paper clip to hold the Visking tubing in place as shown in Fig. 1.1.
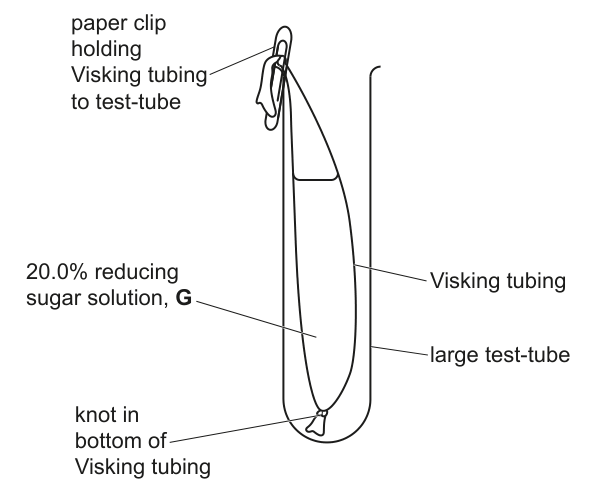
Carry out step 7 to step 15.
- Repeat step 1 to step 6 with the other piece of Visking tubing and the large test-tube labelled Q1.
- Record the temperature of the water in beaker P. ......................
- Prepare a water-bath at using beaker Q. The water may need to be heated.
- Use a syringe to transfer distilled water, W, into each of the large test-tubes containing the Visking tubing.
The level of water in each large test-tube must be just above the level of G in the Visking tubing, as shown in Fig. 1.2.
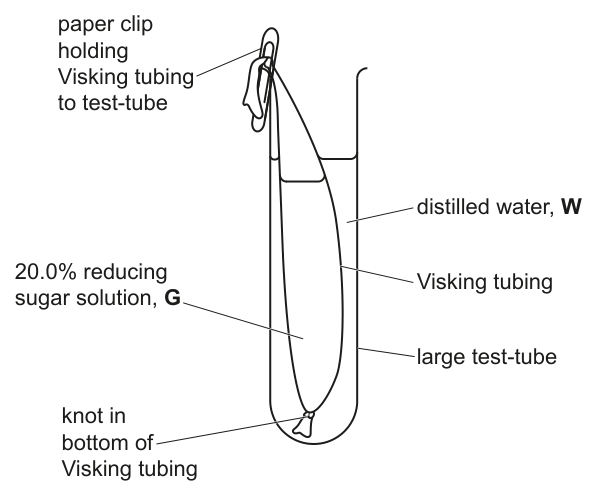
- Put the test-tube P1 containing Visking tubing into beaker P.
- Put the test-tube Q1 containing Visking tubing into beaker Q.
- Start timing and leave for at least 10 minutes. During this 10 minutes continue with step 14 to step 18.
- Put of distilled water, W, into each of the small test-tubes P2 and Q2. Draw a line on each test-tube at the level of the water.
- Pour this water into the container labelled For waste. Put test-tubes P2 and Q2 into a test-tube rack ready for step 21 and step 22.
You will now need to carry out a serial dilution of the 10.0% reducing sugar solution, R, to reduce the concentration by a factor of 10 between each successive dilution.
You will need to prepare four concentrations of reducing sugar solution in addition to the 10.0% reducing sugar solution, R.
After the serial dilution is completed, you will need to have of each concentration available to use.
Complete Fig. 1.3 to show how you will prepare your serial dilution.
Fig. 1.3 shows the first two beakers you will use to make your serial dilution. You will need to draw three additional beakers.
For each beaker, add labelled arrows to show:
- the volume of reducing sugar solution transferred
- the volume of distilled water, W, added.
Under each beaker, state the concentration of reducing sugar solution.
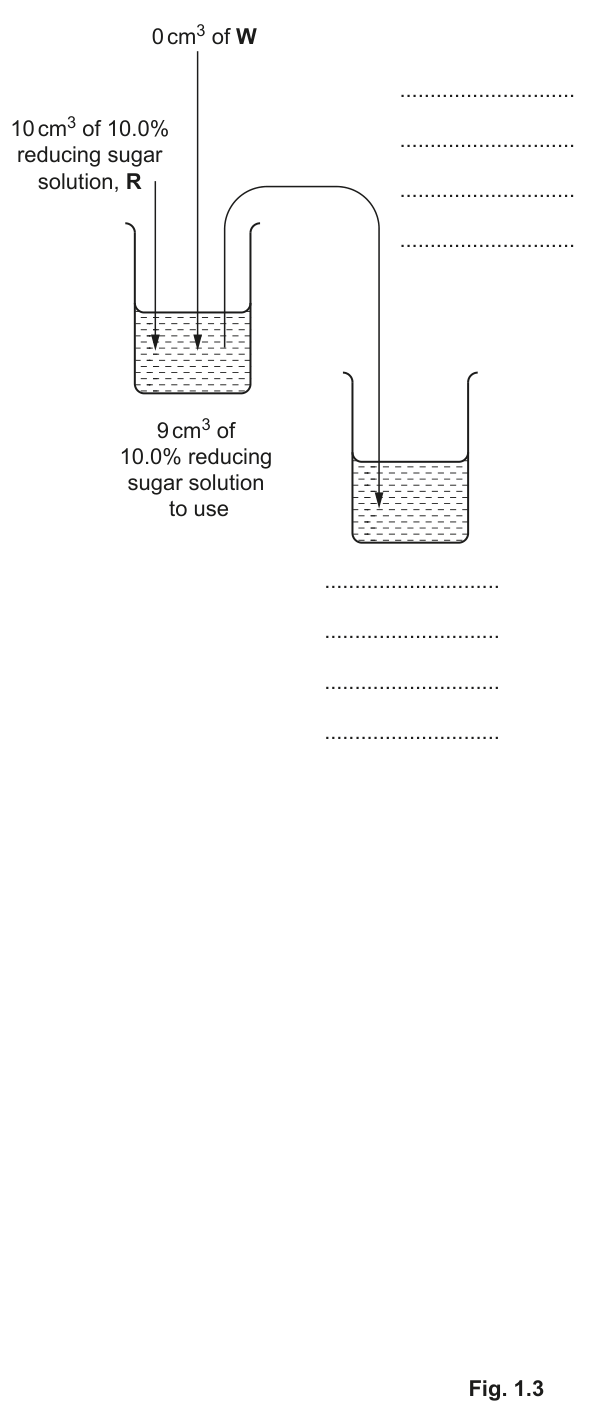
Answer
Draw three further beakers to the right of the two already shown. For each new beaker draw:
- an arrow showing transferred from the previous beaker
- an arrow showing of distilled water, W, added
Under each beaker write the concentration of reducing sugar solution it contains.
| Beaker | Concentration |
|---|---|
| 1 (given) | |
| 2 (given) | |
| 3 | |
| 4 | |
| 5 |
Serial dilution: beaker 1 = 10.0% (given), beaker 2 = 1.0% (given), beakers 3, 4, 5 = 0.1%, 0.01%, 0.001%; each transfer = 1 cm³; each diluent addition = 9 cm³ of W.
Background Concept
A serial dilution is a step-wise dilution in which each new solution is made by diluting the previous one by the same factor. Because the same factor is applied repeatedly, very low concentrations can be reached accurately and quickly, starting from a single concentrated stock.
The key arithmetic is:
If of solution is added to of water, the dilution factor is
so each successive beaker is one-tenth the strength of the one before. This is the standard "factor of 10" serial dilution.
Understanding the Question
The investigation needs four concentrations of reducing sugar in addition to the stock R, so five beakers in total. The first two beakers are already drawn on Fig. 1.3:
- Beaker 1 contains of R (no water added).
- Beaker 2 is the result of taking from beaker 1 and adding of W.
The student must complete beaker 2 (label the concentration) and draw three more beakers continuing the same procedure. The final answer is a completed diagram, not text.
Approach
- Each beaker beyond the first must contain of W.
- Each beaker beyond the first receives from the previous beaker.
- Each concentration is one-tenth of the previous one.
- Label the concentration under every beaker, in with the correct number of significant figures.
Step-by-Step Reasoning
- Beaker 1: — given.
- Beaker 2: — given, to be completed.
- Beaker 3: — to be drawn.
- Beaker 4: — to be drawn.
- Beaker 5: — to be drawn.
At every step the transfer volume is and the diluent volume is of W — these are the two arrows that must appear on every beaker drawn.
Key Takeaways
- A tenfold serial dilution uses a ratio of transfer to diluent.
- Concentrations shrink by a factor of 10 at each step: .
- Always label both volumes (transfer and diluent) and the resulting concentration.
Common Mistakes
- Adding of W to the first beaker (the first beaker is the stock — no water is added).
- Writing of W in error — W is added as in the new beaker.
- Forgetting to label the concentration under each new beaker, or writing the wrong number of significant figures (e.g. instead of ).
- Showing a transfer of but no diluent arrow, or vice versa.
Things to Be Careful About
- Each beaker must end up with the same total volume () so that an equal aliquot can be taken from each in step 18.
- The arrow direction must be from the previous beaker into the new beaker.
- The factor of 10 applies to the concentration, not to the volume — volume always returns to after the diluent is added.
Carry out step 16 to step 29.
- Prepare the concentrations of reducing sugar solution, as decided in (a)(i), in the beakers provided.
- Label five small test-tubes with the concentrations you prepared in step 16.
- Put of each concentration of reducing sugar solution into the appropriately labelled test-tube. Put these five test-tubes into a test-tube rack ready for step 24.
- After at least 10 minutes (step 13), remove test-tubes P1 and Q1 from the beakers and put them in a test-tube rack.
- Remove the Visking tubing from test-tubes P1 and Q1 and put these into the container labelled For waste. Do not throw away the solution remaining in the test-tubes.
- Use a pipette to transfer solution from the large test-tube P1 into the small test-tube P2, up to the line you drew in step 14.
- Use a pipette to transfer solution from the large test-tube Q1 into the small test-tube Q2, up to the line you drew in step 14.
- Carefully remove some water from beaker Q so there is approximately of water in the beaker. Use this as a water-bath and heat to boiling ready for step 25.
- Put of Benedict’s solution, B, into each of the five small test-tubes from step 18. Shake gently to mix.
- Put the test-tube labelled 10.0% into the boiling water-bath. Start timing.
- Measure the time taken to the first appearance of a colour change in the test-tube. If there is no colour change after 120 seconds, stop timing and record as ‘more than 120’.
- Record the result from step 26 in (a)(ii).
- Remove the test-tube from the water-bath. Put the test-tube in the test-tube rack.
- Repeat step 25 to step 28 with the remaining concentrations of reducing sugar solution.
Record your results in an appropriate table.
Answer
Record results in a table. Representative example (exact times are student-dependent):
| concentration of reducing sugar / % | time to first colour change / s |
|---|---|
| 10.0 | 15 |
| 1.0 | 25 |
| 0.1 | 40 |
| 0.01 | 65 |
| 0.001 | 100 |
The time for the highest concentration () is shorter than the time for the lowest concentration ().
Table: heading 'concentration of reducing sugar / %' first, then 'time to first colour change / s'; five whole-number results; time increases as concentration decreases.
Background Concept
Benedict's test detects reducing sugars. When heated with Benedict's reagent, a reducing sugar reduces the blue copper(II) ions to a brick-red precipitate of copper(I) oxide. The higher the concentration of reducing sugar, the faster the colour change appears. This is the basis of a simple calibration: a known series of concentrations is tested, and the time to first colour change is recorded; the same test on an unknown sample can then be compared against this calibration to estimate the unknown concentration.
Understanding the Question
Steps 16–29 instruct the candidate to:
- Prepare the five standard concentrations from (a)(i).
- Put of each into a labelled small test-tube.
- Add of Benedict's solution B to each.
- Heat each in a boiling water-bath and time to the first appearance of a colour change.
- Record all results in a single table.
The marks are for the table's conventions and the trend in the data.
Approach
Draw a two-column table. The independent variable (concentration) comes first; the dependent variable (time) comes second. Put units in the heading using the convention quantity / unit and leave the body of the table free of units. Use whole numbers of seconds because the human reaction time and the imprecision of judging the first colour change make fractions of a second meaningless.
Step-by-Step Reasoning
- Heading 1:
concentration of reducing sugar / %— independent variable, no units in the body. - Heading 2:
time to first colour change / s— dependent variable, no units in the body. - Enter one row per concentration prepared in (a)(i): , , , , .
- Enter the time in whole seconds. If no change by , record
>120. - Check the trend: the highest concentration must give the shortest time, because more reducing sugar reacts faster with the Benedict's reagent.
Key Takeaways
- Independent-variable column first, dependent-variable column second.
- Units in the heading, not in the body of the table.
- Times should be in whole seconds because of reaction-time error.
- The calibration should show a clear monotonic trend (time ↑ as concentration ↓).
Common Mistakes
- Putting the dependent-variable heading first.
- Repeating the unit (, s) in every cell of the body.
- Recording the time to a non-whole number (e.g. ) — reject.
- Reversing the trend (lowest concentration giving the shortest time) — reject.
- Omitting any of the five concentrations.
Things to Be Careful About
- Benedict's solution is a harmful irritant — avoid skin and eye contact; the eye-protection and wash-off instructions in the question are compulsory safety points.
- Start timing only after the test-tube is in the boiling water-bath, otherwise the first few seconds of warming are not on the clock.
- If the colour never changes, write
>120exactly as instructed; do not write a single number above 120.
- Put of Benedict’s solution, B, into test-tube P2. Shake gently to mix.
- Put this test-tube into the boiling water-bath. Start timing.
- Measure the time taken to the first appearance of a colour change in the test-tube. If there is no colour change after 120 seconds, stop timing and record as ‘more than 120’.
- Record the result from step 32 in (a)(iii).
- Remove the test-tube from the water-bath. Put the test-tube in the test-tube rack.
- Repeat step 30 to step 34 with test-tube Q2.
Result for P2 = ______
Result for Q2 = ______
Answer
Result for P2 = e.g.
Result for Q2 = e.g.
(Exact times are student-dependent. The time for P2 is longer than the time for Q2, and the unit s appears at least once.)
P2 > Q2 in seconds, e.g. P2 = 30 s and Q2 = 15 s; units shown.
Background Concept
The same Benedict's test used to make the calibration in (a)(ii) is now applied to the samples of water outside the Visking tubing in test-tubes P2 and Q2. P2 held the Visking tubing at room temperature, while Q2 held it in a water-bath. A faster colour change in Q2 means more reducing sugar has diffused out, i.e. a higher concentration of reducing sugar in the surrounding water.
Understanding the Question
Steps 30–35 ask the candidate to repeat the Benedict's test, this time on the contents of test-tubes P2 and Q2 (which were filled to the line in step 14, then topped up in step 21/22 with the water that had surrounded the Visking tubing for at least 10 minutes). The marks are for recording both times with the unit and noting that P2 takes longer than Q2.
Approach
Add of Benedict's solution B to each small test-tube, heat in the boiling water-bath, time to the first colour change, and write each time next to the correct label.
Step-by-Step Reasoning
- P2 is the room-temperature sample. Diffusion is slower, so less reducing sugar has reached the surrounding water. The Benedict's test therefore takes longer to produce a colour change.
- Q2 is the sample. At the higher temperature the molecules have more kinetic energy, diffuse faster, and reach a higher concentration in the surrounding water in the same 10 minutes. The Benedict's test takes less time to change colour.
- Quote each time in seconds, with the unit written at least once.
Key Takeaways
- The diffusion experiment is read off indirectly: a shorter Benedict's time corresponds to a higher concentration of reducing sugar that has diffused out of the Visking tubing.
- A comparison of two single readings still needs the unit written.
Common Mistakes
- Forgetting to write the unit, or writing
secondsonly in the body of a table rather than next to the value. - Recording the time to complete colour change rather than the first appearance — the mark scheme specifies first appearance.
- Mixing up P2 and Q2 (room-temperature vs ).
Things to Be Careful About
- Use the same water-bath temperature for both P2 and Q2 in this step — only the prior temperature (in the diffusion step) differed.
- The lines drawn in step 14 ensure that an equal volume of water surrounds the Visking tubing in P1 and Q1, so P2 and Q2 hold equal sample volumes and a direct comparison of times is valid.
Using your results from (a)(ii) and (a)(iii) estimate the concentration of reducing sugar in P2 and Q2.
concentration of reducing sugar in P2 = ______
concentration of reducing sugar in Q2 = ______
Answer
Compare the Benedict's time for P2 with the candidate's own calibration table from (a)(ii), and read off the concentration whose time matches it most closely. Repeat for Q2.
- concentration of reducing sugar in P2 = e.g. (any value in the candidate's table whose time matches P2)
- concentration of reducing sugar in Q2 = e.g. (any value in the candidate's table whose time matches Q2)
Because Q2 took less time than P2, the concentration in Q2 must be higher than in P2.
Concentrations estimated from the candidate's own calibration: P2 corresponds to a lower concentration than Q2 (e.g. P2 ≈ 0.1%, Q2 ≈ 1.0%).
Background Concept
The table from (a)(ii) is a calibration. The Benedict's reaction time is inversely related to the concentration of reducing sugar: a higher concentration reacts faster and gives a shorter time. So an unknown time can be matched to the concentration whose calibration time is closest.
Understanding the Question
The candidate has a calibration (concentration vs. time) and two new readings, P2 and Q2. Each new time has to be matched back to a concentration from the calibration. The marks are for reading off a value that is consistent with the candidate's own calibration — not with a "correct" answer.
Approach
- Look at the time for P2 and find the row in the calibration table with the same (or nearest) time.
- Read off the concentration in that row.
- Repeat for Q2.
- Sanity-check: because the calibration is monotonic (time ↓ as concentration ↑), the shorter time must correspond to the higher concentration.
Step-by-Step Reasoning
- If P2 took ~ and Q2 took ~, and the calibration shows and , then:
- P2 () sits between the and rows — closest to (or a value near it).
- Q2 () is below the time, so its concentration is at or above .
- The result must be consistent: P2's concentration < Q2's concentration, because P2's time > Q2's time.
Key Takeaways
- The calibration table from (a)(ii) is a quantitative tool, not just a record of results.
- A monotonic trend (here: time ↑ as concentration ↓) lets you convert any time to a concentration estimate.
- Estimates are only as good as the calibration; that is why (a)(viii) asks how to improve the accuracy.
Common Mistakes
- Picking a concentration that is inconsistent with the trend (e.g. assigning a higher concentration to the longer time).
- Reporting a value outside the range of the calibration, which is not justified by the data.
- Trying to be more precise than the data allows (e.g. quoting when the calibration jumps in tenfold steps).
Things to Be Careful About
- The five calibration concentrations () span four orders of magnitude. If Q2's time is shorter than the row's time, the candidate should write
> 10%rather than invent a value. - This is an estimate; it is acceptable to say "between and " if that is what the data justify.
Explain the difference between your results for P2 and Q2.
Answer
In Q2 the surrounding water is at a higher temperature (), so the reducing-sugar molecules have more kinetic energy, move faster, and diffuse through the Visking tubing membrane more quickly. This produces a higher concentration of reducing sugar in the surrounding water in the 10 minutes and so a faster Benedict's test.
Q2 has more kinetic energy so faster diffusion.
Background Concept
Kinetic theory says that the temperature of a substance is a measure of the average kinetic energy of its particles. As temperature rises, particles move faster. Diffusion is the net movement of particles from a region of higher concentration to one of lower concentration, caused by the random motion of the particles; the faster the particles move, the faster diffusion proceeds.
Visking tubing acts as a partially permeable membrane — small molecules (such as the reducing-sugar molecules used here) can pass through the pores, while larger molecules cannot. The rate at which they pass depends on how fast they move, i.e. on the temperature.
Understanding the Question
The candidate has just found that the Benedict's time for Q2 is shorter than the time for P2, i.e. the higher-temperature sample contains more reducing sugar. The question asks the candidate to explain this in terms of what is happening at the molecular level.
Approach
Connect temperature to kinetic energy, kinetic energy to particle speed, and particle speed to the rate of diffusion through the membrane. State the direction of the expected effect (more kinetic energy → faster diffusion → more sugar outside in the same time → shorter Benedict's time).
Step-by-Step Reasoning
- P2 sat in water at room temperature; Q2 sat in a water-bath. The reducing-sugar molecules in Q2 are therefore at a higher temperature.
- Higher temperature = higher average kinetic energy = faster random motion of the molecules.
- Faster motion means the molecules strike the Visking tubing membrane more often and with more energy, and they cross the membrane faster.
- The net result is that more reducing-sugar molecules have diffused into the surrounding water in Q2 in the 10 minutes of step 13.
- A higher concentration of reducing sugar in the surrounding water gives a faster Benedict's test, i.e. a shorter time in step 32.
Key Takeaways
- Temperature is a measure of average kinetic energy, not of "heat content" — the candidate should not say "more heat".
- Diffusion rate is set by both the concentration gradient and the speed of the particles; here the gradient is identical (both started with the same sugar solution inside the Visking tubing), so the temperature difference is the only variable that matters.
Common Mistakes
- Saying "the membrane lets more through at higher temperature" without the kinetic-energy step — this is a restatement, not an explanation.
- Talking about the water moving faster rather than the sugar molecules.
- Confusing the direction of the temperature effect (a higher temperature does not slow diffusion).
Things to Be Careful About
- The mark scheme's exact wording is "Q2 has more kinetic energy so faster diffusion" — the candidate should link the two ideas explicitly.
- Do not introduce new variables (e.g. membrane damage at ) — the mark scheme expects the kinetic-theory explanation.
State the dependent variable in the investigation you have just carried out.
Answer
Time taken to first colour change (with Benedict's solution).
Time taken to first colour change.
Background Concept
In any experiment, the independent variable is what the experimenter deliberately changes; the dependent variable is what is measured to see the effect of that change. Standardised (control) variables are kept the same so they cannot explain any difference in the dependent variable.
In this investigation:
- Independent variable: temperature of the water surrounding the Visking tubing (room temperature vs. ).
- Dependent variable: what is actually measured. The candidate does not measure the concentration of reducing sugar directly; they measure the time for Benedict's solution to produce the first colour change, and use that as a proxy for the concentration.
- Standardised variables: the volume of sugar inside the Visking tubing, the surface area of the tubing, the duration of the diffusion step, the volume of Benedict's solution used, the temperature of the water-bath in the Benedict's step, and so on.
Understanding the Question
The question is a one-mark identification. The candidate must name what was actually measured in the investigation — i.e. what was recorded as a numerical value in (a)(ii) and (a)(iii).
Approach
Look at the headings of the table in (a)(ii) and the entries in (a)(iii); the dependent variable is the one whose value depends on the temperature of the diffusion step.
Step-by-Step Reasoning
- What is recorded in (a)(ii)? — the time to first colour change at each calibration concentration.
- What is recorded in (a)(iii)? — the time to first colour change for P2 and for Q2.
- Both are times, not concentrations. The concentration of reducing sugar in P2 and Q2 is inferred later (in (a)(iv)) from the calibration, but it is not directly measured.
- The dependent variable is therefore the time taken to first colour change.
Key Takeaways
- The dependent variable is always the measured quantity, not the inferred one.
- In a Benedict's-test calibration, the time is measured and the concentration is inferred.
Common Mistakes
- Writing "concentration of reducing sugar" — this is inferred, not measured; reject.
- Writing "rate of diffusion" — the rate is also inferred; reject.
- Writing "temperature" — this is the independent variable, not the dependent one; reject.
Things to Be Careful About
- The mark scheme expects the exact phrase "time taken to first colour change" — the word first is important because the colour continues to develop after the first appearance.
- Do not add "with Benedict's solution" unless asked — it is not required for the mark.
Identify one source of error in step 24 to step 29.
Suggest an improvement to the method which will reduce the effect of this error.
error = ______
improvement = ______
Answer
Error: difficult to judge the first appearance of the colour change (the change is gradual and the observer's eye adapts).
Improvement: use a colour chart / colour standard and compare each test-tube against it at the same time interval.
or
Error: unequal mixing of Benedict's solution with the sample.
Improvement: mix for a set time (e.g. shake each tube for the same number of seconds immediately after adding Benedict's solution).
Error = difficult to judge first colour change; improvement = use a colour chart. (Or: unequal mixing → mix for a set time.)
Background Concept
Steps 24–29 are the calibration Benedict's tests. The candidate times how long each tube takes to show a colour change, and uses those times to estimate the concentrations in P2 and Q2. Anything that makes one time too long or too short relative to the others is a source of error; the corresponding improvement should target that specific error.
Two well-known limitations of a manual Benedict's test in this kind of timing experiment are:
- The colour change is gradual and the first appearance is hard to pinpoint; different observers (or the same observer on different days) will record different times for the same tube.
- The mixing of Benedict's solution with the sample is done by "shaking gently", which is not standardised between tubes, so a tube that is shaken harder will react slightly faster and vice versa.
Understanding the Question
This is a one-error, one-improvement question. The error and the improvement must match: a vague improvement (e.g. "be more careful") scores zero; an improvement that does not address the named error also scores zero.
Approach
Pick one specific, observable problem from steps 24–29 and pair it with a specific, practical change to the method that would reduce that problem.
Step-by-Step Reasoning
Option 1 — colour-judgement error.
- The first appearance of the brick-red colour is gradual, and the human eye adapts, so the recorded time is observer-dependent.
- Improvement: prepare a series of standards covering the range of expected colours, and hold each test-tube next to the standard at regular intervals to detect the first appearance more objectively. (A printed colour chart is the simplest version.)
Option 2 — mixing error.
- Step 24 says "shake gently to mix", but the duration and vigour of shaking is not controlled, so different tubes receive different mixing.
- Improvement: shake each tube for the same fixed time (e.g. exactly ) immediately after adding Benedict's solution, or invert each tube a fixed number of times.
Key Takeaways
- A useful error is specific to one step of the method, not a generic "human error".
- The improvement must target the named error; if it does not, no mark is awarded.
- In a Benedict's-test timing experiment, the two largest practical errors are colour judgement and uneven mixing — both are recognised by the mark scheme.
Common Mistakes
- Vague errors: "not accurate", "human error", "not enough time".
- Improvements that do not match the error: e.g. "use a colorimeter" for the mixing error, or "repeat the experiment" for the colour-judgement error.
- Re-stating the same idea in different words (e.g. "hard to see the colour" with the improvement "look more carefully").
Things to Be Careful About
- Do not name a different step's error by mistake — steps 24–29 are the calibration Benedict's tests, not the diffusion step.
- The mark scheme gives two alternative pairs; one correct pair is enough for both marks, but the error and the improvement must both be correct.
Suggest how you could modify this procedure to obtain a more accurate estimate of reducing sugar concentration in P2 and Q2.
Answer
Any two of:
- Prepare more concentrations of reducing sugar.
- Prepare the additional concentrations between the values estimated for P2 and Q2 (e.g. if the estimates are and , prepare , , , , ) so that the calibration is finer where it matters.
- Plot a graph of concentration (x-axis) against time to first colour change (y-axis) using the calibration data and read off the concentrations for P2 and Q2 from the line.
Two of: (1) more concentrations, (2) concentrations between the estimates for P2 and Q2, (3) plot a calibration graph and read off the values.
Background Concept
The estimates in (a)(iv) come from a calibration table with only five concentrations spread over four orders of magnitude. The estimate can therefore be off by a factor of 10 just because the unknown sample's time falls between two adjacent calibration points. The more calibration points, and the closer they are spaced, the more accurate the estimate. A calibration graph lets the candidate read off intermediate values more precisely than a discrete table.
Understanding the Question
The candidate is asked to suggest how the procedure could be modified to give a more accurate estimate of the concentrations in P2 and Q2. The marks are for any two of the three specific improvements listed in the mark scheme.
Approach
Think about why the current estimate is uncertain: too few calibration concentrations, too widely spaced, and read off a table rather than a graph. Propose a modification that attacks one (or more) of these limitations.
Step-by-Step Reasoning
- More concentrations — instead of the tenfold series, prepare additional solutions at intermediate values. This reduces the gap between calibration points and therefore the uncertainty of any read-off.
- Concentrations in a relevant range — the extra concentrations should fall in the range of interest, i.e. between (or near) the original estimates for P2 and Q2. Adding extra concentrations at the extreme ends (e.g. ) is wasted effort.
- Graphical read-off — plotting concentration against time and drawing a smooth line lets the candidate read off any concentration (not just the five in the table) more accurately. It also makes it obvious when a sample's time falls between two calibration points.
Key Takeaways
- Accuracy improves with density of calibration points, especially in the range of the unknown.
- A graph is a continuous calibration; a table is a discrete calibration. A continuous calibration allows read-off between the original points.
- A "more accurate" modification is one that reduces a specific source of uncertainty, not just "repeat more times".
Common Mistakes
- Suggesting "repeat the experiment" or "take more readings" — these improve reliability (precision), not necessarily accuracy.
- Adding concentrations outside the relevant range (e.g. only more very dilute standards), so the density of calibration does not improve where the unknown lies.
- Suggesting a completely different method (e.g. use a colorimeter) — this is a different method, not a modification of the existing one.
Things to Be Careful About
- The mark scheme specifically asks for the new concentrations to be between the stated range specific to the estimates — the candidate should quote the range they would target (e.g. "between and "), not just say "more concentrations".
- "Plot a graph and read off values" only scores if the candidate identifies P2 and Q2 as the samples to be read off; a generic "draw a graph" does not score.
A student investigated the effect of the concentration of acid on the distance it diffused through agar blocks containing universal indicator over a period of two minutes.
The results are shown in Table 1.3.
Table 1.3
| concentration of hydrochloric acid / | distance acid diffused in 2 minutes / |
|---|---|
| 1.00 | 9.0 |
| 0.89 | 8.5 |
| 0.75 | 4.5 |
| 0.45 | 4.0 |
| 0.27 | 3.8 |
Plot a graph of the data in Table 1.3 on the grid in Fig. 1.4.
Use a sharp pencil for drawing graphs.
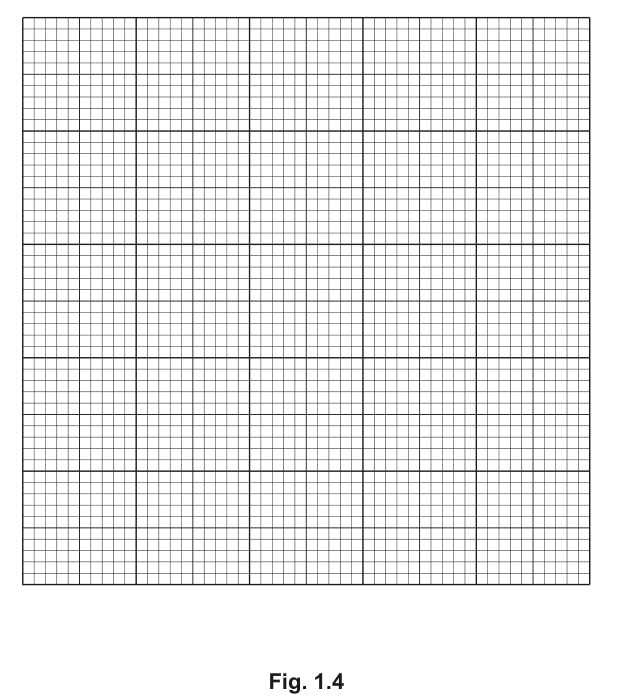
Answer
- x-axis: concentration of hydrochloric acid / , scale to , labelled every (or every ) .
- y-axis: distance acid diffused in minutes / , scale to , labelled every .
- Plot the five points as small crosses (×) or dots in circles (⊙):
- Join the points with a thin line that passes through every point.
Line graph: x = concentration / mol dm⁻³, y = distance / mm; five points plotted as small crosses; points joined with a thin line.
Background Concept
A line graph is the correct way to display two continuous variables (here, concentration and distance). The convention is:
- the independent variable (concentration) on the x-axis,
- the dependent variable (distance diffused) on the y-axis,
- a scale that is linear, uses at least half the printed grid, and does not have "awkward" intervals (e.g. multiples of 3, 7),
- points plotted as small, clear crosses (×) or dots in circles (⊙) so the examiner can see them,
- the points joined with a thin line — here, because the question asks for a line through all the points, the line passes through every plot.
Understanding the Question
The candidate is given a printed grid (Fig. 1.4) and a five-row data table. They must plot the data as a line graph, satisfying four separate conventions for four marks.
Approach
- Choose which variable goes on which axis (independent on x).
- Decide the scale on each axis, using a "nice" interval that lets the points cover most of the grid.
- Plot each (x, y) point as a small cross or dot-in-circle.
- Join the points with a thin line.
Step-by-Step Reasoning
- Axes — concentration of HCl is the independent variable → x-axis; distance diffused in 2 minutes is the dependent variable → y-axis. Add units to each axis label, in the form
quantity / unit. - x-scale — data run from to . The mark scheme's " to " means that should occupy on the grid. A clean labelling interval is every (so ), or every if the grid is small. The scale should start at and reach at least so that all five points are on the grid and the right-hand of the grid is used.
- y-scale — data run from to . The mark scheme's " to " means per . A clean labelling interval is every (so ). The scale should start at and reach at least so the highest point is on the grid and most of the grid is used.
- Plotting — for each row in the table, locate the x-value on the x-axis, move up to the y-value on the y-axis, and draw a small × or ⊙ exactly at that intersection.
- Joining — connect the five plots with a thin, continuous ruled line. Because the question asks for a line that passes through every point, the line is drawn point-to-point in order of x.
Key Takeaways
- Independent → x, dependent → y, units in the heading.
- Pick a scale that uses at least half the grid and avoids awkward numbers.
- Plot the points clearly; "small cross" means the cross should be no larger than the smallest grid square.
- When the question asks for the line to pass through all the points, draw a ruled line joining them in order — do not draw a line of best fit that misses some points.
Common Mistakes
- Putting the dependent variable on the x-axis.
- Using an awkward scale (e.g. per ) so the points cluster on one side of the grid.
- Plotting large blobs instead of small crosses — the mark scheme specifies small crosses or dots in circles.
- Drawing a smooth curve of best fit that misses some points, or a thick line.
- Omitting units on the axis labels.
Things to Be Careful About
- The mark scheme specifies "labelled at least every " — this is a CIE convention so that the scale is readable. On a typical grid ( wide) the x-axis should be labelled about times; on a typical grid about – times.
- The question instructs the use of a sharp pencil — a soft pencil produces a thick line that will not earn the "thin line" mark.
- All five points should be plotted, even if one looks anomalous. Anomalies are discussed in the analysis stage, not removed from the graph.
The rest of this paper
1 more questions- Q2Use of the Light Microscope · Presentation of Data and Observations18M