Biology 9700/33 — October/November 2021
Cambridge AS Level · Advanced Practical Skills 1 · worked solutions for every part, with the mark scheme
Topics Analysis, Conclusions and Evaluation · Manipulation, Measurement and Observation · Presentation of Data and Observations · Use of the Light Microscope
Before you proceed, read carefully through the whole of Question 1 and Question 2.
Plan the use of the two hours to make sure that you finish the whole of Question 1 and Question 2.
During the manufacture of a fruit juice, an unwanted colour can sometimes appear in the juice. An enzyme can be used to remove this colour.
You will carry out an investigation to determine the concentration of enzyme that is most effective at removing the colour in mock fruit juice, J. Solution J is not real fruit juice, so is not safe to drink.
You are provided with the materials shown in Table 1.1.
Table 1.1
| labelled | contents | hazard | volume / |
|---|---|---|---|
| J | mock fruit juice | harmful | 60 |
| E | 2.0% enzyme solution | harmful irritant | 25 |
| W | distilled water | none | 100 |
If any solution comes into contact with your skin, wash off immediately under cold water.
It is recommended that you wear suitable eye protection.
You will need to carry out a serial dilution of the 2.0% enzyme solution, E, to reduce the concentration by half between each successive dilution.
You will need to prepare four concentrations of enzyme solution in addition to the 2.0% enzyme solution, E.
After the serial dilution is completed you need to have of each concentration available to use.
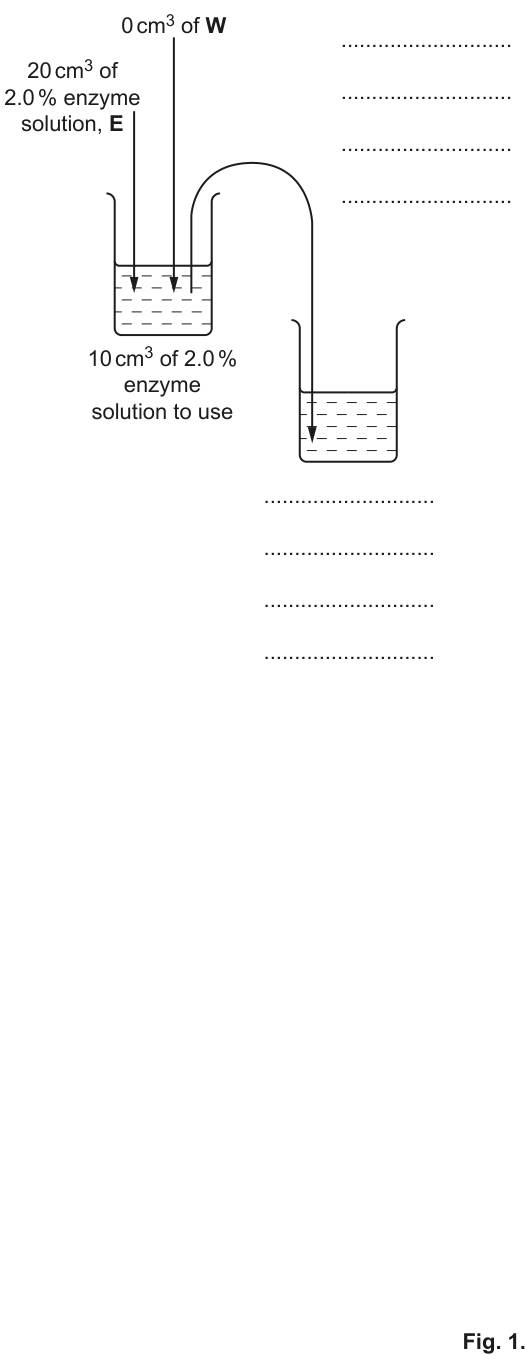
Complete Fig. 1.1 to show how you will prepare your serial dilution.
Fig. 1.1 shows the first two beakers you will use to make your serial dilution. You will need to draw three additional beakers.
For each beaker add labelled arrows to show:
- the volume of enzyme solution transferred.
- the volume of distilled water, W, added.
Under each beaker, state the concentration of enzyme solution.
Answer
The completed serial dilution has five beakers in a row, with the volume transferred between each successive beaker being the same.
- Beaker 1 (already shown): of 2.0% enzyme solution, , + of water, → of 2.0% enzyme solution to use.
- Beaker 2: of 2.0% enzyme solution (transferred from beaker 1) + of added → of 1.0% enzyme solution to use.
- Beaker 3: of 1.0% enzyme solution (from beaker 2) + of added → of 0.5% enzyme solution to use.
- Beaker 4: of 0.5% enzyme solution (from beaker 3) + of added → of 0.25% enzyme solution to use.
- Beaker 5: of 0.25% enzyme solution (from beaker 4) + of added → of 0.125% enzyme solution to use.
Four diluted concentrations made by halving: 1.0%, 0.5%, 0.25%, 0.125%; each beaker receives 10 cm³ of the previous solution plus 10 cm³ of W (see diagram).
Background Concept
A serial dilution is a stepwise dilution of a solution in which the same dilution factor is applied at each step, so the concentration falls geometrically (here, halved). Each step uses a fixed transfer volume from the previous beaker topped up with the same volume of diluent (distilled water, W), so the new total volume is the same in every beaker. Because only half the original enzyme molecules (and twice the volume) are present, the concentration is halved. This is the standard way to prepare a series of known concentrations from one stock solution, and it is the basis for many enzyme and microbiology assays.
Understanding the Question
The stock enzyme solution, E, is at 2.0%. The candidate must produce four further concentrations, each exactly half the previous one, with of each concentration available for the colour-removal test. Halving 2.0% three times gives 1.0%, then 0.5%, then 0.25%, then 0.125% — four new concentrations, as required. The volumes chosen ( transferred + of water) give in each new beaker, of which is used and remains in the beaker (a useful spare).
Approach
The volume and concentration arithmetic must be set out first:
| step | transferred from previous | + water W | new concentration | new total | to use |
|---|---|---|---|---|---|
| beaker 1 (stock) | – | 0 cm³ | 2.0% | 20 cm³ | 10 cm³ |
| beaker 2 | 10 cm³ of 2.0% | 10 cm³ | 1.0% | 20 cm³ | 10 cm³ |
| beaker 3 | 10 cm³ of 1.0% | 10 cm³ | 0.5% | 20 cm³ | 10 cm³ |
| beaker 4 | 10 cm³ of 0.5% | 10 cm³ | 0.25% | 20 cm³ | 10 cm³ |
| beaker 5 | 10 cm³ of 0.25% | 10 cm³ | 0.125% | 20 cm³ | 10 cm³ |
This plan is then transferred onto the figure: each beaker needs an incoming transfer arrow (labelled with the transferred volume and the concentration being taken from the previous beaker) and an incoming water arrow (labelled of ), with the new concentration written below the beaker.
Step-by-Step Reasoning
- Identify the dilution factor. "Half between each successive dilution" means concentration concentration.
- Calculate the four new concentrations. Starting from 2.0%:
- Choose the transfer volume. To deliver of each concentration while still being able to mix, transfer from the previous beaker and add of to make total; is then used in the test.
- Complete beaker 2. The transfer arrow from beaker 1 is already drawn; the candidate adds the of arrow and labels the beaker with the new concentration, 1.0%.
- Draw beakers 3, 4 and 5. Each is a copy of beaker 2 with the source concentration updated (1.0% → 0.5% → 0.25% → 0.125%) and the new concentration written below.
- Check. The dilution is geometric (each step is half the previous) and the volumes are consistent ( transferred + water = in each new beaker).
Key Takeaways
- A serial dilution is the cleanest way to make a graded series of concentrations from a single stock.
- The dilution factor at each step is controlled by the ratio of transferred volume to total volume in the new beaker; here , giving a halving series.
- The figure must show every transfer arrow, the diluent arrow and the resulting concentration — the mark scheme rewards all three.
Common Mistakes
- Halving the volume instead of the concentration (e.g. writing 1% volume instead of 1% concentration).
- Writing the new concentration as the old one (the concentration in each beaker after the transfer is what goes under that beaker).
- Drawing an arrow with the wrong transfer volume (any volume other than for both the enzyme transfer and the water).
- Adding water to beaker 1 (the stock) — beaker 1 has 0 cm³ of W, not 10 cm³.
- Forgetting the % sign on the concentration labels.
Things to Be Careful About
- The figure is completed, not redrawn — the candidate adds the three missing beakers, fills in the dotted lines, and adds the labels.
- The two arrows on each new beaker must be clearly distinguishable: one labelled with the volume and the concentration of enzyme being transferred, the other labelled with the volume of added.
- The order of beakers (left to right) must follow the order of dilutions so the source-concentration label on each transfer arrow matches the beaker it comes from.
Carry out steps 1 to 10.
- Prepare the concentrations of enzyme solution, as decided in (a)(i), in the beakers provided.
- Label the test-tubes with the concentrations you prepared in step 1.
- Put of J into each test-tube.
- Using the beakers labelled hot water and cold water, set up a water-bath with water at approximately . Maintain the water-bath at approximately during step 5 to step 8.
- Put the test-tubes from step 3 into the water-bath. Leave the test-tubes for 3 minutes.
- Put of the 2.0% enzyme solution into the appropriately labelled test-tube. Shake gently to mix.
- Repeat step 6 with the other concentrations of enzyme solution you prepared in step 1.
- Start timing and leave the test-tubes in the water-bath for 10 minutes.
While you are waiting carry on with Question 1.
- After 10 minutes (step 8) remove the test-tubes from the water-bath. Observe the colour of the solution in each test-tube.
To see the colour more clearly, it may help to hold a piece of white paper behind the test-tube.
You may see the same colour in more than one test-tube. - Record your results in (a)(ii) using the symbols shown in Table 1.2.
Table 1.2
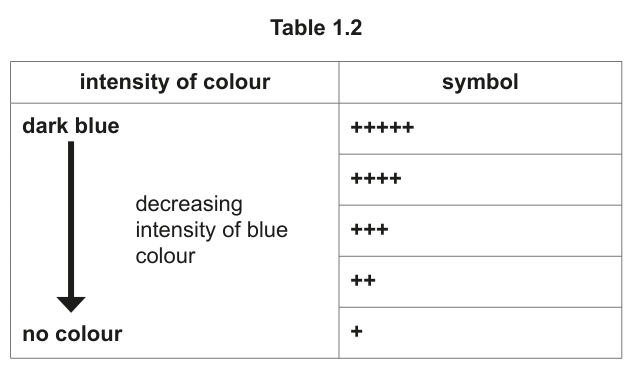
Record your results in an appropriate table.
You may use the same symbols for more than one test-tube.
Answer
| concentration of enzyme (%) | intensity of colour |
|---|---|
| 0.125 | +++++ |
| 0.25 | ++++ |
| 0.5 | +++ |
| 1.0 | ++ |
| 2.0 | + |
Trend: as the concentration of enzyme increases, the intensity of the blue colour in the test-tube decreases (the most dilute enzyme leaves the most colour, the most concentrated enzyme removes the most colour).
Representative results (student-dependent observations): 0.125% = +++++; 0.25% = ++++; 0.5% = +++; 1.0% = ++; 2.0% = +. Trend: increasing enzyme concentration → decreasing colour intensity.
Background Concept
In a Cambridge Paper 3 practical, qualitative observations are recorded in a results table with clear column headings. The independent variable (what was changed, here the enzyme concentration) goes in one column and the dependent variable (what was measured, here the colour intensity) goes in another. The dependent variable is recorded using the symbol key provided (Table 1.2: +++++ = dark blue, + = no colour, decreasing in between) so that the candidate's judgement can be checked against the same scale.
Understanding the Question
The candidate has just removed five test-tubes from a water-bath after , having added of each enzyme concentration (0.125%, 0.25%, 0.5%, 1.0%, 2.0%) to of the blue mock fruit juice, J. The task is to record the colour of each test-tube using the symbols in Table 1.2 and present these in a properly headed table.
Approach
- Decide the columns. One column for the enzyme concentration (the independent variable) and one for the colour intensity (the dependent variable). Headings must include the quantity and, where relevant, the unit.
- Decide the order. Concentrations are normally listed in ascending order so any trend is visible from the table alone.
- Observe each tube in turn, holding a piece of white paper behind it for a clear view, and match the colour to the closest symbol in the key. The same symbol may be used for more than one tube.
- Check the trend. The biology predicts the highest enzyme concentration will give the palest solution (most substrate broken down per unit time) and the lowest concentration will give the darkest solution.
Step-by-Step Reasoning
- Heading for the IV. The mark scheme requires a heading such as concentration of enzyme (%). The percentage sign identifies the unit; writing 'enzyme concentration' alone is not enough.
- Heading for the DV. A heading such as intensity of colour (or symbol for colour intensity) is required. This is a qualitative column, so no units.
- Five rows. The five enzyme concentrations tested (0.125, 0.25, 0.5, 1.0, 2.0%) must each appear once.
- Record using symbols. The intensity is recorded as +++++, ++++, +++, ++ or + depending on how blue the solution remains. The most concentrated enzyme is expected to leave the palest solution (closer to +); the most dilute enzyme is expected to leave the darkest blue (closer to +++++).
- The correct trend. The mark scheme credits a correct trend — colour intensity decreasing as enzyme concentration increases. Any monotonic decrease (e.g. +++++ → ++++ → +++ → ++ → +) earns this mark. The exact gradient is student-dependent.
Key Takeaways
- Always include a clear heading for every column, with units in the heading (or directly under it) where appropriate.
- For qualitative data, use the symbol key provided — don't invent your own.
- Trends in qualitative tables are checked for direction (does colour decrease/increase with concentration?), not exact matches.
- A symbol can be used more than once — the mark scheme says so explicitly.
Common Mistakes
- Omitting the heading or unit for the enzyme concentration (e.g. just writing 0.125 instead of 0.125%).
- Forgetting the trend (writing colours in the wrong direction) — this loses a whole mark.
- Writing words like 'dark blue' instead of the symbols, or mixing words and symbols in the same column.
- Missing one of the five concentrations.
- Writing the concentration column with a % sign only on the first row; it must be in the heading.
Things to Be Careful About
- The intensity of colour is subjective. The marks for the trend are awarded as long as the direction is biologically reasonable (more enzyme → less colour). The marks for the individual readings are awarded as long as all five concentrations have a symbol and the trend is correct.
- Do not invent decimal values between symbols; the key gives only five discrete levels.
- The table must be drawn with ruled lines, not as a free list.
Using your results in (a)(ii), state which concentration of enzyme removed the colour most effectively.
Answer
The 2.0% enzyme solution removed the colour most effectively (it gave the palest solution, symbol + in the table).
2.0% enzyme solution (the concentration with the palest colour, '+', in the table).
Background Concept
The "most effective" concentration is the one that produces the largest change in the dependent variable in the desired direction. Here, the desired direction is the removal of blue colour, so the most effective concentration is the one that leaves the palest solution — i.e. the row in the table with the fewest '+' symbols.
Understanding the Question
The candidate is being asked to interpret the results table they have just completed in (a)(ii) and identify, by reading the symbols, which enzyme concentration produced the most decolourised solution.
Approach
Look down the right-hand column of the results table and pick the row whose symbol is closest to '+' (the no-colour end of the key). The corresponding concentration in the left-hand column is the answer.
Step-by-Step Reasoning
- The trend in (a)(ii) is that colour intensity falls as enzyme concentration rises (the enzyme breaks down the blue pigment in J).
- The lowest symbol in the table is therefore in the row for the highest enzyme concentration (2.0%).
- State this concentration clearly, with the matching symbol from the table to justify it.
Key Takeaways
- "Most effective" means the largest effect in the desired direction, not the largest absolute change.
- Always tie the answer back to a specific row of the data table — don't just guess the highest concentration.
Common Mistakes
- Stating the lowest concentration (0.125%) because it has the 'most colour' — this is the least effective, not the most.
- Forgetting to name the concentration; the mark scheme requires a concentration, not just a description.
Things to Be Careful About
- The mark scheme explicitly says the answer must match the candidate's own results in (a)(ii). If their results show an anomaly (e.g. a lower concentration that happened to look paler than 2.0%), the mark is awarded to the concentration that their table identifies as palest — not necessarily 2.0%.
Using your knowledge of enzymes, explain the trend in your results.
Answer
At a higher enzyme concentration, more enzyme–substrate complexes form per unit time, so the blue pigment in J is broken down faster and the colour is removed more effectively.
More enzyme–substrate complexes form at higher enzyme concentrations, so the colour is broken down faster.
Background Concept
Enzymes speed up reactions by binding their substrate at the active site to form an enzyme–substrate (ES) complex, which then converts the substrate to product and releases the enzyme unchanged. The rate of an enzyme-catalysed reaction therefore depends on how often ES complexes form. With substrate in excess (as here — the same of J is used in every tube), the rate is limited by the enzyme concentration: more enzyme molecules → more active sites available → more ES complexes per second → faster breakdown of the coloured pigment.
Understanding the Question
The trend in (a)(ii) is that colour intensity decreases as enzyme concentration increases. The candidate must give the biological reason for this trend, drawing on knowledge of how enzymes work.
Approach
State the link between enzyme concentration and reaction rate in terms of ES complexes. One short sentence is enough — the mark scheme rewards the complex-formation idea, not the length of the answer.
Step-by-Step Reasoning
- Identify the rate-limiting factor. Substrate (the blue pigment in J) is the same in every tube, so the only thing that changes is the number of enzyme molecules available.
- Apply the ES-complex model. More enzyme molecules → more active sites → more ES complexes form per second.
- Connect to the observation. More complexes per second → more substrate (blue pigment) broken down per second → paler solution at the end of the 10-minute incubation.
Key Takeaways
- With substrate in excess, enzyme concentration limits the rate of an enzyme-catalysed reaction.
- The molecular explanation is the formation of more enzyme–substrate complexes when more enzyme is present.
- This is a frequent Paper 3 follow-up to a colour-removal or colorimeter experiment; the same reasoning applies to any enzyme assay where the dependent variable measures the disappearance of substrate.
Common Mistakes
- Vague answers like "more enzyme is better" or "it works faster" — the mark scheme requires the ES-complex wording.
- Saying "more collisions" without mentioning the active site or ES complex — this is the wrong level of explanation for an enzyme context.
- Saying the substrate concentration is changing — it is the same of J in every tube, so substrate is not the variable.
Things to Be Careful About
- The mark scheme specifically says "more enzyme substrate complexes form at high concentration of enzyme". The word complexes (and the idea that they form faster / in greater numbers) is the marking point.
State one variable, other than temperature, that needs to be controlled in this investigation.
Answer
pH of the enzyme solution (and of the juice, J).
pH
Background Concept
A controlled variable is anything that could affect the dependent variable but is kept constant across all the experimental treatments, so that any change in the dependent variable can be attributed to the independent variable alone. In an enzyme investigation, the main factors that affect rate (and so the amount of colour removed) are temperature, pH, enzyme concentration, substrate concentration, and time.
Understanding the Question
The question explicitly rules out temperature, so the candidate must name one other factor from the list above that has been standardised in the procedure and would otherwise affect how much blue colour is broken down. pH is the canonical answer because the procedure does not mention a buffer and the enzyme's activity is pH-sensitive.
Approach
List the other variables that affect enzyme rate, then pick the one that is most obviously being held constant by the method. The same buffer (or the same unbuffered solution) is used in every tube, so pH is the same throughout.
Step-by-Step Reasoning
- Read the method: the same of J and of each enzyme dilution are used; incubation time is 10 min; temperature is held at .
- Variables still not explicitly controlled include pH, substrate concentration (in principle the same in every tube, but the dilution water could shift pH slightly), and time (10 min is the same for every tube).
- The most useful answer, and the one credited by the mark scheme, is pH, because enzyme activity is highly pH-sensitive and the candidate cannot be sure all dilutions have the same pH unless this is checked.
Key Takeaways
- For enzyme experiments, the standard controlled variables to mention are pH, substrate concentration, time, volume of reagents and source of enzyme.
- Always check the wording: "other than temperature" means pH, time or volume are all valid — but pH is the textbook answer.
- A controlled variable is one that is held constant by the method, not one that should be.
Common Mistakes
- Writing 'amount of enzyme' or 'concentration of enzyme' — these are the independent variable, not controlled variables.
- Writing 'colour' — colour is the dependent variable, not a controlled one.
- Writing vague answers like 'human error' or 'equipment' — these are not variables.
Things to Be Careful About
- The mark scheme accepts pH as the only credit-worthy answer here. Time, volume and substrate concentration are also held constant but pH is the one that the mark scheme expects, because the procedure does not explicitly mention a buffer.
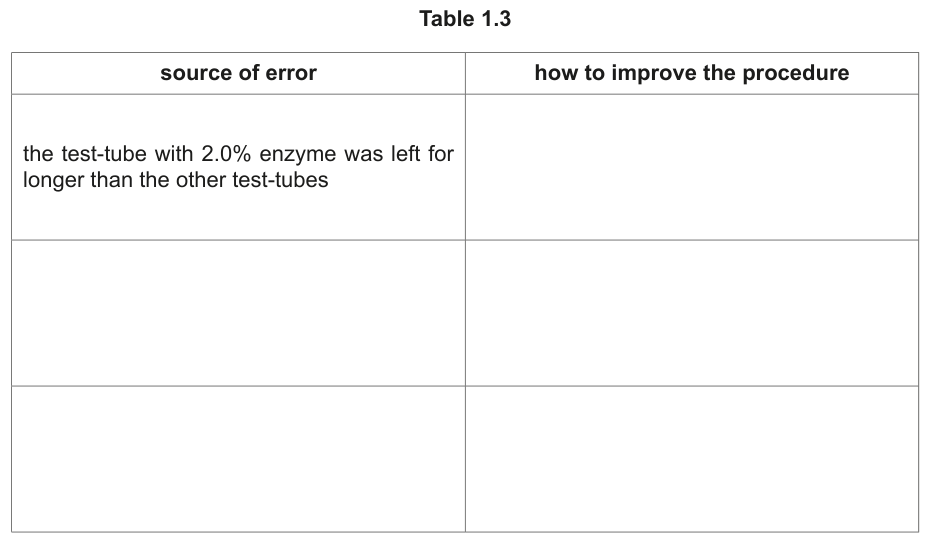
The procedure used in this investigation has several sources of error. Table 1.3 shows one of these sources of error.
Complete Table 1.3 by:
- stating two other sources of error
- describing an improvement to the procedure for each of the three sources of error.
Table 1.3
Answer
| source of error | how to improve the procedure |
|---|---|
| the test-tube with 2.0% enzyme was left for longer than the other test-tubes | add all of the enzyme solutions to the test-tubes at the same time (or carry out each test individually, starting the clock for each tube as the enzyme is added) |
| temperature of the water-bath was difficult to keep at | use a thermostatically controlled water-bath |
| the colour of the solutions was difficult to judge by eye | measure the colour (absorbance) using a colorimeter with a red filter |
(Alternative pairs accepted by the mark scheme: enzyme not equilibrated → equilibrate the enzyme in the water-bath before adding it; mixing of solutions different for each concentration → shake each tube for a set time.)
See table; any two of {temperature hard to control / enzyme not equilibrated / colour hard to judge / mixing differs} paired with three of {thermostatic water-bath / equilibrate enzyme / use a colorimeter / shake for a set time / carry out tests individually}.
Background Concept
A source of error is a step in the procedure that introduces variability or bias into the results, making the comparison between treatments unfair. Each error should be paired with a specific, practical improvement that removes or reduces it. Vague phrases like "human error" or "be more careful" do not score — the mark scheme wants the quantity affected and the concrete change to the method.
Understanding the Question
The candidate is given one source of error (the 2.0% tube was left for longer, so it had more time to react) and must add two more sources of error and three improvements. The improvements must each be tied to a specific source — they are not freestanding suggestions.
Approach
- Read the method carefully and identify any step where two tubes are not treated identically.
- For each, write a one-line source of error and a one-line specific improvement that fixes it.
- The mark scheme accepts four sources (temperature control, enzyme not equilibrated, colour difficult to judge, mixing differs) and five improvements (thermostatic water-bath, equilibrate enzyme, colorimeter, shake for a set time, carry out tests individually). Pick any consistent set.
Step-by-Step Reasoning
- Source 1 (given). Because the 2.0% tube was added first and then the others were started sequentially, the 2.0% tube was in the water-bath for longer than the others. The fair-test improvement is to add all enzyme solutions at the same moment (or to start timing each tube as the enzyme is added).
- Source 2. The water-bath is set up with hot and cold water, not a thermostat. Its temperature will drift during the 10-minute incubation. Improvement: use a thermostatically controlled water-bath at .
- Source 3. Judging colour intensity by eye against a five-symbol key is highly subjective — two candidates could legitimately record different symbols for the same tube. Improvement: use a colorimeter (with a red filter, since the solution is blue) to give an objective absorbance reading.
- (Alternative Source 4.) The enzyme solution is added at room temperature, not pre-warmed, so the early seconds of the reaction occur below . Improvement: equilibrate the enzyme in the water-bath for a few minutes before adding it to J.
- (Alternative Source 5.) "Shake gently to mix" is not standardised — each tube may be mixed differently. Improvement: shake each tube for a set time (e.g. 5 s) on a standard mixer.
Key Takeaways
- A good error/improvement pair names the variable that is affected and the practical change to the method.
- The improvement must fix the specific error: a colorimeter fixes a colour-judgement problem but not a temperature problem; a thermostatic bath fixes a temperature problem but not a colour-judgement problem.
- "Be more accurate" or "take more readings" never score — the mark scheme rejects vague answers.
Common Mistakes
- Writing "human error" as a source — the mark scheme rejects this.
- Listing an improvement without a matching error, or vice versa.
- Suggesting improvements that are not practical in a school lab (e.g. "use a spectrophotometer with a temperature-controlled cuvette holder" is too advanced; "use a colorimeter" is the accepted level).
- Pairing the wrong improvement with an error (e.g. "use a colorimeter" to fix the temperature drift).
Things to Be Careful About
- The given row already has its source of error filled in; the candidate must supply a matching improvement in the same row.
- Two further sources + three improvements are required. One of the improvements will be paired with the given source (the 2.0%-tube-left-longer error), and the other two improvements are paired with the two new sources.
- A common valid pairing is: given source → "carry out tests individually"; temperature drift → "thermostatic water-bath"; colour judgement → "colorimeter".
Grapes are a type of fruit that can be eaten freshly picked or dried.
Table 1.4 shows the sugar content of fresh grapes and dried grapes.
Table 1.4
| type of sugar | sugar content / per of grapes (fresh) | sugar content / per of grapes (dried) |
|---|---|---|
| glucose | 6.5 | 27.0 |
| fructose | 7.5 | 29.5 |
| sucrose | 0.5 | 1.0 |
Plot a bar chart of the data in Table 1.4 on the grid in Fig. 1.2.
Use a sharp pencil for drawing graphs.
Answer
A grouped (clustered) bar chart of the data in Table 1.4, plotted on the grid in Fig. 1.2.
Axes
- -axis: type of sugar with three categories — glucose, fructose, sucrose. Each category has two adjacent bars: fresh (one shade) and dried (another shade), labelled in the key.
- -axis: sugar content / g per of grapes, with a linear scale from to , labelled every (i.e. per on the grid).
Bars (in order along the -axis, each height in g per )
| sugar | fresh | dried |
|---|---|---|
| glucose | ||
| fructose | ||
| sucrose |
Conventions
- Bars are drawn with ruled vertical and horizontal lines that meet precisely at right angles.
- All bars have the same width, and the gap between the two bars in a pair is the same as the gap between pairs.
- The -axis scale uses at least half the grid in the vertical direction.
See bar chart: grouped bars of fresh vs dried for each sugar (glucose, fructose, sucrose), with y-axis 'sugar content / g per 100 g of grapes' on a scale of 5 g per 2 cm.
Background Concept
A bar chart is used for discrete categorical data on the -axis. When two conditions (here, fresh vs dried) are to be compared for each category, a grouped (clustered) bar chart is drawn: each category on the -axis has two (or more) bars side by side, distinguished by shading or pattern and identified in a key. The -axis is a continuous linear scale carrying a quantity and unit in the heading.
Understanding the Question
The candidate is given the sugar content of fresh and dried grapes for three sugars (glucose, fructose, sucrose) and must plot all six values on the grid in Fig. 1.2. Marks are awarded for the axes, the scale, the accuracy of the six bars and the cleanliness of the lines.
Approach
- Choose the orientation. Three categories on the -axis, sugar content on the -axis. This is the conventional layout for a bar chart with more than two bars per category.
- Set the scale. The largest value is 29.5 g. A scale of per gives a -axis that goes up to 30 g in 12 cm — comfortably fitting on the grid and using well over half of it. The mark scheme requires the scale to be labelled at least every 2 cm, so labels at 0, 5, 10, 15, 20, 25, 30 are needed.
- Plot the bars. Each of the six values is read off the -axis and the corresponding bar is drawn with vertical and horizontal lines meeting at right angles.
- Check the conventions. Even bar widths, even gaps, ruled lines, no shading inside the bars (a key distinguishes fresh and dried), no units on individual bars (the unit is in the -axis heading).
Step-by-Step Reasoning
- -axis label. "Type of sugar". The three categories are written below the appropriate groups of bars.
- -axis label. "Sugar content / g per of grapes". The slash means "in units of"; the unit is in the heading, not on the numbers.
- Scale. at the origin, then — i.e. per , with a label at every major gridline. The scale uses of the available , well over the "half the grid" requirement.
- Bar heights. From Table 1.4: glucose fresh , glucose dried , fructose fresh , fructose dried , sucrose fresh , sucrose dried . Read each off the -axis and draw a bar of the corresponding height.
- Bar width. All six bars the same width, drawn with a sharp pencil and a ruler.
- Key. A small key inside the plot area identifies which shade is fresh and which is dried.
Key Takeaways
- Bar chart -axis = category, -axis = continuous quantity.
- Always put the unit in the axis label (e.g. "sugar content / g per of grapes"), not next to the numbers.
- A scale that fills at least half the grid and uses "easy" intervals (1, 2, 5, 10) is required.
- Bars are drawn with a ruler (paper 3 explicitly requires this), and lines must meet precisely.
- A grouped bar chart (two bars per category) needs a key to identify the groupings.
Common Mistakes
- Plotting two separate bar charts (one for fresh, one for dried) instead of a grouped chart.
- Labelling the -axis as just "sugar content" without the unit.
- Using a scale that is too cramped (e.g. 0–60 in 5 g steps would only fill a quarter of the grid) or that starts above zero.
- Drawing bars with non-uniform widths or with wobbly/non-ruled edges.
- Misreading 29.5 as 30 (the bar should stop halfway between the 25 and 30 gridlines, not at 30).
Things to Be Careful About
- The -axis must reach at least 30 (the highest value is 29.5).
- The mark scheme requires the bars to be drawn with a ruler — freehand bars lose the precision mark.
- Bars should be joined at the bottom (sit on the -axis), not floating.
- The candidate should use a sharp pencil; the rubric says so explicitly.
The concentration of all sugars in dried grapes is higher than in fresh grapes.
Calculate the percentage increase in the concentration of glucose in dried grapes.
Show your working.
answer = ______ %
Working
Answer
(percentage increase in glucose concentration from fresh to dried grapes).
315.4%
Background Concept
A percentage increase compares the change in a quantity to the original (starting) value, expressed as a percentage. The standard formula is
Always divide by the original value — the change relative to where you started — never by the new value or by the average.
Understanding the Question
The glucose concentration rises from per in fresh grapes to per in dried grapes. The candidate must express this change as a percentage of the original (fresh) value.
Approach
- Identify original and new: original = , new = .
- Calculate the absolute change: .
- Divide by the original and multiply by to express as a percentage.
- Quote the answer to a sensible number of significant figures (here, , matching the precision of the data).
Step-by-Step Reasoning
- Step 1 — subtract: per . (Both values are quoted to , so the difference is also to .)
- Step 2 — divide by the original:
- Step 3 — multiply by : .
- Step 4 — round: to , the answer is .
Key Takeaways
- Percentage increase uses the original value as the denominator.
- Show all three steps (subtraction, division, multiplication by 100) to earn the working mark.
- The mark scheme accepts answers in the range to ; the most accurate is .
Common Mistakes
- Dividing by the new value (27.0) instead of the original (6.5) — this gives ~76%, which is the percentage decrease from dried to fresh, not the increase from fresh to dried.
- Forgetting to multiply by 100, so writing the answer as 3.154.
- Subtracting in the wrong order (6.5 − 27.0 = −20.5), which would give a negative percentage.
- Quoting too few significant figures (e.g. "300%") — the rubric expects at least .
Things to Be Careful About
- The two glucose values are quoted to , so the answer should be quoted to too.
- The answer is a percentage, so it must carry the % sign (or be clearly labelled as a percentage).
- Showing the working earns the first mark; the correct numerical answer earns the second.
Suggest why the glucose concentration is higher in the dried grapes than in the fresh grapes.
Answer
Drying removes water from the grapes, so the same amount of sugar is present in a smaller mass of grape — the sugar concentration per is therefore higher.
Dried grapes contain less water (water has been lost on drying), so the sugar is more concentrated per unit mass.
Background Concept
Concentration per unit mass (here, g of sugar per of grape) increases when the total mass of the sample falls but the mass of the solute (sugar) does not. Drying fruit removes water by evaporation: the sugars themselves are not lost (or are lost only in tiny amounts through caramelisation), but the water content drops dramatically. The same amount of sugar is therefore packed into a smaller total mass, and the concentration per rises.
Understanding the Question
The data in Table 1.4 show that the glucose concentration in dried grapes ( per ) is about four times that in fresh grapes ( per ). The candidate must give the biological reason.
Approach
Connect the change in concentration to a change in the solvent (water) rather than to any change in the solute (sugar). The fresh and dried grapes start with the same sugar molecules; the difference is how much water is left around them.
Step-by-Step Reasoning
- What is being dried? Grapes are water when fresh; drying removes most of this water by evaporation.
- What is not being removed? The sugars (glucose, fructose, sucrose) are non-volatile and remain inside the grape (a small amount may be lost through caramelisation, but this is negligible compared with the water loss).
- What is the effect on concentration? Because the same mass of sugar is now present in a smaller total mass of grape, the number of grams of sugar per of grape rises — exactly the rise seen in the table.
- State the reason concisely. "Dried grapes contain less water" is the credit-worthy point.
Key Takeaways
- A concentration is a ratio of solute to (solute + solvent). If the solvent falls and the solute stays the same, the concentration rises.
- Drying is a physical process that selectively removes water; it does not make more sugar.
- This same logic explains why dried fruits, dried mushrooms and evaporated milk are all "more concentrated" than their fresh counterparts.
Common Mistakes
- Saying "dried grapes have more sugar" — the absolute amount of sugar is roughly unchanged; what has changed is the water.
- Saying "dried grapes are smaller" or "dried grapes weigh less" without specifying that the sugar mass is unchanged while the water mass is reduced.
- Vague answers like "the sugar is more concentrated because the grapes are dried" — circular, no mechanism.
Things to Be Careful About
- The mark scheme accepts "dried grapes have less water" as the credit-worthy answer. Any equivalent wording (e.g. "water has been lost", "less water content") scores.
- Do not say the sugar has increased — the absolute amount of sugar is essentially unchanged; only the concentration per unit mass has changed.
The rest of this paper
1 more questions- Q2Use of the Light Microscope · Analysis, Conclusions and Evaluation17M