Biology 9700/31 — October/November 2021
Cambridge AS Level · Advanced Practical Skills · worked solutions for every part, with the mark scheme
Topics Manipulation, Measurement and Observation · Presentation of Data and Observations · Analysis, Conclusions and Evaluation · Use of the Light Microscope
The kidneys are the organs that remove waste products from the blood and produce urine.
Urine can be tested as part of a health check.
People who have kidney disease or a urinary tract infection (UTI) may have unusually high concentrations of protein in their urine.
You will be testing a solution that represents urine and will be referred to as ‘mock urine’. This represents a sample of urine from a patient with a possible kidney disease or urinary tract infection.
You will determine the concentration of protein in this sample of mock urine.
You are provided with the materials shown in Table 1.1.
Table 1.1
| labelled | contents | hazard | volume / |
|---|---|---|---|
| P | 1.0% protein solution | none | 30 |
| W | distilled water | none | 50 |
| C | 0.15% copper sulfate solution | none | 20 |
| K | 5.0% potassium hydroxide solution | harmful irritant | 20 |
| U | mock urine | none | 10 |
If any solution comes into contact with your skin, wash off immediately under cold water.
It is recommended that you wear suitable eye protection.
You will need to carry out a serial dilution of the 1.0% protein solution, P, to reduce the concentration by half between each successive dilution.
You will need to prepare four concentrations of protein solution in addition to the 1.0% protein solution, P.
After the serial dilution is completed, you will need to have of each concentration available to use.
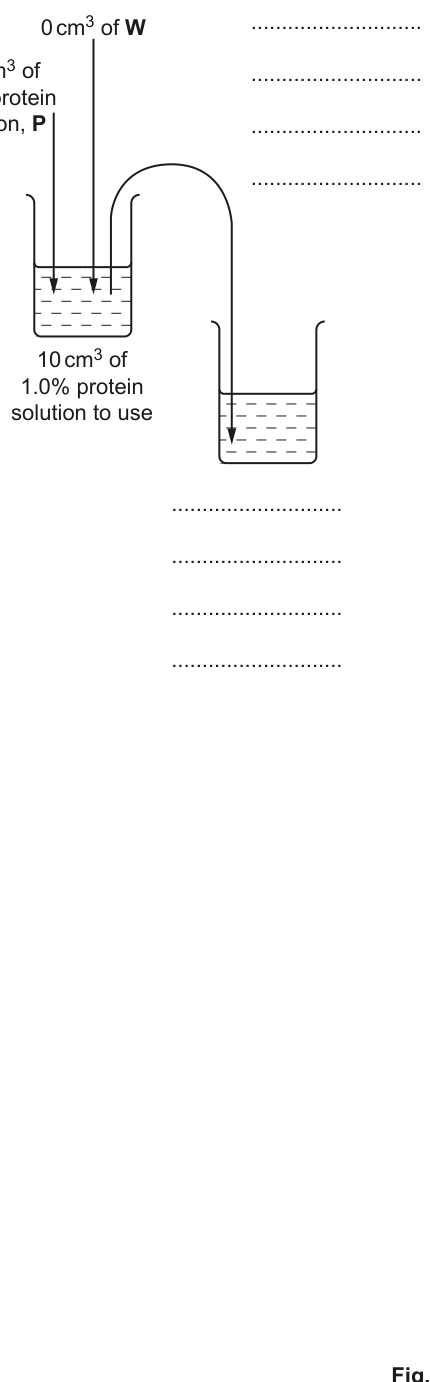
Complete Fig. 1.1 to show how you will prepare your serial dilution.
Fig. 1.1 shows the first two beakers you will use to make your serial dilution. You will need to draw three additional beakers.
For each beaker add labelled arrows to show:
- the volume of protein solution transferred
- the volume of distilled water, W, added.
Under each beaker, state the concentration of protein solution.
Answer
On Fig. 1.1, label Beaker 2 and add Beakers 3, 4 and 5. For every beaker draw an arrow into it labelled with the volume transferred from the previous beaker, an arrow into it labelled with the volume of W added, and an arrow leaving it labelled 'to use'. Write the concentration of the resulting solution under each beaker (include the % sign).
| beaker | volume transferred in (and concentration) | volume of W added | concentration |
|---|---|---|---|
| 1 (given) | — | 1.0% | |
| 2 | of 1.0% P | 0.5% | |
| 3 | of 0.5% P | 0.25% | |
| 4 | of 0.25% P | 0.125% | |
| 5 | of 0.125% P | 0.0625% |
Add a 'to use' arrow on every beaker (including Beaker 5): 10 cm³ of that concentration to use.
Beakers 2–5 contain 0.5%, 0.25%, 0.125% and 0.0625% respectively, each made by transferring 10 cm³ from the previous beaker and adding 10 cm³ of W.
Background Concept
A serial dilution is a stepwise dilution in which the same dilution factor is applied at each step. A 1:1 (halving) serial dilution gives a concentration that is the starting concentration divided by after steps. To keep the dilution running, the volume transferred into each new beaker must equal the volume of diluent added, so that the total in each beaker is constant and a known sub-volume can be carried forward to the next step.
Understanding the Question
Fig. 1.1 shows Beaker 1 (already containing of 1.0% P and of W, with an arrow showing '10 cm³ to use') and an empty Beaker 2 receiving a curved transfer arrow from Beaker 1. You must label Beaker 2 with the transferred volume, the volume of W added and the resulting concentration, then draw three more beakers (3, 4 and 5) to take the dilution through four halving steps. Each finished beaker must provide for the test.
Approach
Apply the halving rule: each beaker receives of the previous concentration plus of W, giving total at half the previous concentration. After mixing, is taken 'to use' and is carried forward to the next beaker.
The concentrations therefore follow:
Step-by-Step Reasoning
- Beaker 1 is the starting solution of 1.0% P. A 'to use' arrow is already drawn.
- Beaker 2: take from Beaker 1, add of W. Total . Concentration halves: . Take to use and forwards.
- Beaker 3: . Same pattern of arrows.
- Beaker 4: .
- Beaker 5: .
Each new beaker therefore needs the same three arrows: transferred in (with the relevant concentration), of W added, and taken to use. The concentration under each beaker must include the % sign.
Key Takeaways
- In a halving serial dilution the concentration after steps = starting concentration .
- Keep the volume transferred equal to the volume of diluent added so that both a sample AND a forward-transfer volume are available at every step.
Common Mistakes
- Forgetting to halve each time (writing 0.5%, 0.4%, 0.3%, 0.2% is not a true serial dilution).
- Labelling only the concentration and not the transferred volume / water volume.
- Drawing the 'to use' arrow only on Beaker 1 — every beaker must carry one because each concentration is tested later.
Things to Be Careful About
- Mix thoroughly with a glass rod between transfers so that carry-over of the wrong concentration does not occur.
- The % sign on every concentration is required by the mark scheme.
Carry out step 1 to step 9.
- Prepare the concentrations of protein solution, as decided in (a)(i), in the beakers provided.
Use a glass rod to mix the protein solutions. - Label five of the test-tubes with the concentrations you prepared in step 1.
- Put of each concentration of protein solution into the appropriately labelled test-tube.
- Label another test-tube 0.0% and put of distilled water, W, into this test-tube.
- Put of K into each of the labelled test-tubes. Shake gently to mix.
- Put of C into each of the labelled test-tubes. Shake gently to mix.
- Leave the test-tubes for 1 minute. Shake gently to mix.
- Observe the colour of the liquid in each test-tube.
To see the colour more clearly, it may help to hold a piece of white paper behind the test-tube.
You may see the same colour in more than one test-tube. - Record your results in (a)(ii) using the symbols shown in Table 1.2.
Table 1.2
| colour | symbol |
|---|---|
| dark purple | ++++++ |
| purple | +++++ |
| pale purple | ++++ |
| blue | +++ |
| very pale blue/purple | ++ |
| no colour | + |
Record your results in an appropriate table.
You may use the same symbols for more than one test-tube.
Answer
Construct a results table with the independent variable (percentage protein concentration) in the first column and the dependent variable (symbol for colour) in the second column. One row per concentration tested, including the 0.0% distilled-water control. Use the symbols from Table 1.2.
| percentage protein concentration / % | symbol for colour |
|---|---|
| 0.000 | + |
| 0.0625 | ++ |
| 0.125 | +++ |
| 0.25 | ++++ |
| 0.5 | +++++ |
| 1.0 | ++++++ |
(Representative example: colour deepens with protein concentration because more peptide bonds reduce more Cu²⁺ to Cu⁺. The actual symbol in each cell is whatever the student observes in their own experiment.)
Table with column 1 heading 'percentage protein concentration / %' and column 2 heading 'symbol for colour', with one row per concentration including 0.0%, results recorded using the symbols from Table 1.2.
Background Concept
The Biuret test detects peptide bonds. Copper(II) sulfate in alkaline solution (provided here as C + K) forms a violet/purple complex with peptide bonds; the more peptide bonds, the deeper the colour. A 0.0% control gives a pale blue colour from the Cu²⁺ ions alone (no peptide bonds present).
Understanding the Question
You have added KOH and CuSO₄ to each standard, mixed, left for 1 minute and observed the colour against a white background. You must record the colour observed in each tube using the symbols given in Table 1.2.
Approach
- Make a proper results table — the mark scheme requires column headings for both the independent variable (protein concentration, with units) and the dependent variable (symbol).
- Order the rows from lowest to highest concentration so the colour trend is visible.
- Match each observation to one of the symbols from Table 1.2; the same symbol can appear in more than one row.
Step-by-Step Reasoning
- Independent variable heading: 'percentage protein concentration / %'. Do not abbreviate to '% protein' or 'conc' — the / % unit is required.
- Dependent variable heading: 'symbol for colour' or simply 'symbol'.
- Six rows: 0.0% (distilled water control), 0.0625%, 0.125%, 0.25%, 0.5%, 1.0%.
- Expected trend: blue at 0.0% (no peptide bonds) → deepening purple as peptide bond concentration rises. Representative symbols are + through ++++++ as shown in the table.
Key Takeaways
- Biuret is qualitative — results are recorded as colour descriptions or a coded scale, not as numerical absorbances.
- Always include a 0.0% control so the negative result is recorded.
- Use a white background to judge subtle differences reliably.
Common Mistakes
- Missing units from the concentration heading (must include / %).
- Putting the rows in random order so the trend is hidden.
- Writing 'colour' instead of the agreed symbol (the mark scheme expects symbols from Table 1.2).
Things to Be Careful About
- A gentle shake between additions ensures Cu(OH)₂ is fully dispersed and reacts uniformly.
- Read the colour after the full 1-minute wait — colours deepen as the reaction proceeds.
State the independent variable in the investigation you have just carried out.
Answer
The independent variable is the concentration of protein — the quantity that is deliberately changed between tubes in this investigation.
concentration of protein
Background Concept
The independent variable is what the experimenter deliberately changes; everything else is held constant. The dependent variable is what is measured as a result.
Understanding the Question
The question simply asks what is being varied across the six tubes in the investigation just carried out.
Approach
Scan the method: volumes (), reagents (K then C), and timing (1 min) are identical for every tube. The only quantity that differs is the protein concentration of the standard added, so that is the independent variable.
Step-by-Step Reasoning
- Independent variable → what is changed → protein concentration (0.0% to 1.0%).
- Dependent variable → what is measured → colour produced (recorded as a symbol from Table 1.2).
- Controlled variables → volume, same reagents, same mixing, same 1-minute wait.
Key Takeaways
- Identifying variables is the first step before drawing any conclusion.
- The independent variable goes on the x-axis if a graph is drawn; the dependent goes on the y-axis.
Common Mistakes
- Saying 'volume' — volume is kept constant.
- Saying 'colour' — colour is the dependent variable, not the independent.
Things to Be Careful About
- State the variable in biological terms ('protein concentration'), not in technique terms ('amount of P added').
You are provided with a sample of mock urine, U. This represents a sample of urine from a patient being tested for possible kidney disease.
- Label a test-tube, U.
- Put of U into the test-tube.
- Repeat step 5 to step 8 for U. Record your result for U in (a)(iv) using the symbols shown in Table 1.2.
Record your result for U.
result for U = ______
Answer
Repeat steps 5–8 with the unknown U and record the colour produced using one of the symbols from Table 1.2.
result for U = ++++ (representative example: pale purple. The actual symbol depends on what the student observes in their own experiment.)
++++ (representative — must be one of the symbols from Table 1.2)
Background Concept
The same Biuret reaction is applied to the unknown sample. The colour obtained is matched to the colour of the standards prepared in (a)(ii) to estimate the protein concentration of U.
Understanding the Question
You test the mock urine U exactly as you tested the standards and write the symbol that best matches the colour observed.
Approach
- Add of K, then of C, to the tube labelled U.
- Mix gently, leave 1 min, then hold against a white background.
- Choose one symbol from Table 1.2 that best matches the colour.
Step-by-Step Reasoning
- 'No condition' samples give + (no colour change).
- A very pale result would be ++.
- A clear blue/purple = +++.
- A pale purple = ++++.
- A definite purple = +++++.
- A dark purple = ++++++.
The representative example ++++ is between the standards 0.125% (+++) and 0.5% (+++++), indicating an intermediate protein concentration.
Key Takeaways
- The same symbol scale is used for both standards and unknowns so that they can be compared directly.
Common Mistakes
- Writing a colour description rather than a symbol.
- Using a symbol not in Table 1.2.
Things to Be Careful About
- Mix gently so the Cu(OH)₂ does not form clumps that give a misleadingly dark patch.
- Read the colour after exactly the same 1-minute wait used for the standards.
Fig. 1.2 shows a scale of protein concentrations used in this investigation. The position for 1.0% and 0.0% are shown on the scale.
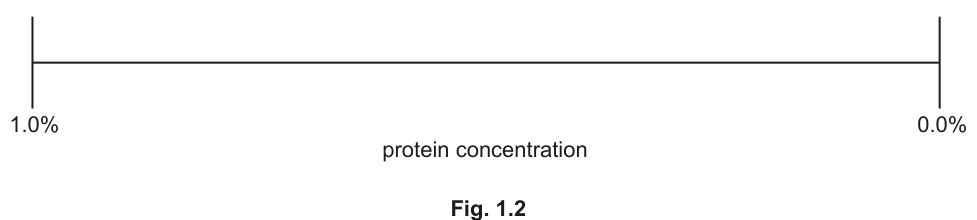
Complete the scale in Fig. 1.2 by showing the positions of the protein concentrations you prepared in step 1.
Answer
The 1.0% end is on the left, the 0.0% end on the right, so concentration decreases from left to right. Because each step halves the concentration, on a linear distance scale each tick mark lies a fixed fraction of the remaining distance from the 0.0% end, not a fixed amount.
Positions to mark (with short vertical tick marks drawn with a ruler and a label below each):
Tick marks at 0.5%, 0.25%, 0.125% and 0.0625% placed at 1/2, 3/4, 7/8 and 15/16 of the scale from the 1.0% end.
Background Concept
A halving serial dilution is geometric, not linear, in concentration: each step multiplies the remaining concentration by 1/2. On a linear distance scale the tick marks therefore bunch up towards the 0.0% end, each one halving the previous distance from 0.0%.
Understanding the Question
Fig. 1.2 shows a straight line with 1.0% at the left and 0.0% at the right. You must mark on it the four intermediate concentrations used in the dilution (0.5%, 0.25%, 0.125%, 0.0625%).
Approach
For a halving series on a linear scale, the distance from the 1.0% end is given by
where is the number of dilutions from 1.0%:
- → position (0.5%)
- → position (0.25%)
- → position (0.125%)
- → position (0.0625%)
Step-by-Step Reasoning
- Place a short vertical tick at the midpoint of the line, label 0.5%.
- Place the next tick three-quarters of the way along, label 0.25%.
- Place the next tick seven-eighths of the way along, label 0.125%.
- Place the final tick fifteen-sixteenths of the way along, very close to the 0.0% end, label 0.0625%.
Key Takeaways
- Serial dilution scales are geometric: each mark halves the previous distance from the 0.0% end.
Common Mistakes
- Spacing the tick marks equally (linear) instead of geometrically — this is wrong because each step halves concentration, not subtracts a fixed amount.
Things to Be Careful About
- Label each tick with both the number and the % sign.
- Draw the ticks with a ruler so they are clear and uniform.
Use your results in (a)(ii) and (a)(iv) to estimate the protein concentration of U.
Show your estimate of U on Fig. 1.2 by drawing an arrow () at the correct position on the scale. Label the arrow U.
Answer
Using the representative example from (a)(iv) (U = ++++, pale purple): match this colour to the colour of the 0.25% standard on the scale completed in (a)(v) and draw a short downward arrow ↓ on the scale at the 0.25% position, labelled U underneath.
Arrow ↓ at the position matching the colour symbol recorded for U (representative: 0.25%), labelled U.
Background Concept
The completed scale in Fig. 1.2 is effectively a colour key for the protein concentrations used. An unknown sample can be read off this scale by matching its Biuret colour to the closest standard colour on the scale.
Understanding the Question
You must use the colour symbol recorded for U in (a)(iv) and place an arrow on the scale at the position corresponding to that colour intensity.
Approach
- Locate the symbol recorded for U in (a)(iv).
- Find the position on the Fig. 1.2 scale that corresponds to that symbol (using the colour order already established when filling in the standards in (a)(ii)).
- Draw a short downward arrow ↓ at that position and label it U underneath.
Step-by-Step Reasoning
For the representative example:
- U = ++++ (pale purple) matches the colour of the 0.25% standard.
- The 0.25% position is already marked on the scale at the three-quarters point.
- Place the arrow ↓ directly above the 0.25% tick.
If the student had recorded U = +++ (blue), the arrow would go at the 0.125% position; for U = +++++ (purple) it would go at 0.5%; and so on.
Key Takeaways
- A standard colour scale lets you turn a colour observation into a numerical estimate of concentration.
Common Mistakes
- Drawing the arrow the wrong way (must be ↓, into the scale).
- Forgetting the U label underneath the arrow.
Things to Be Careful About
- The estimate is only as good as the matching between the unknown colour and the standard colours — small differences in shade can shift the position by one dilution step.
Table 1.3 shows the total mass of protein present in urine over 24 hours for people with different medical conditions.
Table 1.3
| medical condition | total mass of protein in urine / |
|---|---|
| no condition | <150 |
| urinary tract infection | 150–200 |
| kidney tubular disease | 200–500 |
| glomerular disease | >500 |
The 1.0% protein solution you used in (a)(i) represents a urine sample collected over a period of 24 hours that contains of protein.
State the possible medical condition of the patient indicated by U, using your result in (a)(vi).
Answer
The 1.0% standard represents per , so 0.1% is equivalent to .
For the representative example, the arrow in (a)(vi) is at 0.25%:
Looking up in Table 1.3, this falls in the range for kidney tubular disease.
Therefore the patient indicated by U has kidney tubular disease.
kidney tubular disease
Background Concept
Table 1.3 gives reference ranges for total urinary protein per 24 h for four clinical categories. The 1.0% protein solution represents per , so a concentration of corresponds to .
Understanding the Question
You must convert the % concentration estimated for U into a 24 h mass of protein using the 1.0% = reference, then state which clinical condition in Table 1.3 matches.
Approach
- Convert the % concentration of U to mg per 24 h by multiplying by 10 (because 1% = ).
- Locate the resulting value in the second column of Table 1.3.
- State the condition in the first column of the matching row.
Step-by-Step Reasoning
Conversion table:
| protein concentration / % | mass per 24 h / mg |
|---|---|
| 0.015 | 150 |
| 0.02 | 200 |
| 0.05 | 500 |
| 0.1 | 1000 |
For U at 0.25%:
This lies in the row 'kidney tubular disease (200–500 mg )'.
Key Takeaways
- A simple proportion () bridges the mock concentration and the clinical reference table.
Common Mistakes
- Forgetting to multiply by 10 and reporting the % as the mass.
- Reading off the wrong row of Table 1.3 — the boundaries 150, 200 and 500 are common trap points.
Things to Be Careful About
- The 1.0% = relationship is given in the question stem — make the conversion explicit, do not skip it.
Your result for U may be anomalous.
State how you could confirm that your result for U is correct.
Answer
Repeat the Biuret test on U at least three times and compare the symbols obtained. If the same symbol appears consistently the result is confirmed; if the results differ, take the most common (mode) symbol as the best estimate.
Repeat the test for U at least 3 times.
Background Concept
Repeating a measurement and looking for agreement is the simplest way to assess whether an observation is reliable. A single colour match against a scale is subjective and easily influenced by lighting, viewing angle and reagent ageing.
Understanding the Question
You are told your single result for U may be anomalous and you must say how to check it.
Approach
Apply the principle of replication: carry out the same procedure on more than one sample of U and check whether the same symbol is obtained.
Step-by-Step Reasoning
- Take a fresh portion of U and repeat steps 5–8.
- Carry out at least three repeats in total (three independently mixed tubes).
- If all three (or the majority) give the same symbol, the original result is confirmed.
- If they differ, the most likely symbol is the mode of the results, and you would mark the estimate as 'not reliable'.
Key Takeaways
- Replication distinguishes a one-off error from the true value.
Common Mistakes
- Saying 'repeat it once more' — one repeat is not enough to call a result reliable.
- Saying 'use a different method' — the question asks how to confirm this method's result, not to replace it.
Things to Be Careful About
- Each repeat should use a fresh, independently mixed tube so that an error in one tube does not propagate.
Glucose is another molecule that may be detected in urine during a health check.
A sample of urine from a patient tested positive for glucose.
Suggest how you would obtain an estimate of the concentration of glucose in the sample of urine.
Answer
The same logic used to estimate the protein concentration of U can be applied with Benedict's reagent to estimate the glucose concentration in a urine sample.
- Prepare at least three standard glucose solutions of known concentration (e.g. by a serial dilution of a stock glucose solution) covering the likely range.
- Add the same volume of Benedict's reagent to each standard, heat in a boiling water bath for about 2 minutes, and record the colour produced — using a coded scale (blue = no reducing sugar, green = trace, yellow = moderate, orange = high, brick-red = very high).
- Carry out Benedict's test on the unknown urine sample in exactly the same way, then match the colour obtained to the colour of the standard that it most closely resembles; the concentration of that standard is the estimate of the glucose concentration in the sample.
Use Benedict's test on at least three known glucose concentrations and on the sample, then compare the colour of the sample to the standard colour key.
Background Concept
Benedict's reagent detects reducing sugars such as glucose. Cu²⁺ is reduced to Cu⁺ which precipitates as red copper(I) oxide; the higher the concentration of reducing sugar, the greater the colour change from blue → green → yellow → orange → brick-red. The intensity of the colour can therefore be used semi-quantitatively by comparison with standard solutions of known concentration.
Understanding the Question
The previous parts used a Biuret standard scale to estimate the protein concentration of U. The question asks how to apply the same idea to estimate the concentration of glucose in a urine sample known to contain glucose.
Approach
- Prepare a series of glucose standards of known concentration.
- Treat the unknown sample in exactly the same way as the standards.
- Match the resulting colour to the closest standard and read off the concentration.
Step-by-Step Reasoning
- Standards: at least three known concentrations of glucose (the more standards, the finer the resolution). These could be prepared by serial dilution of a stock 1% glucose solution.
- Benedict's test on standards: add a fixed volume of Benedict's reagent to each standard, heat in a boiling water bath for ~2 min, allow to cool, and record the colour obtained against a white background.
- Benedict's test on the unknown: treat an identical volume of the patient's urine in the same way.
- Compare: visually match the colour of the unknown to the colour of the standard that most closely resembles it; report that standard's concentration as the estimate. A more rigorous version would measure absorbance in a colorimeter.
Key Takeaways
- Semi-quantitative tests work by comparing an unknown against a series of standards.
- The same logic (standards → unknown → match) applies regardless of which reagent is used.
Common Mistakes
- Saying 'use a glucose test strip and read the value' — this is a valid practical method but the mark scheme rewards the multi-standard comparison method that mirrors the protein estimation just done.
- Forgetting that Benedict's must be heated — many students omit the boiling step.
- Suggesting only one standard concentration — at least three are needed to span the likely range.
Things to Be Careful About
- Use the same volume of reagent, the same heating time and the same temperature for every tube so that any colour difference is due to glucose alone.
Escherichia coli bacteria were isolated from patients with a urinary tract infection. The bacteria were tested with six different antibiotics. The percentage of resistant bacteria was calculated for each antibiotic.
Table 1.4 shows the results.
Table 1.4
| antibiotic | percentage of resistant bacteria |
|---|---|
| ciprofloxacin (C) | 23.5 |
| co-trimoxazole (T) | 31.5 |
| imipenem (I) | 0.0 |
| nitrofurantoin (N) | 0.5 |
| ampicillin (A) | 59.0 |
| amoxicillin (M) | 2.0 |
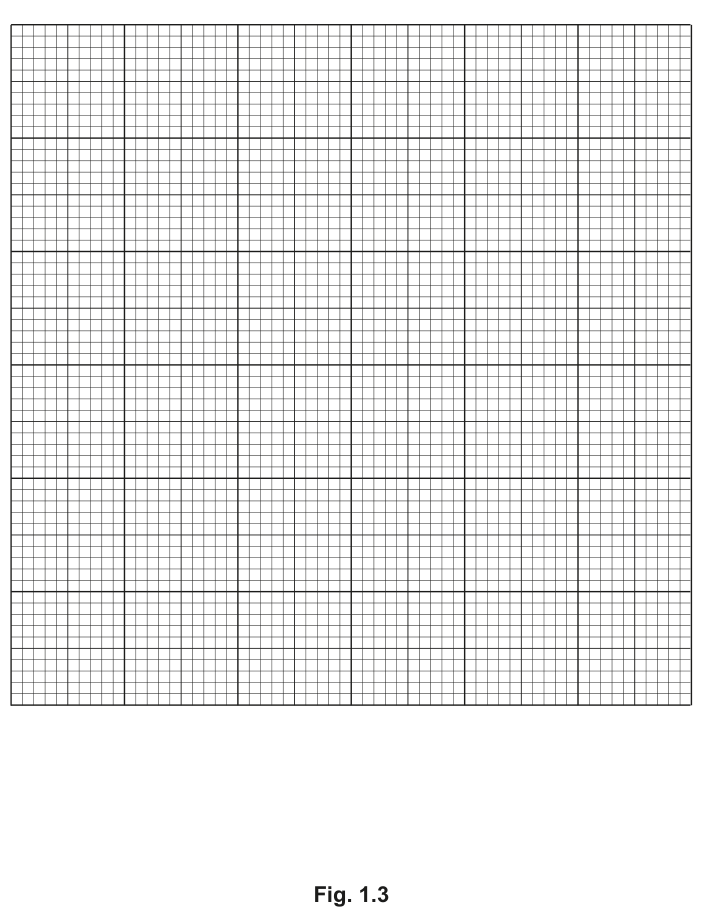
Plot a bar chart of the data in Table 1.4 on the grid in Fig. 1.3.
Use a sharp pencil for drawing bar charts.
Answer
On the grid in Fig. 1.3, draw a bar chart with:
- x-axis: 'antibiotic', labelled with the six antibiotics in the order listed in Table 1.4: ciprofloxacin (C), co-trimoxazole (T), imipenem (I), nitrofurantoin (N), ampicillin (A), amoxicillin (M). Bars of even width and evenly spaced.
- y-axis: 'percentage of resistant bacteria', scale starting at 0 with major gridlines at 10% intervals (10% = 2 cm, so 1% = 2 mm), labelled at least every 10% (0, 10, 20, 30, 40, 50, 60). The scale must use at least half the grid.
- Bars (drawn with a sharp pencil and ruler, vertical sides and a flat top, no shading):
| antibiotic | bar height / % | bar height / cm |
|---|---|---|
| ciprofloxacin (C) | 23.5 | 4.7 |
| co-trimoxazole (T) | 31.5 | 6.3 |
| imipenem (I) | 0.0 | 0.0 |
| nitrofurantoin (N) | 0.5 | 0.1 |
| ampicillin (A) | 59.0 | 11.8 |
| amoxicillin (M) | 2.0 | 0.4 |
Bar chart with six bars at 23.5, 31.5, 0.0, 0.5, 59.0 and 2.0 %.
Background Concept
A bar chart is used for discrete categorical data (different antibiotics, in this case) where the bars do not touch. The y-axis must start at zero, use a sensible scale that fills at least half the grid, and be labelled with the quantity and its units. The x-axis carries the categories; each bar has the same width with even gaps between bars.
Understanding the Question
Plot the data in Table 1.4 as a bar chart on the supplied grid.
Approach
- Decide the y-axis scale: the largest value is 59.0%, so a scale of 10% per 2 cm (i.e. 1% per 2 mm) reaches 60% at 12 cm — easily fitting on a 20 cm grid and using more than half of it.
- Order the antibiotics on the x-axis as listed in the table so the chart matches the data table.
- Draw each bar with a sharp pencil and ruler, using straight lines that meet cleanly.
Step-by-Step Reasoning
- Scale: 10% = 2 cm → 1% = 2 mm. The grid accommodates up to 100% — more than enough.
- Bar widths: divide the 16 cm plot width into 6 equal bar-and-gap units; bars of ~2 cm wide with ~0.7 cm gaps is typical.
- Bar heights:
- 23.5% → 4.7 cm
- 31.5% → 6.3 cm
- 0.0% → 0 cm (no bar visible, but still draw the axis line at 0)
- 0.5% → 0.1 cm (very thin sliver — still draw a hairline so the category is represented)
- 59.0% → 11.8 cm
- 2.0% → 0.4 cm
Key Takeaways
- Bar charts require evenly spaced bars of even width drawn with a ruler.
- The y-axis must start at 0 for fair visual comparison.
Common Mistakes
- Inverted axes (categories on y, percentage on x).
- Scale that is awkward (e.g. 1 cm = 7%) or that does not use at least half the grid.
- Bars not drawn with a ruler or with gaps that are not equal.
- Missing the 0.0% bar for imipenem — it is still a category and must be shown as a flat line at 0.
Things to Be Careful About
- Use a sharp pencil for the bar chart — the question reminds you to.
- Plotting bars accurately is what earns the plotting mark; rough freehand bars lose marks.
Ampicillin was first used in 1961 and imipenem was first used in 1985.
Suggest why the percentage of resistant bacteria is higher for ampicillin than imipenem.
Answer
- Ampicillin was first used in 1961 and imipenem not until 1985, so ampicillin has been in clinical use for ~24 years longer.
- Over that longer period there has been more time for random mutations to arise in E. coli that confer resistance to ampicillin, and for those resistant bacteria to be selected for (non-resistant cells are killed, leaving resistant ones to reproduce and pass the allele on).
- Imipenem is a newer antibiotic that has been used much less often, so E. coli populations have been exposed to it less and there has been less selection pressure for resistance to evolve.
Ampicillin has been used for longer, giving more time for resistance-conferring mutations to occur and be selected for; imipenem is newer and less used, so there has been less selection for resistance.
Background Concept
Antibiotic resistance evolves by natural selection. When a bacterial population is exposed to an antibiotic, susceptible cells die while any rare mutants that happen to carry a resistance allele survive and reproduce, passing the allele to their offspring. Over many generations the proportion of resistant cells in the population therefore rises. The longer a population is exposed, the more rounds of selection occur and the higher the resistance frequency becomes.
Understanding the Question
The data show that 59.0% of E. coli are resistant to ampicillin but only 0.0% to imipenem. Ampicillin was introduced in 1961; imipenem in 1985. Suggest why ampicillin resistance is higher.
Approach
- Connect the difference in deployment time (24 years) to the number of generations of selection that each antibiotic has exerted on E. coli populations.
- Mention mutation as the source of new resistance alleles.
- Mention selection pressure as the mechanism that increases their frequency.
Step-by-Step Reasoning
- Time: ampicillin has had ~24 more years of use. Bacterial generations are short (minutes to hours), so 24 years represents an enormous number of cell divisions and opportunities for new mutations to arise.
- Mutation: random mutations in genes encoding penicillin-binding proteins, β-lactamases or porins can confer ampicillin resistance; the longer the period of use, the more likely such a mutation has occurred and spread.
- Selection: each time ampicillin is used, susceptible E. coli are killed; resistant mutants survive and reproduce, so their proportion in the population increases over time.
- Imipenem: introduced much later and used less widely, so selection pressure has been lower and there has been less time for resistance mutations to arise and spread.
Key Takeaways
- Antibiotic resistance is an evolutionary process driven by mutation and selection.
- The longer an antibiotic has been in widespread use, the higher the typical resistance frequency.
Common Mistakes
- Saying 'bacteria become resistant because they get used to the drug' — this is the lay misconception and earns no credit.
- Failing to mention mutation; without it there is no source of new resistance alleles.
- Failing to mention selection; without it the alleles would not increase in frequency.
Things to Be Careful About
- The question is about E. coli isolated from patients with UTIs specifically — these bacteria have been exposed to ampicillin in real clinical practice for decades, providing the selection pressure.
The rest of this paper
1 more questions- Q2Use of the Light Microscope17M