Biology 9700/31 — May/June 2021
Cambridge AS Level · worked solutions for every part, with the mark scheme
Topics Manipulation, Measurement and Observation · Presentation of Data and Observations · Analysis, Conclusions and Evaluation · Use of the Light Microscope
Plant cells contain the enzyme catalase which catalyses the breakdown of hydrogen peroxide, releasing oxygen.
When hydrogen peroxide solution and a sample of potato tissue are put into a syringe, some of the solution comes out of the syringe nozzle as the oxygen is released.
You are going to investigate the effect of surface area of potato tissue on the activity of catalase.
You are provided with the materials shown in Table 1.1 and Table 1.2.
Table 1.1
| labelled | contents | hazard | |
|---|---|---|---|
| H | hydrogen peroxide solution | irritant | 40 |
Table 1.2
| labelled | material | details | quantity |
|---|---|---|---|
| P | potato cylinders | same diameter | 4 |
If any of H comes into contact with your skin, wash off immediately with cold water.
It is recommended that you wear suitable eye protection.
Wear gloves to protect your hands when using H.
- Cut the potato cylinders in the beaker labelled P to a length of . Put the cylinders back into the beaker labelled P.
To investigate the effect of surface area, you will cut the cylinders into a different number of pieces as shown in Table 1.3.
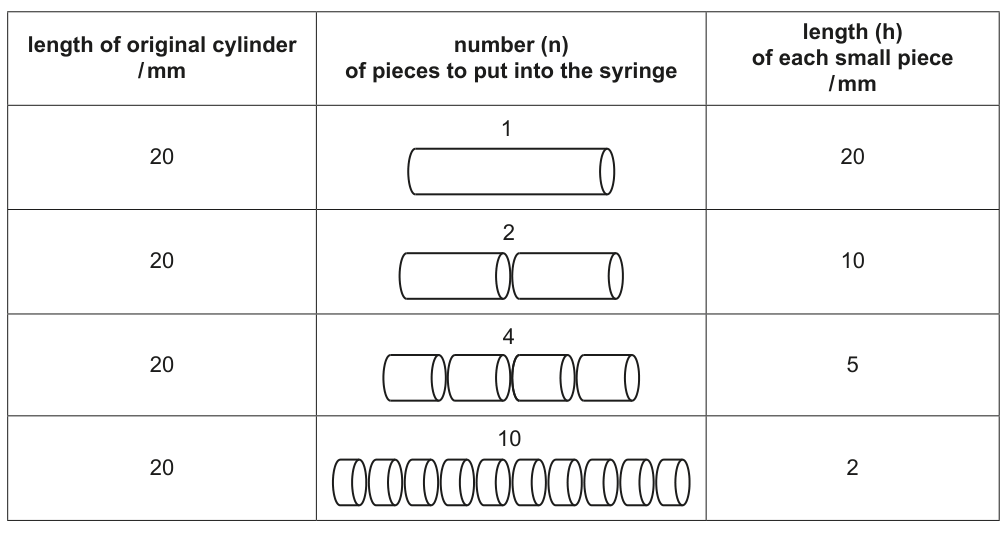
You now need to calculate the total surface area of the potato tissue that will be put into the syringe. An example of how to do this is shown in Fig. 1.1 on page 4.
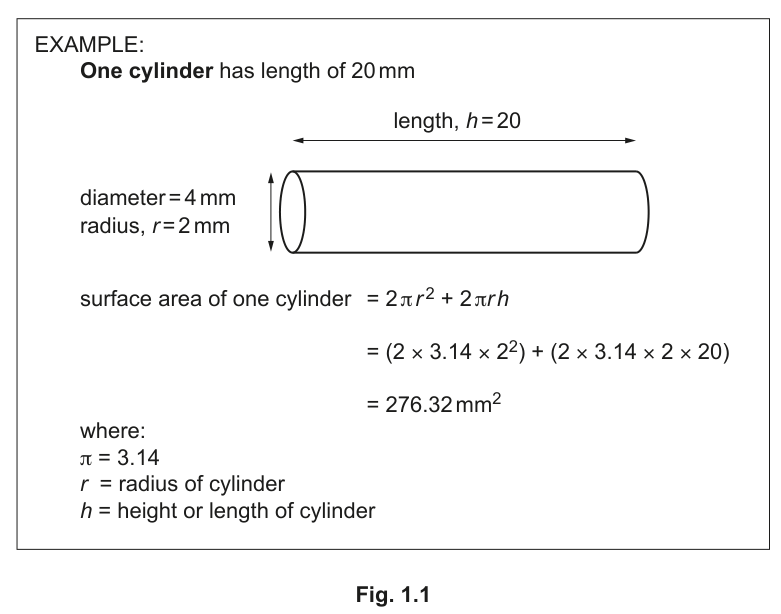
The total surface area depends on the number of pieces, .
Measure the diameter of one of the cylinders and calculate the radius, .
= ______
All of the cylinders have the same diameter (standardised).
State one other variable that should be standardised in this investigation.
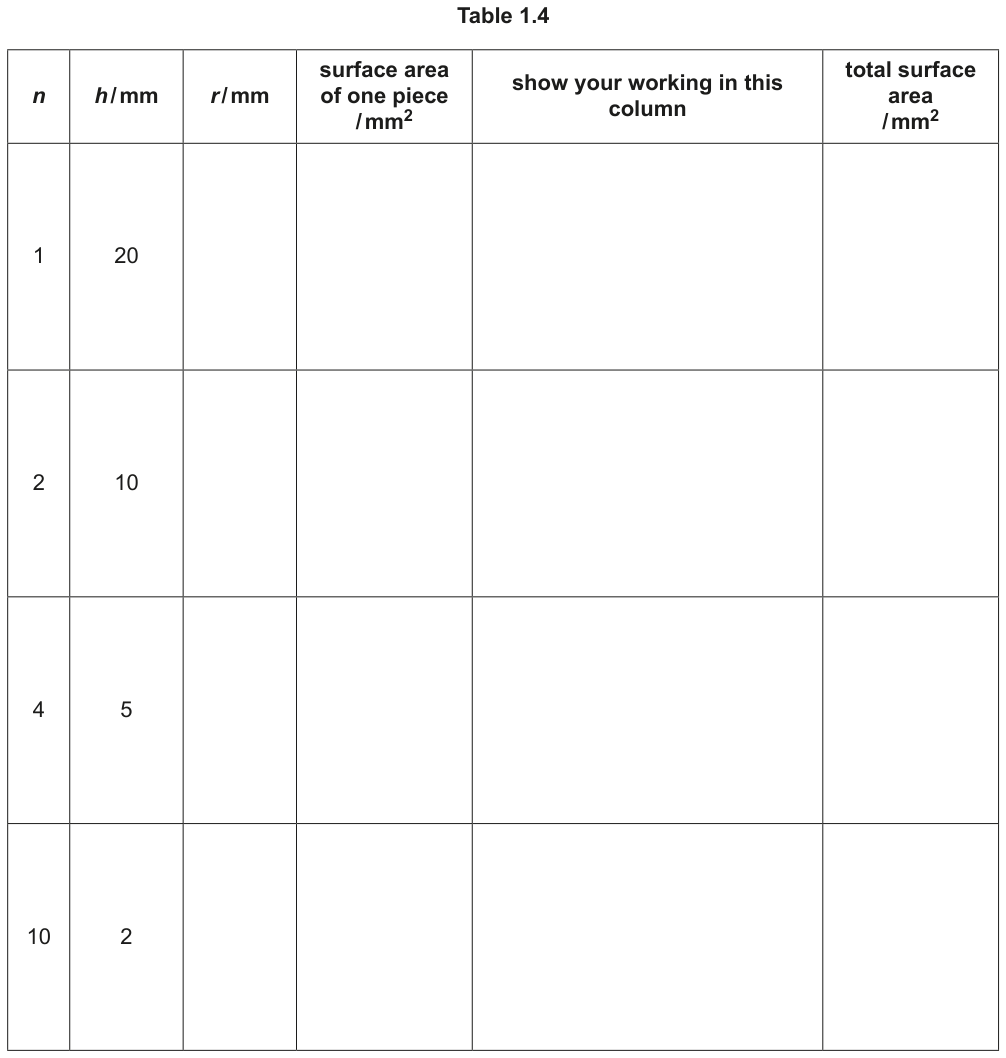
Complete Table 1.4 to calculate the total surface area of potato tissue to put in the syringe.
Show your working in the space provided in Table 1.4.
Carry out step 2 to step 22.
- Remove the plunger from a syringe.
- Put one potato cylinder into the barrel of the syringe.
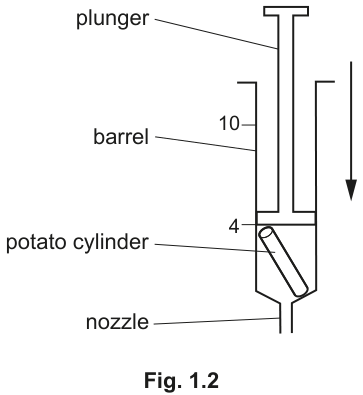
- Put the plunger back into the syringe and push it to the mark, as shown in Fig. 1.2.
- Put the nozzle of the syringe into the beaker containing H.
- Pull the plunger out to the mark so that H enters the syringe, as shown in Fig. 1.3.
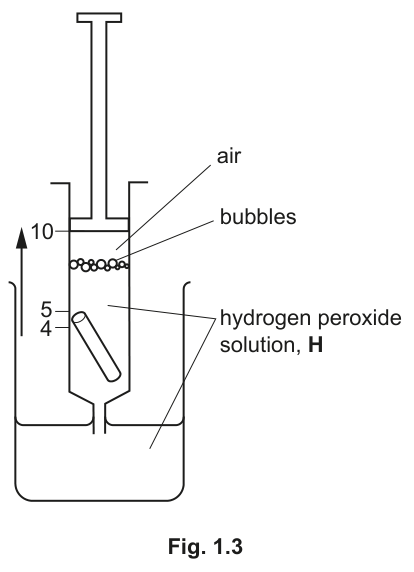
- Hold the syringe above the beaker labelled For waste. Push the plunger so that the level of H is at the mark, as shown in Fig. 1.4.
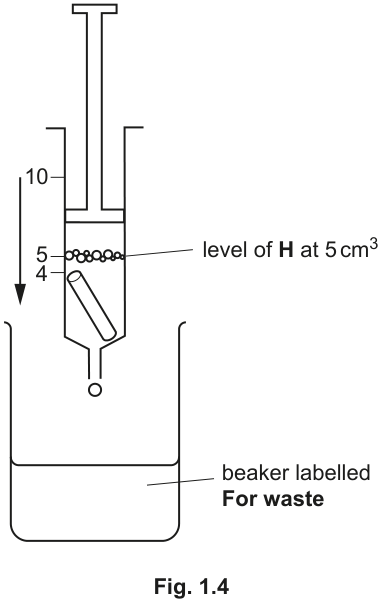
- Wipe the nozzle with a paper towel to remove excess H.
- Hold the syringe above the beaker labelled For waste. Start timing.
Count the number of drops released in 1 minute. Record the results in (a)(iv).
10. Put the syringe into the beaker labelled B.
11. Cut a cylinder from step 1 into two pieces. Each piece should be in length, as shown in Table 1.3 and Table 1.4.
12. Remove the plunger from an empty syringe.
13. Put the two pieces from step 11 into the barrel of the syringe.
14. Repeat step 4 to step 10.
15. Cut a cylinder from step 1 into four pieces. Each piece should be in length, as shown in Table 1.3 and Table 1.4.
16. Remove the plunger from an empty syringe.
17. Put the four pieces from step 15 into the barrel of the syringe.
18. Repeat step 4 to step 10.
19. Cut a cylinder from step 1 into 10 pieces. Each piece should be in length, as shown in Table 1.3 and Table 1.4.
20. Remove the plunger from an empty syringe.
21. Put the ten pieces from step 19 into the barrel of the syringe.
22. Repeat step 4 to step 10.
Record your results in an appropriate table.
State the independent variable.
Suggest an appropriate control for this investigation.
Identify two sources of error in step 3 to step 22. For each source of error suggest an improvement to the method which will reduce the effect of the error.
error 1 ______
improvement 1 ______
error 2 ______
improvement 2 ______
The procedure described by step 1 to step 22 investigated the effect of surface area on catalase activity, by measuring the number of drops released in 1 minute.
Describe how you would modify the procedure to investigate the effect of changing temperature on the activity of catalase in the potato tissue.
A student investigated the effect of hydrogen peroxide concentration on the activity of catalase. The student measured the distance the solution moved along a clear plastic tube attached to a syringe, as shown in Fig. 1.5.
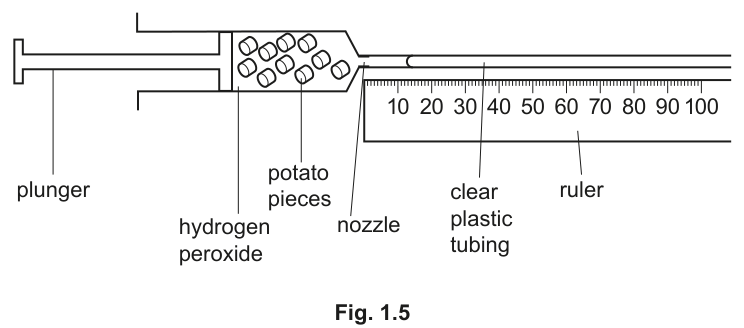
The results are shown in Table 1.5.
Table 1.5
| percentage concentration of hydrogen peroxide | distance moved in 1 minute / |
|---|---|
| 0.2 | 11 |
| 0.4 | 18 |
| 0.8 | 50 |
| 1.5 | 69 |
| 3.0 | 73 |
| 6.0 | 73 |
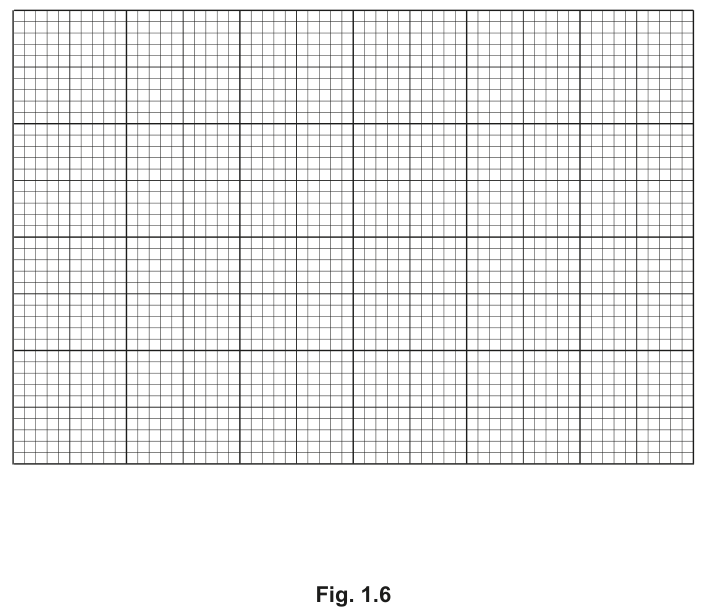
Plot a graph of the data in Table 1.5 on the grid in Fig. 1.6.
Use a sharp pencil for drawing graphs.
Suggest an explanation for the results between 0.2% and 6.0% hydrogen peroxide.
The rest of this paper
1 more questions- Q2Use of the Light Microscope · Analysis, Conclusions and Evaluation · Manipulation, Measurement and Observation · Presentation of Data and Observations18M