Biology 9700/33 — February/March 2021
Cambridge AS Level · Advanced Practical Skills · worked solutions for every part, with the mark scheme
Topics Use of the Light Microscope · Presentation of Data and Observations · Manipulation, Measurement and Observation · Analysis, Conclusions and Evaluation
Before you proceed, read carefully through the whole of Question 1 and Question 2.
Plan the use of the two hours to make sure that you finish the whole of Question 1 and Question 2.
Agar cubes that have been stained with universal indicator can be used to investigate diffusion.
When hydrochloric acid diffuses into the agar cubes, the agar cubes change colour. The end-point is reached when the whole cube has changed colour to pink.
You will investigate the effect of the concentration of hydrochloric acid on the rate of diffusion.
You are provided with the materials shown in Table 1.1.
Table 1.1
| labelled | materials | hazard | volume / |
|---|---|---|---|
| H | hydrochloric acid | irritant | 100 |
| A | agar block on a white tile | none | — |
| W | distilled water | none | 100 |
If H comes into contact with your skin, wash it off immediately with cold water.
It is recommended that you wear suitable eye protection.
You will use proportional dilution of hydrochloric acid, H, to make the different concentrations of hydrochloric acid that you will need for this investigation. You will need to reduce the concentration of hydrochloric acid by between each successive dilution.
You will prepare of each concentration of hydrochloric acid using H and W.
Complete Table 1.2 to show how you will prepare the concentrations of hydrochloric acid that you will use.
Table 1.2
| concentration of hydrochloric acid / | volume of H / | volume of W / |
|---|---|---|
| 1.0 | 20.0 | 0.0 |
Carry out step 1 to step 6.
- Prepare the concentrations of hydrochloric acid, as shown in Table 1.2, in the beakers provided.
- On the white tile provided, cut three agar cubes from the agar block, A, for each of the concentrations of hydrochloric acid that you will use. Do not allow the agar block or agar cubes to come into contact with your skin because this may affect your results.
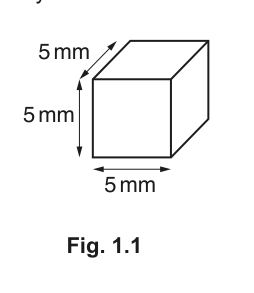
The cubes should be approximately , as shown in Fig. 1.1.
In step 3 you will put three of the agar cubes into the beaker containing hydrochloric acid.
State the apparatus you will use to put the agar cubes into the beaker containing hydrochloric acid.
- Put three agar cubes into the beaker containing hydrochloric acid and immediately start timing.
- Measure the time taken for each of the three agar cubes to reach the end-point and record the time in (a)(iii).
The end-point for each cube is when the whole agar cube has changed colour to pink.
If any agar cube has not reached the end-point after 3 minutes, stop timing and record as 'more than 180' for that agar cube.
- Put three agar cubes into the beaker containing the next concentration of hydrochloric acid that you prepared in step 1 and immediately start timing.
- Repeat step 4 and step 5 until results have been collected for all the concentrations of hydrochloric acid prepared in step 1.
Record your results in an appropriate table.
State the dependent variable in this investigation.
Identify one source of error in step 2 to step 6.
Suggest an improvement to the method that will reduce the effect of this error.
source of error ______
improvement ______
A student suggested the hypothesis:
As the concentration of hydrochloric acid decreases, the time taken for acid to diffuse into the agar blocks will decrease.
Tick (✓) one box to show whether or not your results support this hypothesis.
support [ ]
do not support [ ]
Explain how your results provide evidence for this decision.
The procedure described in step 1 to step 6 investigated the effect of changing the concentration of hydrochloric acid on the rate of diffusion, using the time taken to reach the end-point.
Describe how you could modify this procedure to investigate the effect of changing the temperature on the rate of diffusion, using the time taken to reach the end-point.
Salt is used to preserve cheese. Cheese can be soaked in a salt solution to allow the salt to diffuse into it.
A scientist soaked cheese in a 15% salt solution at and measured the distance that the salt had diffused into the cheese at intervals over a period of 20 hours.
The results are shown in Table 1.3.
Table 1.3
| time / hours | distance / cm |
|---|---|
| 0 | 0.00 |
| 4 | 0.46 |
| 8 | 0.69 |
| 13 | 0.90 |
| 16 | 0.99 |
| 20 | 1.06 |
Plot a graph of the data in Table 1.3 on the grid in Fig. 1.2.
Use a sharp pencil for drawing graphs.
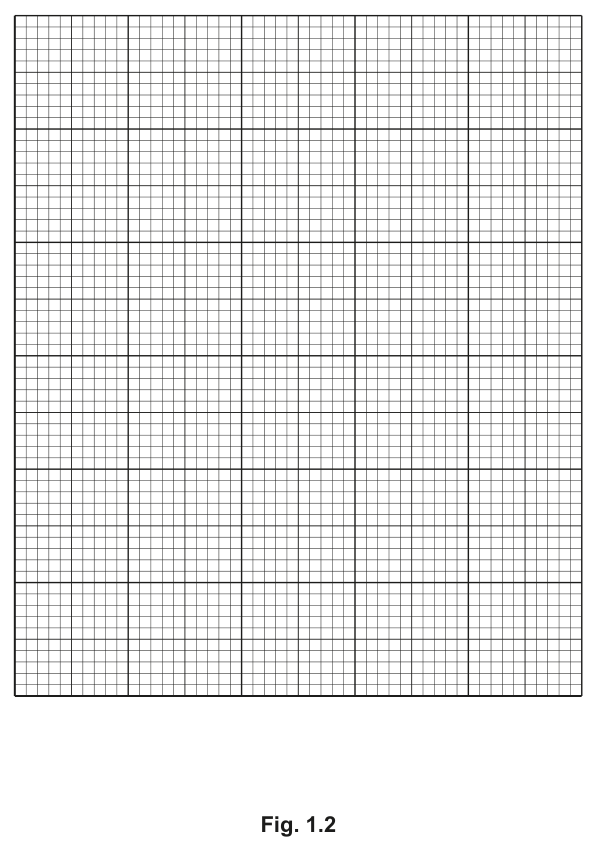
Use your graph in Fig. 1.2 to calculate the mean rate of diffusion of salt during the first three hours.
Show your working on the graph and in the space below.
mean rate of diffusion = ______
The scientist repeated the investigation at and found the rate of diffusion at to be greater than the rate of diffusion at .
Explain the difference between the rate of diffusion at and the rate of diffusion at .
The rest of this paper
1 more questions- Q2Use of the Light Microscope · Presentation of Data and Observations · Manipulation, Measurement and Observation · Analysis, Conclusions and Evaluation19M