Biology 9700/36 — October/November 2020
Cambridge AS Level · Advanced Practical Skills · worked solutions for every part, with the mark scheme
Topics Manipulation, Measurement and Observation · Presentation of Data and Observations · Analysis, Conclusions and Evaluation · Use of the Light Microscope
Urease is an enzyme that catalyses the breakdown of urea as shown in Fig. 1.1.

Fig. 1.1
The ammonium carbonate forms an alkaline solution that causes red litmus paper to change to blue.
The change in colour of the litmus paper can be used to determine the rate of reaction.
Urease can be extracted from germinating beans.
- You will investigate the effect of different concentrations of urease on the breakdown of urea.
- You will use your results to estimate the concentration of urease in a bean extract.
You are provided with the materials shown in Table 1.1.
Table 1.1
| labelled | contents | hazard | volume / |
|---|---|---|---|
| E | 10% urease solution | harmful irritant | 10 |
| U | 5% urea solution | none | 10 |
| W | distilled water | none | 100 |
| B | bean extract | harmful irritant | 10 |
| – | red litmus paper | none | – |
If any solution comes into contact with your skin, wash off immediately under cold water.
It is recommended that you wear suitable eye protection.
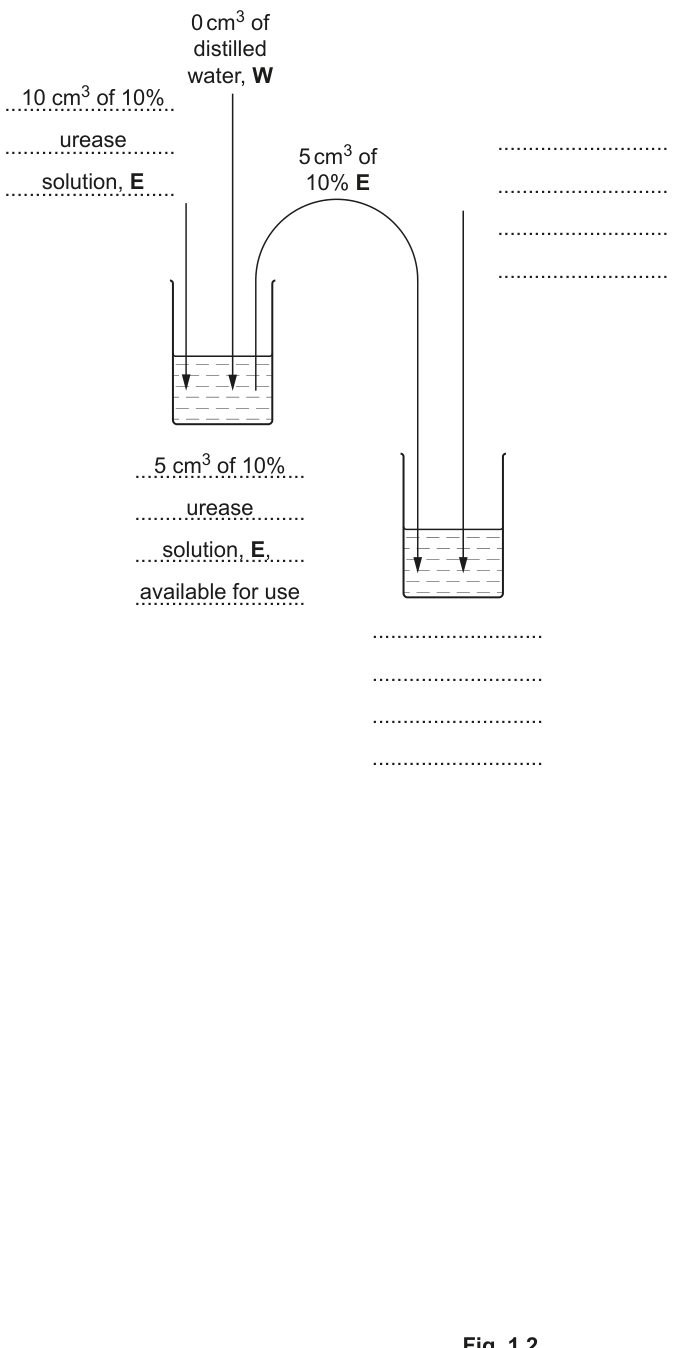
You will need to carry out a serial dilution of the 10% urease solution, E, to reduce the concentration by half between each successive dilution.
Fig. 1.2 shows the first two beakers you will use to make your serial dilution.
Complete Fig. 1.2 by drawing as many extra beakers as you need for your serial dilution.
For each beaker:
- state, under the beaker, the volume and concentration of urease solution available for use in the investigation
- use one arrow with a label, above the beaker, to show the volume and concentration of urease solution added to prepare the concentration
- use another arrow with a label, above the beaker, to show the volume of W added to prepare the concentration.
Carry out step 1 to step 10.
- Prepare the concentrations of urease solution, as decided in (a)(i) and shown in Fig. 1.2.
- Prepare a clean, dry spotting tile by labelling the wells with the concentrations of urease solution, as decided in (a)(i). Label one well W, for water.
- Put 5 drops of urea solution, U, into each labelled well.
- Put 3 drops of 10% urease solution into the appropriately labelled well. Mix gently.
- Repeat step 4 with the other concentrations of urease solution you prepared in step 1.
- Put 3 drops of water, W, into the appropriately labelled well. Mix gently.
- Cut the red litmus paper into lengths of approximately . Put one piece of litmus paper into each labelled solution on the spotting tile.
- Start timing and leave for 2 minutes.
- After 2 minutes, observe the colour of the litmus paper in each well. You may see the same colour in more than one well.
Fig. 1.3 shows the key you need to use to record your results.
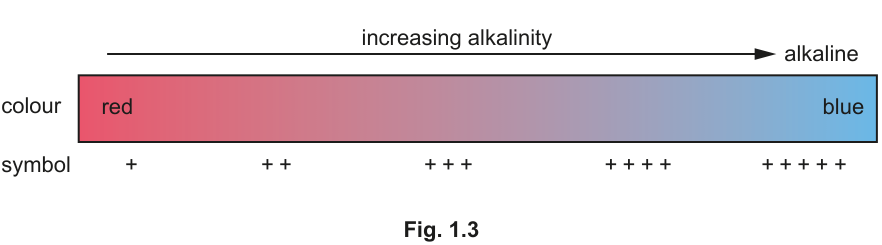
- Record your results in (a)(ii) using the symbols shown in Fig. 1.3.
Record your results in an appropriate table.
Describe the trend in your results.
- Choose a clean, dry well on the spotting tile, and label it B.
- Put 5 drops of U into this well.
- Put 3 drops of B into the same well. Mix gently.
- Put one length of litmus paper into the well.
- Start timing and leave for 2 minutes.
- After 2 minutes, observe the colour of the litmus paper in the well.
Record your result for B using the symbols shown in the key in Fig. 1.3.
result for B = ______
Use your results in (a)(ii) and (a)(iv) to estimate the concentration of urease in bean extract, B.
concentration = ______
Describe how you could modify this procedure to produce a more accurate estimate of the concentration of urease in bean extract, B.
Identify two sources of error in step 3 to step 8. For each error suggest an improvement to the method that will reduce the effect of the error.
error 1 ______
improvement ______
error 2 ______
improvement ______
The enzyme urease is also produced by soil bacteria.
The effect of soil temperature on urease activity was investigated. The results are shown in Table 1.2.
Table 1.2
| soil temperature / | urease activity / arbitrary units |
|---|---|
| 5 | 2.5 |
| 15 | 5.0 |
| 25 | 7.5 |
| 35 | 15.0 |
| 45 | 32.5 |
| 55 | 31.0 |
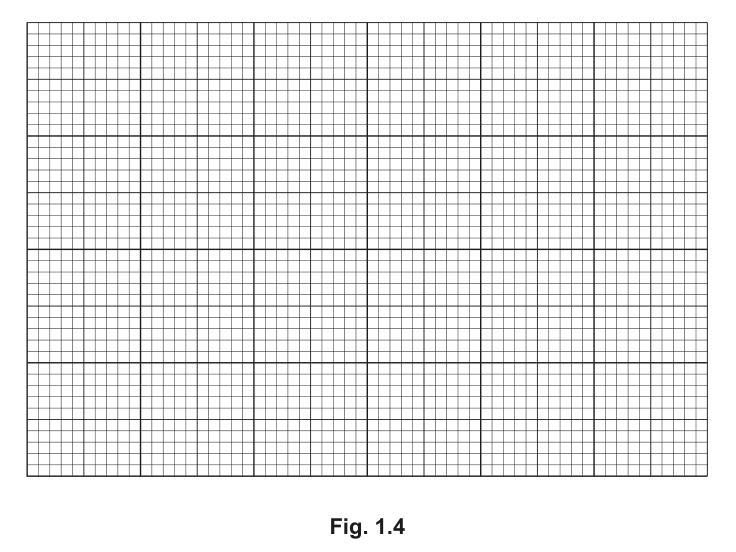
Plot a graph of the data shown in Table 1.2 on the grid in Fig. 1.4.
Use a sharp pencil for drawing graphs.
The average soil temperature recorded in a woodland was .
Use your graph in (b)(i) to estimate the urease activity in the soil at .
Show on your graph how you obtained your answer.
urease activity at = ______
Explain the effect of soil temperature on urease activity as shown in your graph in (b)(i).
The rest of this paper
1 more questions- Q2Use of the Light Microscope · Manipulation, Measurement and Observation18M