Biology 9700/34 — October/November 2020
Cambridge AS Level · Advanced Practical Skills · worked solutions for every part, with the mark scheme
Topics Manipulation, Measurement and Observation · Presentation of Data and Observations · Analysis, Conclusions and Evaluation · Use of the Light Microscope
Amylase is an enzyme which hydrolyses starch into reducing sugars, as shown in Fig. 1.1.
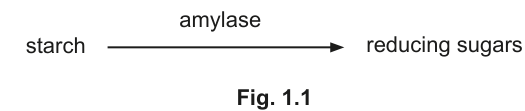
Fig. 1.1
The progress of this reaction can be followed by measuring the concentration of starch remaining using iodine solution.
You will need to:
• prepare a serial dilution of a 1.0% starch solution, S
• estimate the concentration of starch remaining after hydrolysis with amylase at two different pH values.
You are provided with the materials shown in Table 1.1.
Table 1.1
| labelled | contents | hazard | volume / |
|---|---|---|---|
| S | 1.0% starch solution | none | 50 |
| iodine | iodine solution | none | 20 |
| W | distilled water | none | 150 |
| X | a sample of 1.0% starch solution which has been incubated with amylase and pH2 buffer | harmful irritant | 20 |
| Y | a sample of 1.0% starch solution which has been incubated with amylase and pH7 buffer | harmful irritant | 20 |
If any solution comes into contact with your skin, wash off immediately under cold water.
It is recommended that you wear suitable eye protection.
You need to carry out a serial dilution of the 1.0% starch solution, S, which reduces the concentration of the starch solution by a factor of 10 between each successive dilution.
Fig. 1.2 shows you the first two beakers you will use to make your serial dilution.
Complete Fig. 1.2 by drawing as many extra beakers as you need for your serial dilution.
For each beaker:
• state, under the beaker, the volume and concentration of starch solution available for use in the investigation
• use one arrow with a label, above the beaker, to show the volume and concentration of starch solution added to prepare the concentration
• use another arrow with a label, above the beaker, to show the volume of W added to prepare the concentration.
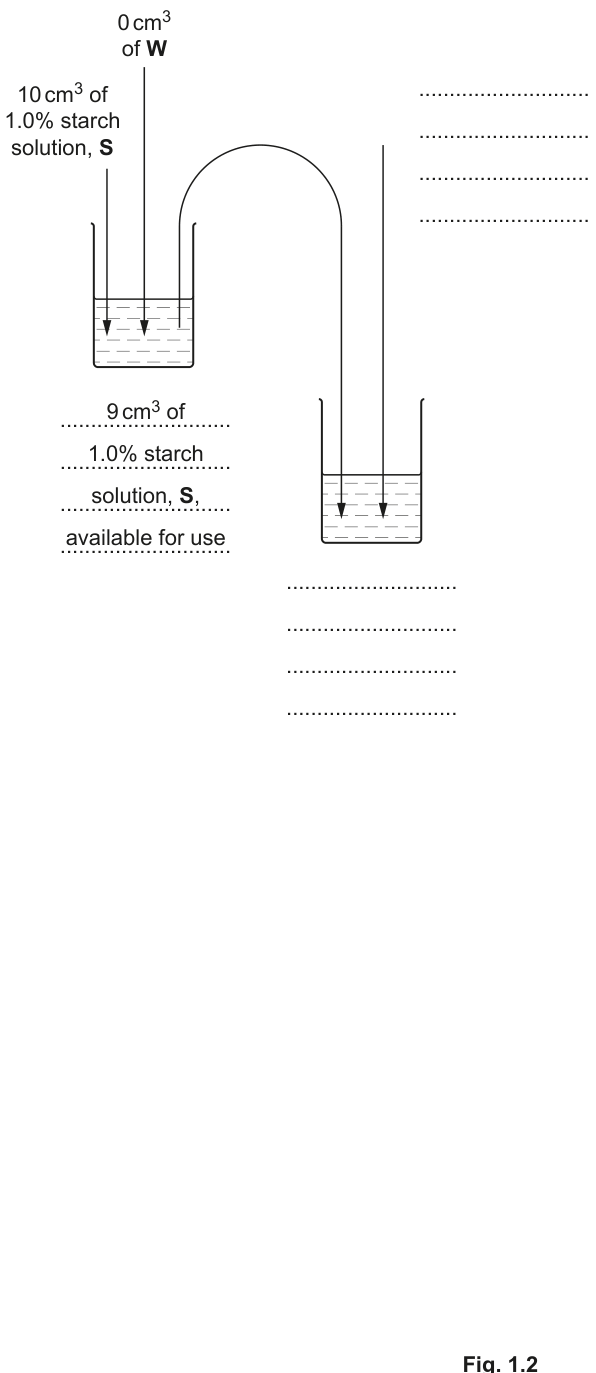
Fig. 1.2
Carry out step 1 to step 6.
- Prepare the concentrations of starch solution as decided in (a)(i) and shown in Fig. 1.2. Use a glass rod to mix the starch solutions and water.
- Label test-tubes with the concentrations of starch solution prepared in step 1.
- Put of each concentration of starch solution into an appropriately labelled test-tube.
- Put 3 drops of iodine into each of the test-tubes. Shake gently to mix.
- After step 4, observe the colour of the liquid in each test-tube. You may see the same colour in more than one test-tube.
It may help to hold a piece of white card behind the test-tube to see the colour more clearly.
Fig. 1.3 shows the key you need to use to record your results.
Key
| colour | symbol |
|---|---|
| blue/black or purple | +++++ |
| blue | ++++ |
| dark brown | +++ |
| brown | ++ |
| yellow/orange | + |
Fig. 1.3
- Record your results in (a)(ii) using the symbols shown in the key in Fig. 1.3.
Record your results in an appropriate table.
Carry out step 7 to step 10.
- Label a test-tube X.
- Put of X into this test-tube.
- Put 3 drops of iodine into this test-tube. Shake gently to mix.
- Observe the colour of the liquid and record the result in (a)(iii) using the symbols shown in Fig. 1.3.
- Repeat step 7 to step 10, using Y instead of X.
Record your result for X and Y using the symbols shown in the key in Fig. 1.3.
result for X = ______
result for Y = ______
Using your results in (a)(ii) and (a)(iii), estimate the concentration of starch in X and Y.
X = ______
Y = ______
A student investigated the hydrolysis of starch by amylase.
The student decided to use a semi-quantitative method to measure the products.
These products are reducing sugars.
Suggest how the student would use a semi-quantitative method to measure the concentration of reducing sugars produced.
One of the reducing sugars produced by the hydrolysis of starch is maltose.
Maltose is a disaccharide that can be hydrolysed to glucose by the enzyme maltase.
A student investigated the effect of maltose concentration on the initial rate of reaction of maltase.
The results are shown in Table 1.2.
Table 1.2
| concentration of maltose / | initial rate of reaction of maltase / arbitrary units |
|---|---|
| 0.00 | 0 |
| 0.60 | 90 |
| 1.30 | 175 |
| 1.85 | 225 |
| 2.45 | 255 |
| 3.55 | 260 |
| 3.95 | 260 |
Plot a graph of the data in Table 1.2 on the grid in Fig. 1.4.
Use a sharp pencil for drawing graphs.
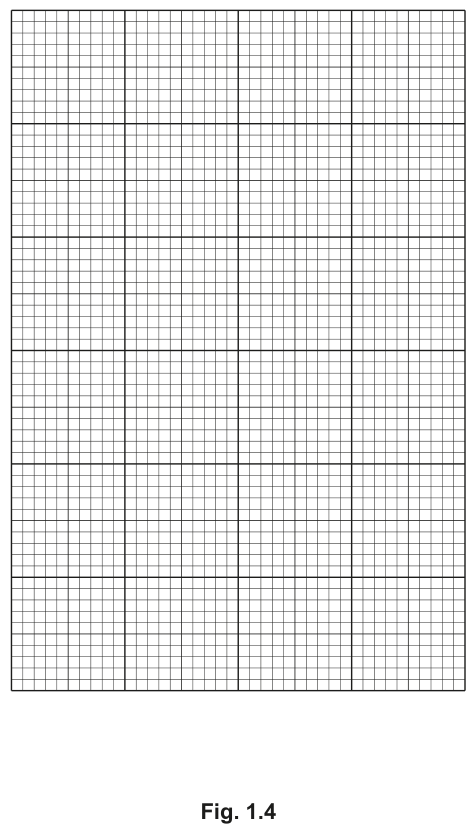
Fig. 1.4
Use the graph in Fig. 1.4 to estimate the Michaelis–Menten constant, .
Show your working on the graph and in the space below.
= ______
A student investigated a different enzyme, Z, and found the value to be .
State which enzyme, Z or maltase, has a lower affinity for its substrate. Give a reason for your answer.
enzyme ______
reason ______
Using the graph in Fig. 1.4, explain the change in the rate of reaction between of maltose and of maltose.
The rest of this paper
1 more questions- Q2Use of the Light Microscope · Presentation of Data and Observations · Manipulation, Measurement and Observation18M