Biology 9700/33 — October/November 2020
Cambridge AS Level · Advanced Practical Skills · worked solutions for every part, with the mark scheme
Topics Presentation of Data and Observations · Analysis, Conclusions and Evaluation · Manipulation, Measurement and Observation · Use of the Light Microscope
Yeast cells contain enzymes that break down sugars to release energy. In these reactions carbon dioxide is released. Some of this carbon dioxide dissolves in water forming carbonic acid.
The progress of these enzyme-catalysed reactions can be followed by measuring the time taken for an indicator to change colour as carbonic acid is formed.
You will investigate the effect of changing the concentration of yeast suspension on the time taken for the indicator to change colour.
You are provided with the materials shown in Table 1.1.
Table 1.1
| labelled | contents | hazard | volume / |
|---|---|---|---|
| Y | 10% yeast suspension | none | 100 |
| H | hydrogencarbonate indicator solution | none | 50 |
| W | distilled water | none | 100 |
If any solution comes into contact with your skin, wash off immediately under cold water.
It is recommended that you wear suitable eye protection.
Read step 1 to step 4.
Using Table 1.1 and step 1 to step 4, assess the risk of this procedure as low, medium or high. Give one reason for your answer.
risk ______
reason ______
The hydrogencarbonate indicator solution, H, will change colour from brown to yellow as carbon dioxide passes through it.
To help you identify the end-point (yellow) carry out step 1 to step 4.
- Put of H into a small test-tube.
- Put a drinking straw into this test-tube.
- Gently breathe out through the straw so that you are blowing air bubbles through H.
- Stop blowing when the colour changes from brown to yellow. This is the end-point.
You will need to use this test-tube for colour comparison in step 14.
You will use proportional dilution to make different concentrations of yeast suspension, Y.
You will need to prepare of each concentration of yeast suspension.
Complete Table 1.2 to show how you will prepare the concentrations of yeast suspension you will use.
Table 1.2
| percentage concentration of yeast suspension | volume of Y / | volume of W / |
|---|---|---|
| 10.0 | 20.0 | 0.0 |
Carry out step 5 to step 18.
- Use a glass rod to stir the yeast suspension, Y.
- Prepare the concentrations of yeast suspension as decided in (a)(ii) and shown in Table 1.2.
- Label a small test-tube for each of the concentrations of yeast suspension you have prepared in step 6.
- Put of H into each labelled test-tube.
- Using the beakers labelled water-bath, hot water and cold water, set up and maintain a water-bath with water between and .
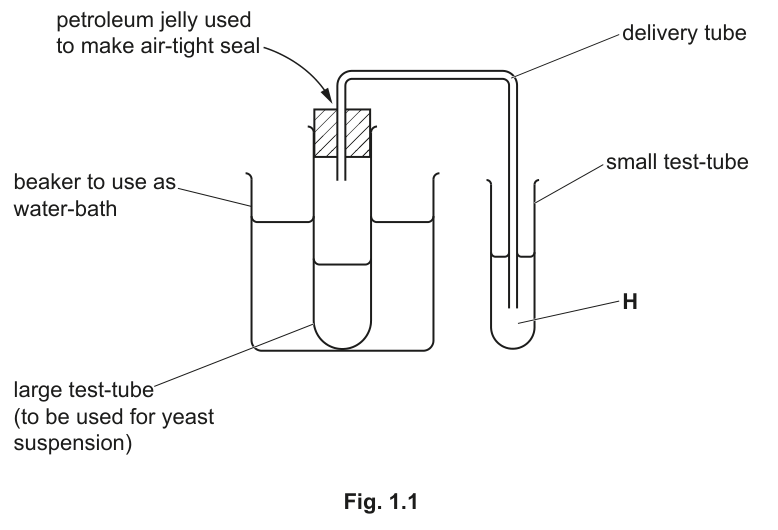
Fig. 1.1 shows the apparatus you will set up for the investigation.
- Use a glass rod to stir the 10% yeast suspension, then put of the 10% yeast suspension into the large test-tube.
- Put the large test-tube in the water-bath.
- Put the bung in the large test-tube, and make sure the end of the delivery tube is in H, as shown in Fig. 1.1.
- Start timing.
- Stop timing when the end-point is reached.
The test-tube from step 4 can be used to confirm the end-point.
Record the result in (a)(iii). If the time taken is more than 180 seconds, record the result as 'more than 180'.
- Put the contents of the large test-tube into the container labelled For waste.
- Rinse the large test-tube using water from the container labelled For washing.
- Put another test-tube of H, prepared in step 7, into the apparatus shown in Fig. 1.1.
- Repeat step 10 to step 17 for the other concentrations of yeast suspension you prepared in step 6.
Record your results in an appropriate table.
Identify one significant source of error in this investigation. Give a reason for your answer.
source of error ______
reason ______
A student suggested that collecting the carbon dioxide gas would be a better way to produce quantitative data.
Describe the apparatus and a suitable method the student could use to collect and measure the volume of carbon dioxide. You may use a labelled diagram in the space provided.
space for diagram
A student carried out an investigation into the effect of temperature on the activity of the enzymes in Y.
The student immobilised the yeast cells in alginate beads which were then dropped into a solution of the substrate at different temperatures.
As carbon dioxide collected in the beads they rose to the surface of the solution of the substrate as shown in Fig. 1.2.
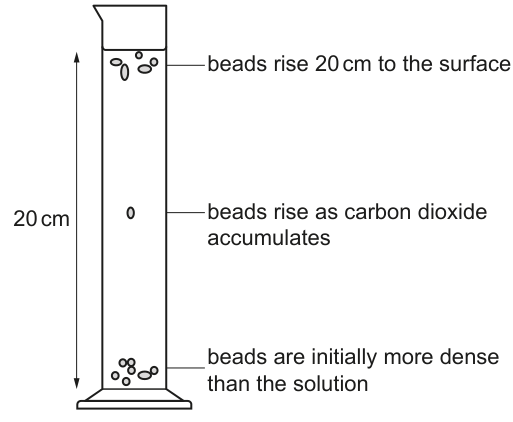
Fig. 1.2
The student measured the time taken for 5 beads to rise to the surface, a distance of .
The processed results are shown in Table 1.3
Table 1.3
| temperature / | mean time to rise / seconds |
|---|---|
| 10 | 72 |
| 25 | 19 |
| 40 | 11 |
| 50 | 36 |
| 55 | 108 |
Identify the temperature at which the beads rise the fastest. ______
For this temperature calculate the rate at which these beads rise .
rate = ______
Plot a graph of the data in Table 1.3 on the grid in Fig. 1.3.
Use a sharp pencil for drawing graphs.
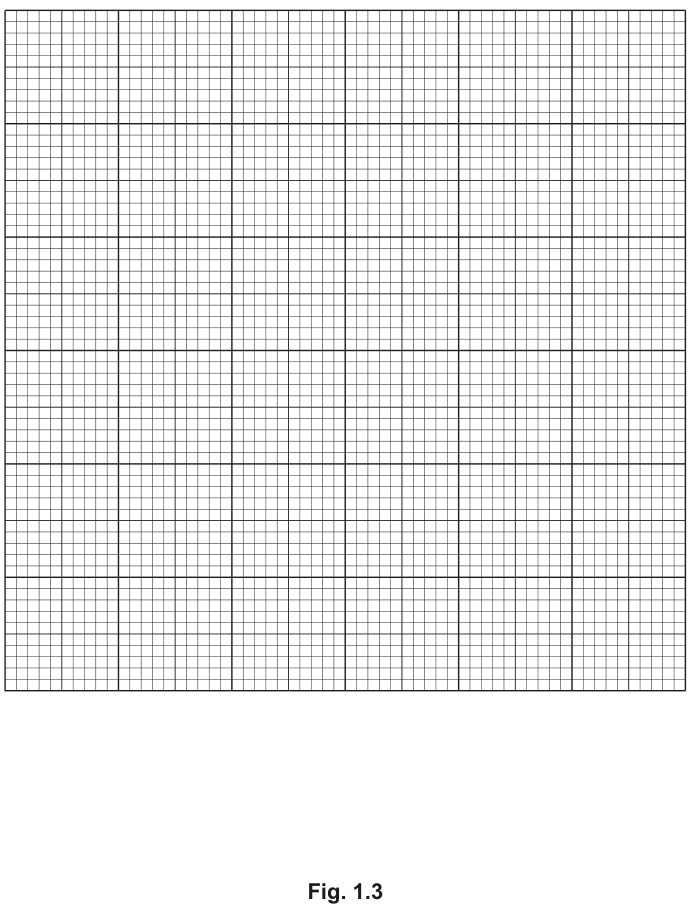
Fig. 1.3
Describe the trend shown by the graph in Fig. 1.3.
Explain the shape of the graph:
between and
between and .
The rest of this paper
1 more questions- Q2Use of the Light Microscope · Presentation of Data and Observations · Analysis, Conclusions and Evaluation19M