Biology 9700/31 — October/November 2020
Cambridge AS Level · Advanced Practical Skills · worked solutions for every part, with the mark scheme
Topics Manipulation, Measurement and Observation · Presentation of Data and Observations · Analysis, Conclusions and Evaluation · Use of the Light Microscope
Milk contains nutrients, including proteins, fats, carbohydrates, vitamins and minerals, that are essential for growth and development of young mammals.
When milk, M, is dropped into a test-tube containing copper sulfate solution, CS, the drop of milk sinks to the bottom of the test-tube. The rate at which the drop of milk sinks depends on the concentration of the milk.
You are provided with the materials shown in Table 1.1.
Table 1.1
| labelled | contents | hazard | volume / |
|---|---|---|---|
| CS | copper sulfate solution | irritant | 200 |
| M | 100% milk | none | 50 |
| W | distilled water | none | 30 |
| U | milk sample of unknown concentration | none | 10 |
If CS comes into contact with your skin, wash off immediately under cold water.
It is recommended that you wear suitable eye protection.
Carry out step 1 to step 3 to practise releasing one drop of M from a syringe.
- Put of M into the syringe labelled M.
- Hold the syringe containing M over an empty test-tube, as shown in Fig. 1.1. Push the plunger slowly to release one drop.
- Repeat step 2 until you can release one drop at a time.
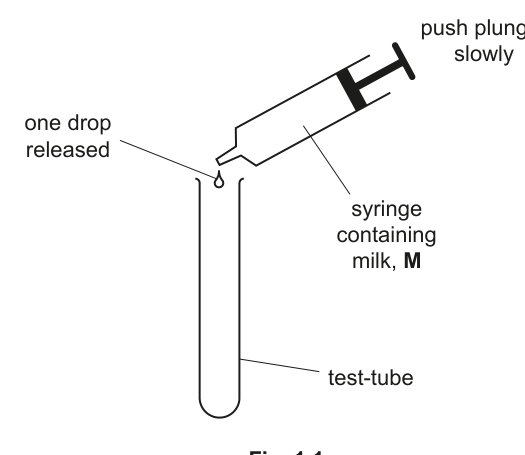
Fig. 1.1
You will investigate the effect of changing the concentration of milk on the time taken for one drop of milk to sink through copper sulfate solution.
You will need to:
- prepare different concentrations of milk
- record the time taken for one drop of each concentration of milk to sink through copper sulfate solution, CS
- use your results to estimate the concentration of milk sample, U.
You will need to use proportional dilution to make different concentrations of milk, M, between 90% and 50%.
You will need to prepare of each concentration, using M and W.
Table 1.2 shows how to make up two of the concentrations of milk you will use.
Decide which other concentrations of milk you will use.
Complete Table 1.2 to show how you will prepare the concentrations of milk you will use.
Table 1.2
| percentage concentration of milk | volume of M / | volume of W / |
|---|---|---|
| 90.0 | 9.0 | 1.0 |
| 50.0 | 5.0 | 5.0 |
Carry out step 4 to step 14.
- Prepare the concentrations of milk, as shown in Table 1.2, in the beakers provided.
- Draw a line from the top of a clean, dry test-tube, as shown in Fig. 1.2.
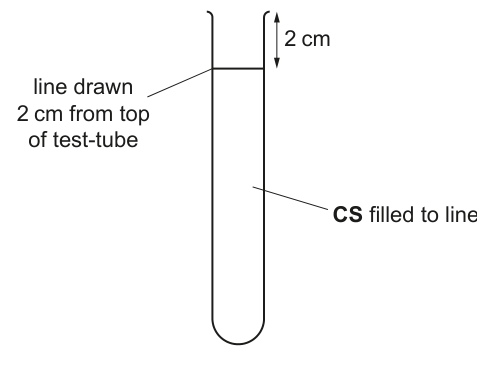
Fig. 1.2
- Put CS into this test-tube up to the mark, as shown in Fig. 1.2.
- Stir the 90% concentration of milk.
- Put of the 90% milk into the syringe labelled M.
- Put one drop of 90% milk into the test-tube containing CS, as shown in Fig. 1.3. Start timing.
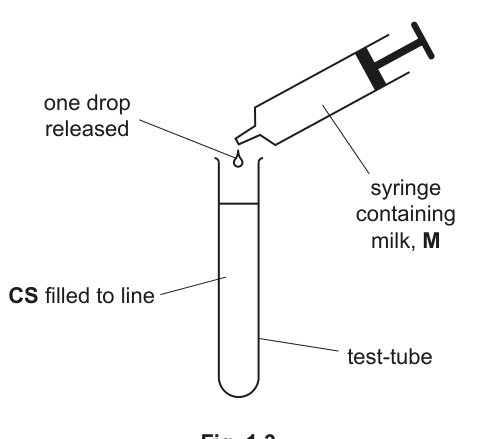
Fig. 1.3
- Stop timing when the drop reaches the bottom of the test-tube. If the drop has not reached the bottom of the test-tube after 120 seconds, stop timing and record 'more than 120'.
- Record your result in (a)(ii).
- Repeat step 9 to step 11 two more times, with 90% milk. This will give you three results for 90% milk.
- Empty the contents of the test-tube into the container labelled For waste.
- Repeat step 6 to step 13 for the other concentrations of milk you have prepared.
Record your results in an appropriate table, including raw results and processed (mean) results.
Describe the trend in your results.
You are provided with a sample of milk labelled U.
- Repeat step 6 to step 10 using U.
- Record your result for U in (a)(iv).
Record the time taken for the drop of U to reach the bottom of the test-tube.
result for U = ______
Using your results in (a)(ii) and (a)(iv) estimate the concentration of milk in U.
U = ______
Table 1.3 describes two sources of error when measuring the dependent variable in this investigation.
Complete Table 1.3 by:
- describing, for each error, an improvement to the procedure that reduces the effect of the error
- describing a third error and the improvement you would make to reduce its effect.
Table 1.3
| error | improvement |
|---|---|
| 1. Milk sometimes stays at the top of CS and may interfere with the movement of the next drop. | |
| 2. The drop sometimes sticks to the side of the test-tube and changes the time taken for the drop to reach the bottom. | |
| 3. |
Error 2 in Table 1.3 states that 'the drop sometimes sticks to the side of the test-tube and changes the time taken for the drop to reach the bottom.'
State whether error 2 is a random error or a systematic error.
Give a reason for your answer.
type of error = ______
reason = ______
The milk produced by mammals contains fat globules.
Table 1.4 shows the mean fat globule diameter for the milk produced by different types of mammal.
Table 1.4
| type of mammal | mean fat globule diameter / |
|---|---|
| buffalo (B) | 8.8 |
| human (H) | 4.3 |
| camel (C) | 2.9 |
| goat (G) | 3.2 |
| sheep (S) | 3.7 |
Plot a bar chart of the data in Table 1.4 on the grid in Fig. 1.4.
Use a sharp pencil for drawing bar charts.
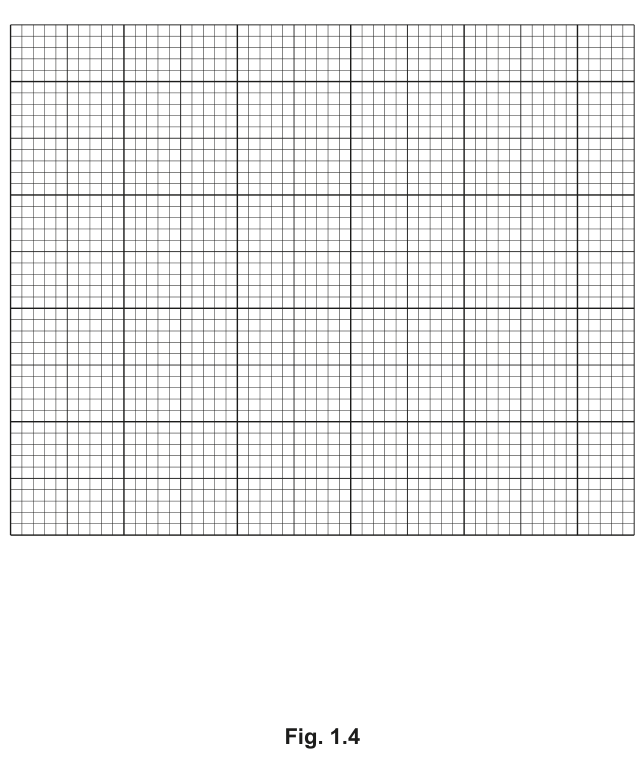
Fig. 1.4
Suggest which mammal milk in Table 1.4 contains fat that takes the longest time to be broken down by enzymes.
Explain your answer.
mammal = ______
explanation = ______
The rest of this paper
1 more questions- Q2Use of the Light Microscope · Presentation of Data and Observations · Manipulation, Measurement and Observation19M