Biology 9700/35 — May/June 2020
Cambridge AS Level · Advanced Practical Skills · worked solutions for every part, with the mark scheme
Topics Presentation of Data and Observations · Analysis, Conclusions and Evaluation · Manipulation, Measurement and Observation · Use of the Light Microscope
Before you proceed, read carefully through the whole of Question 1 and Question 2.
Plan the use of the two hours to make sure that you finish the whole of Question 1 and Question 2.
Yeast contains an enzyme that will break down hydrogen peroxide into oxygen and water. The oxygen can be collected.
You will investigate the effect of the inhibitor copper sulfate on the breakdown of hydrogen peroxide and the volume of oxygen collected.
You are provided with the materials shown in Table 1.1.
Table 1.1
| labelled | contents | hazard | volume / | risk |
|---|---|---|---|---|
| Y | yeast suspension | none | 40 | |
| H | hydrogen peroxide solution | harmful irritant | 50 | |
| C | 1.0% copper sulfate solution | harmful irritant | 40 | |
| W | distilled water | none | 100 | low |
If any solution comes into contact with your skin, wash off immediately under cold water.
It is recommended that you wear suitable eye protection.
Think about the hazards of using the materials in Table 1.1.
Decide whether the risk of using Y, H and C is low, medium or high.
Complete Table 1.1, using the words low, medium or high, to state the risk of using Y, H and C. You may use each word once, more than once or not at all.
The risk for W has been completed for you.
Answer
| labelled | risk |
|---|---|
| Y | low |
| H | medium |
| C | medium |
Y (yeast suspension) has no hazard listed, so the risk is low. H (hydrogen peroxide) and C (1.0% copper sulfate) are both labelled harmful irritant, so the risk is medium (skin/eye irritation if contact occurs).
Y = low; H = medium; C = medium
Background Concept
Risk assessment distinguishes hazard (the intrinsic property of a substance that could cause harm — toxic, irritant, flammable, etc.) from risk (the likelihood and severity of that harm actually occurring during the procedure). CIE practical papers express risk using the words low, medium or high. A substance can have a recognised hazard but still pose a low risk if it is used in tiny quantities with appropriate controls; conversely, even dilute irritants can present medium risk if skin or eye contact is plausible.
In this investigation the four solutions are:
- Y — yeast suspension (biological, not classed as hazardous).
- H — hydrogen peroxide solution, labelled harmful irritant.
- C — 1.0% copper sulfate solution, labelled harmful irritant.
- W — distilled water (control), already completed as low.
Understanding the Question
Table 1.1 lists each solution with its hazard and (for W) a sample risk. You must complete the risk column for Y, H and C. Each word — low / medium / high — may be used once, more than once, or not at all.
Approach
Match the hazard wording to the appropriate risk band:
- "none" → low
- "harmful / irritant" → medium
- "very harmful / corrosive / toxic / flammable" → high
Step-by-Step Reasoning
- Y (yeast suspension): hazard is "none". With no hazardous property, the chance of harm is negligible → low risk.
- H (hydrogen peroxide solution): hazard is "harmful irritant". At the working concentration, contact with skin or eyes would cause irritation, so the risk is meaningful → medium risk.
- C (1.0% copper sulfate solution): also "harmful irritant". Same logic as H → medium risk.
- W (distilled water): already filled in as "low" — water is essentially non-hazardous.
The mark scheme accepts medium or high for H and C but explicitly rejects low because both carry an irritant warning.
Key Takeaways
- Risk = likelihood × severity, judged against how the chemical is actually used.
- "Harmful irritant" maps to at least medium risk, never low.
- Risk is relative to the procedure and quantity, not an absolute property of the chemical.
Common Mistakes
- Writing "low" for H or C because the volumes are small — risk considers the consequences of contact, not the quantity handled.
- Writing "high" for H or C without justification; "harmful irritant" corresponds to medium in CIE standard wording.
- Stating the hazard ("harmful", "irritant") instead of the risk category.
Things to Be Careful About
- The note "you may use each word once, more than once or not at all" is a hint that the three answers are not all distinct — here "medium" appears twice.
- Even though H and C are handled briefly, skin contact is plausible, so medium risk is the honest assessment.
You will need to make a serial dilution of 1.0% copper sulfate solution, C, which reduces the concentration by half between each successive dilution.
Fig. 1.1 shows the first two beakers you will use to make your serial dilution.
Complete Fig. 1.1 by drawing as many extra beakers as you need for your serial dilution.
For each beaker:
- state, under the beaker, the volume and concentration of copper sulfate solution available for use in the investigation
- use one arrow with a label, above the beaker, to show the volume and concentration of copper sulfate solution added to prepare the concentration
- use another arrow with a label, above the beaker, to show the volume of W added to prepare the concentration.
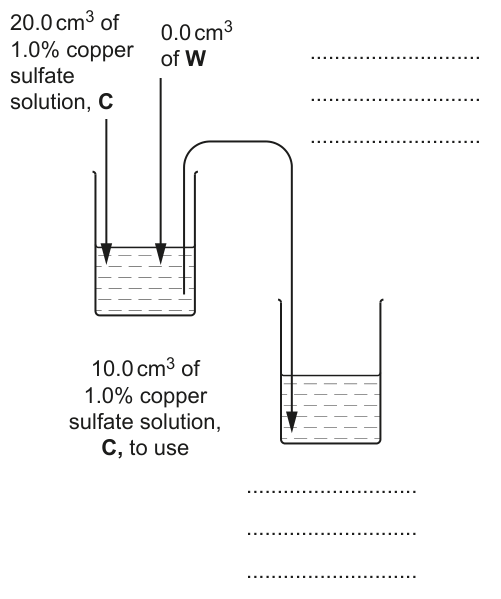
Answer
Concentrations to use (labelled under each beaker):
- Beaker 1: 10 cm³ of 1.0% copper sulfate solution, C, to use (already drawn)
- Beaker 2: 10 cm³ of 0.5% copper sulfate solution to use
- Beaker 3: 10 cm³ of 0.25% copper sulfate solution to use
- Beaker 4: 10 cm³ of 0.125% copper sulfate solution to use
- Beaker 5: 10 cm³ of 0.0625% copper sulfate solution to use
Transfer arrows above each beaker:
- Beaker 1 → 2: 10 cm³ of solution transferred
- Beaker 2 → 3: 10 cm³ of solution transferred
- Beaker 3 → 4: 10 cm³ of solution transferred
- Beaker 4 → 5: 10 cm³ of solution transferred
Water additions above each beaker:
- Beaker 1: 0 cm³ of W (already drawn)
- Beaker 2: 10 cm³ of W
- Beaker 3: 10 cm³ of W
- Beaker 4: 10 cm³ of W
- Beaker 5: 10 cm³ of W
Five beakers: 1.0% (given) → 0.5% → 0.25% → 0.125% → 0.0625%, each prepared by adding 10 cm³ transferred from the previous beaker and 10 cm³ of W (no transfer leaves beaker 5).
Background Concept
A serial dilution is a stepwise dilution in which each successive tube/beaker contains a known fraction of the previous concentration, made up to the same total volume with diluent (here distilled water, W). A halving serial dilution halves the concentration at every step. Because the same fixed volume is transferred each time and topped up with the same fixed volume of diluent, the dilution factor is exactly ½ per step.
The mathematical relationship is:
where is the starting concentration and is the concentration in beaker .
Understanding the Question
You must extend Fig. 1.1 (which already shows beaker 1 at 1.0% CuSO₄ with the first transfer arrow drawn) by drawing extra beakers, labelling the concentration available to use below each beaker, and adding arrows above each beaker showing the volume of C transferred in and the volume of W added. The dilution must halve the concentration between each successive beaker.
Approach
Work out the concentrations first, then add the arrows in the right places:
- Start with 20 cm³ of 1.0% CuSO₄ in beaker 1.
- Take 10 cm³ from beaker 1 into beaker 2, then add 10 cm³ of W to beaker 2 → beaker 2 now holds 20 cm³ at 0.5%.
- Take 10 cm³ from beaker 2 into beaker 3, add 10 cm³ of W → beaker 3 holds 20 cm³ at 0.25%.
- Continue halving for beakers 4 and 5.
Step-by-Step Reasoning
Starting concentration :
For each beaker after the first, 10 cm³ of the previous (more concentrated) solution is transferred in, and 10 cm³ of distilled water W is added to restore the total volume to 20 cm³. The final beaker receives its 10 cm³ from beaker 4 plus 10 cm³ of W but transfers nothing onwards (it is the lowest concentration to use). Each label below a beaker states the volume and concentration available — "10 cm³ of [X]% copper sulfate solution to use" — matching the wording already given under beaker 1.
Key Takeaways
- A halving serial dilution gives concentrations — five useful concentrations plus the W control.
- Each step requires both a transfer of the previous solution and an equal-volume addition of diluent to keep total volume constant.
- The mark scheme requires the concentration sequence, all transfer arrows (10 cm³ each), all water additions (10 cm³ of W each), and the volume/concentration labels under each beaker.
Common Mistakes
- Forgetting to add water back to the beaker — this leaves only 10 cm³ in the beaker and breaks the dilution factor.
- Labelling the wrong concentration under a beaker (e.g. putting 0.5% under the third beaker).
- Using different volumes for the water addition (e.g. adding 20 cm³ of W instead of 10 cm³).
- Putting the % sign inconsistently; the mark scheme requires % stated at least once.
Things to Be Careful About
- The volume available to use is 10 cm³ from each beaker (20 cm³ in beaker 1 is split 10 cm³ for transfer + 10 cm³ to use).
- Beaker 5 has no outgoing transfer arrow — only an incoming transfer from beaker 4 and an incoming water addition.
- The label must include both volume and concentration of solution to use, matching the wording for beaker 1.
Carry out step 1 to step 14.
- Prepare the concentrations of copper sulfate solution as you decided in (a)(ii) and as shown in Fig. 1.1. Use a glass rod to mix the copper sulfate solutions and water.
- Label the large test-tubes with the concentrations of copper sulfate solution prepared in step 1.
- Put of 1.0% copper sulfate solution into the appropriately labelled test-tube.
- Repeat step 3 with the other concentrations you prepared in step 1.
- Label another large test-tube W. Put of W into this test-tube using a clean syringe.
- Use the marker pen to draw one line on the small test-tube from the bottom, as shown in Fig. 1.2.
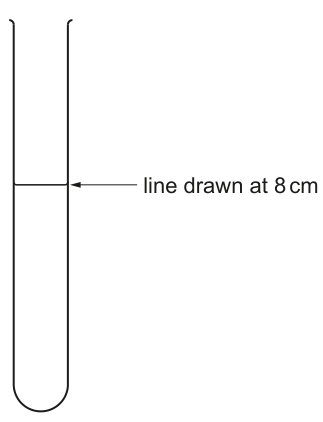
This test-tube will be used to collect the oxygen from the reaction.
- Use the beakers labelled hot water and cold water to set up and maintain a water-bath with water between and .
- Stir Y and put of Y into the test-tube labelled W. Mix thoroughly with a glass rod. Put this test-tube into the water-bath.
- Put the test-tube you prepared in step 6 into the container of water labelled T. Make sure that the test-tube is fully immersed and that there is no air in it, as shown in Fig. 1.3.
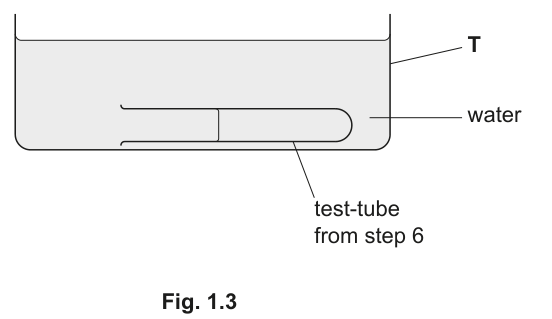
Fig. 1.4 shows the apparatus you will set up for collecting the oxygen from the reaction.
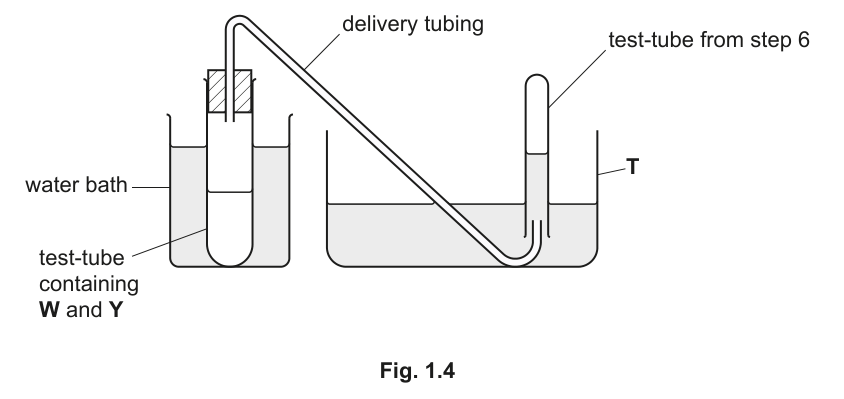
- Set up the apparatus as shown in Fig. 1.4. The reaction will start as soon as you add H in step 12. The oxygen produced in this reaction will collect in the small test-tube, displacing the water from this test-tube. The water level in this test-tube will start to fall.
- Take the bung out of test-tube W.
- Put of H into this test-tube and replace the bung and immediately start timing.
- When the level of water in the small test-tube reaches the line, stop timing and record the result in (a)(iii). If the time taken is more than 180 seconds, record the result as 'more than 180'.
- Repeat step 8 to step 13 using the test-tubes of copper sulfate solution prepared in step 3 and in step 4, instead of test-tube W. Start with the test-tube with the lowest concentration of copper sulfate.
Record your results in an appropriate table.
Answer
| Percentage concentration of copper sulfate solution (%) | Time / s |
|---|---|
| 0.000 | (e.g. 25) |
| 0.0625 | (e.g. 30) |
| 0.125 | (e.g. 38) |
| 0.250 | (e.g. 52) |
| 0.500 | (e.g. 80) |
| 1.000 | (e.g. 140 or 'more than 180') |
- IV heading percentage concentration of copper sulfate solution (%) is on the left of the table.
- DV heading time / s is on the right with unit in the heading.
- Times are recorded in whole seconds (no decimals).
- The 1.0% concentration is expected to give the longest time because higher [CuSO₄] inhibits catalase more strongly. The 0% control (distilled water, W) gives the shortest time.
Values shown in parentheses are representative examples — the actual times will depend on the candidate's experiment. The trend (longer time with higher % CuSO₄) is what the mark scheme credits.
Table with concentration (%) on the left and time (s) on the right; times recorded as whole seconds; longest time at the highest concentration.
Background Concept
Results tables in CIE Paper 3 follow strict conventions. Each column must have a heading that includes both a quantity and a unit. The independent variable (the one deliberately changed by the experimenter) is placed in the left-hand column and the dependent variable (the one measured) on the right. Decimal places must be consistent down a column. Where the dependent variable is a time measured by stop-clock, the value should be recorded in whole seconds (rounded, not given with spurious decimal precision).
In this experiment yeast catalase decomposes hydrogen peroxide:
Copper sulfate is a non-competitive inhibitor of catalase (it binds away from the active site and distorts the enzyme's tertiary structure). Higher inhibitor concentrations therefore slow the reaction more, so the time taken to collect a fixed volume of oxygen increases with [CuSO₄].
Understanding the Question
After performing steps 1–14 the candidate times how long it takes the water level inside the inverted small test-tube to fall to the 8 cm mark as oxygen displaces water. The candidate records their own times for each of the six conditions: 0% (W control), 0.0625%, 0.125%, 0.25%, 0.5%, 1.0%.
Approach
Build a clean two-column table with the IV (% CuSO₄) on the left, headed by a quantity-plus-unit label, and the DV (time) on the right, also with a unit. Record each time as a whole number of seconds. The expected trend is monotonic: time increases with concentration.
Step-by-Step Reasoning
- Heading for the independent variable — "Percentage concentration of copper sulfate solution (%)". The unit % is in the heading (not in the body). The mark scheme explicitly requires the IV to be on the left.
- Heading for the dependent variable — "Time / s". Unit s placed in the heading, not the body.
- Rows — six rows, one for each concentration tested, in ascending concentration order so the trend reads from top to bottom.
- Data — each value is the time in whole seconds taken for the water to fall to the line. If the reaction had not finished within 180 s the recording must be the literal phrase 'more than 180'.
- Expected trend — the longest time must be at the highest percentage of CuSO₄ (1.0%), because more inhibitor slows catalase more. The control (0%, W) should give the shortest time.
Representative (illustrative) times that demonstrate the trend:
These are example values only — the candidate's actual times depend on the activity of their yeast suspension and the temperature of the water bath, but the order must be monotonic.
Key Takeaways
- IV on the left, DV on the right; both headed by quantity + unit.
- Whole-second precision for stop-clock times; 'more than 180' is the correct way to record a reaction that did not complete.
- The trend must be longest time = highest [CuSO₄], because higher inhibitor concentration slows the enzyme.
Common Mistakes
- Putting the DV (time) on the left of the table — this loses the IV-heading mark.
- Recording times like "0:35" or "35.5 s" or "35 s (approx.)" — whole seconds with no other formatting.
- Writing the unit inside the body cells ("30 seconds", "40 s") instead of in the heading.
- Reversing the trend or showing non-monotonic data — likely to lose the trend mark unless justified.
Things to Be Careful About
- Six rows are expected (0%, 0.0625%, 0.125%, 0.25%, 0.5%, 1.0%); the mark scheme requires at least five.
- 'more than 180' is acceptable as a recording if the reaction was very slow.
- The expected trend (highest % = longest time) is the fifth marking point and must be visible from the recorded values.
State the independent variable in this experiment.
Answer
The independent variable is the percentage concentration of copper sulfate solution (the concentration of inhibitor added to the reaction mixture).
(Percentage) concentration of copper sulfate (solution)
Background Concept
In any controlled experiment the independent variable (IV) is the factor the experimenter deliberately changes between trials, the dependent variable (DV) is the factor measured as the outcome, and all other factors are controlled (kept constant). Identifying these correctly is the first step in designing or interpreting an experiment.
Understanding the Question
The candidate has just carried out an investigation in which several different concentrations of copper sulfate were tested. The question asks which factor was the IV — i.e. what was being deliberately varied.
Approach
Look at the method: a series of different concentrations of CuSO₄ were prepared by serial dilution, and the time for a fixed volume of oxygen to be collected was measured for each. The thing being changed from one trial to the next is therefore the CuSO₄ concentration; the thing being measured is the time.
Step-by-Step Reasoning
- The serial dilution prepared six different CuSO₄ concentrations: 0% (W control), 0.0625%, 0.125%, 0.25%, 0.5%, 1.0%.
- For each of these, the time taken for the water level to fall to the 8 cm line was measured.
- What is varied = concentration of copper sulfate solution.
- What is measured = time for oxygen collection.
So the IV is the concentration of copper sulfate solution.
Key Takeaways
- IV is what the experimenter changes deliberately (the serial dilution provides a series of values).
- DV is what is measured (time here).
- All other variables (volume of yeast, volume of H₂O₂, temperature, total reaction volume) are controlled.
Common Mistakes
- Saying "copper sulfate" without specifying concentration — this conflates the substance with the variable.
- Stating the DV (time, or volume of oxygen) instead of the IV.
- Confusing "independent" with "controlled" variables.
Things to be Careful About
- The mark scheme accepts '(percentage) concentration of copper sulfate (solution)' but rejects "copper sulfate" alone.
- Include both "percentage" and "concentration" for clarity, plus the word solution or CuSO₄.
Think about how you would modify this procedure to investigate the effect of temperature on the breakdown of hydrogen peroxide.
Describe how the independent variable will be changed to investigate temperature.
Answer
- Set up several thermostatically controlled water-baths at different temperatures, e.g. five temperatures between and (such as , , , , ).
- Equilibrate the yeast suspension Y and the hydrogen peroxide H to the required temperature in the water-bath before mixing them, so that the reaction starts at the chosen temperature.
- Keep the concentration of copper sulfate (and all other variables) constant; only temperature is varied.
This gives a clean investigation of the effect of temperature on catalase activity (an enzyme-controlled reaction).
Use thermostatically-controlled water-baths at (at least) five different temperatures between 0 °C and 100 °C, and equilibrate Y and H to the chosen temperature before mixing.
Background Concept
Enzyme activity is strongly affected by temperature. As temperature rises, kinetic energy increases and the rate of successful enzyme–substrate collisions rises, but beyond the optimum temperature the enzyme denatures and activity falls sharply. To investigate the effect of temperature you must hold all other variables (pH, substrate concentration, enzyme concentration, inhibitor concentration) constant and vary only the temperature. A water-bath is the standard tool for maintaining a reaction mixture at a chosen temperature.
Understanding the Question
You are asked to modify the existing CuSO₄-inhibition experiment so that it instead investigates the effect of temperature on the breakdown of hydrogen peroxide. Specifically, you must describe how the independent variable will be changed. (How the temperature will be measured / controlled and what range of values to use.)
Approach
The existing experiment changes concentration of CuSO₄ between trials. To investigate temperature instead:
- Hold CuSO₄ concentration at a fixed value (e.g. none / W, or a constant low concentration).
- Replace concentration variation with temperature variation.
- Use multiple water-baths at chosen temperatures.
- Allow the reactants to equilibrate to the target temperature before mixing, so the reaction begins at that temperature.
Step-by-Step Reasoning
- Apparatus: several thermostatically-controlled water-baths (one per temperature tested).
- Range and interval: at least five different temperatures spaced across a sensible range. CIE typical practice is to ; representative choices are (or wider: ).
- Procedure: place each reaction tube in its water-bath and leave it to equilibrate for a fixed time (e.g. 2 minutes) so that the contents reach the bath temperature before mixing yeast and hydrogen peroxide.
- Start timing when the H₂O₂ is added and measure the same outcome (time to collect oxygen to the 8 cm line, or volume of oxygen in a fixed time).
- Keep all other variables constant: same volume of Y (5 cm³), same volume of H (2 cm³), same concentration of CuSO₄ (e.g. none / W), same total volume, same small test-tube.
Key Takeaways
- A valid investigation of temperature requires varying temperature while holding every other variable constant.
- Equilibration before mixing is essential — otherwise the reaction starts at room temperature and the recorded effect of the bath is partly lost.
- A range of at least five temperatures is required to identify a trend and any optimum.
Common Mistakes
- Saying "change the temperature" without specifying a range or number of values.
- Failing to equilibrate the reactants — reaction starts at a temperature different from that of the bath.
- Changing more than one variable at once (e.g. varying CuSO₄ and temperature).
- Using the word "heat" vaguely instead of "water-bath at a controlled temperature".
Things to be Careful About
- A water-bath is the standard controlled-temperature device; an open Bunsen flame is not a controlled variable.
- Above ~ yeast catalase denatures, so including values up to captures the fall in activity as well as the rise — useful for showing an optimum.
- The mark scheme requires both the water-bath point and at least five different temperatures OR explicit mention of equilibrating before mixing.
A student used a different method to measure the loss of oxygen from the breakdown of hydrogen peroxide.
The student measured the loss of mass after 5 minutes using the apparatus shown in Fig. 1.5.
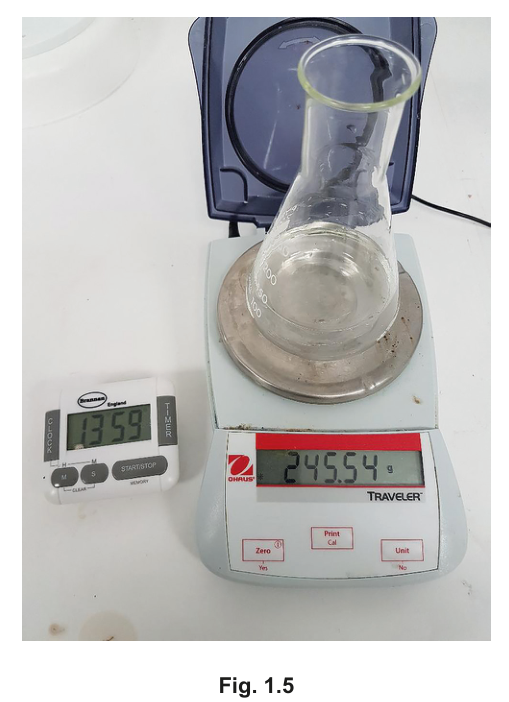
Table 1.2 shows the student’s results.
Table 1.2
| initial mass of reaction mixture / g | final mass of reaction mixture / g | change in mass of reaction mixture / g | percentage change in mass of reaction mixture |
|---|---|---|---|
| 249.55 | 243.31 |
Complete Table 1.2 by calculating the percentage change in mass of the reaction mixture.
You may use the space below for your working.
Working
Answer
- Change in mass =
- Percentage change in mass =
Change in mass = -6.24 g; percentage change = -2.50 %
Background Concept
When a reaction produces a gas that escapes from an open container, the mass of the system falls. The fall in mass equals the mass of gas that has left. The percentage change expresses that loss relative to the starting mass and lets results from reactions of different sizes be compared.
The two formulas are:
The percentage change carries a negative sign when the final mass is less than the initial mass — this is not optional, it tells the reader the sample lost mass.
Understanding the Question
Table 1.2 gives the initial mass (249.55 g) and final mass (243.31 g) of the reaction mixture in the student's conical flask. You must calculate the change in mass and then the percentage change in mass, and write both into the empty cells of Table 1.2.
Approach
Apply the two formulas in order. Subtract the initial mass from the final mass to get the change (negative because mass has been lost as oxygen). Divide by the initial mass and multiply by 100 for the percentage change. Round the percentage change to an appropriate number of significant figures (the input masses are given to 4 sig figs, so the percentage change is quoted to 3 sig figs).
Step-by-Step Reasoning
- Change in mass:
- Percentage change:
Carry out the division:
Multiply by 100:
- Significant figures: the initial and final masses are given to 4 sig figs (249.55, 243.31); the answer should be quoted to 3 sig figs (matching the precision of the change in mass which has only 3 sig figs). is acceptable; is acceptable but loses a sig fig.
Key Takeaways
- The change in mass is final − initial, and is negative when mass is lost.
- Percentage change = (change ÷ initial) × 100; the sign is preserved.
- Match the precision of the answer to the precision of the data given.
Common Mistakes
- Subtracting the wrong way round (initial − final) and getting a positive number.
- Forgetting the negative sign on the percentage change — losing the meaning of "loss of mass".
- Quoting without rounding, or rounding to , which loses precision.
- Using as the denominator and then dividing by instead of , dropping the sign.
Things to be Careful About
- The mark scheme accepts as well as , but rejects (too few sig figs).
- The units for the change in mass are grams (g); the percentage change has no units (it is dimensionless).
- Write the percentage change with its sign in the table.
State how the student can increase the confidence in the result for percentage change in mass.
Answer
Repeat the experiment (at least two more times under identical conditions) and calculate the mean of the percentage changes.
The mean of several repeats is less affected by random error than any single reading, so it gives a more representative value of the true percentage change in mass and increases confidence in the result.
Repeat the experiment and calculate a mean.
Background Concept
The reliability of a quantitative result is judged by how close repeated measurements are to one another (and to the true value). Random errors (e.g. slight variations in starting mass, timing, room temperature, exact volume of H₂O₂) affect each individual reading; their effect is reduced by taking replicates and using their mean as the best estimate of the true value. The more independent repeats, the smaller the standard deviation around the mean and the more confidence one can place in the result.
Understanding the Question
The student has carried out the experiment once and obtained a single percentage change. The question asks how they could increase confidence in that specific result.
Approach
Identify the source of uncertainty: a single measurement. The remedy is replication combined with averaging — the standard technique for improving reliability in any quantitative experiment.
Step-by-Step Reasoning
- The single percentage change () is just one value. It could be too high or too low due to random error in weighing, timing, or reactant volumes.
- To check whether the value is reproducible, repeat the experiment several times under the same conditions.
- Calculate the mean of the resulting percentage changes. The mean is less affected by random fluctuations in any one trial.
- (Optional, not required for the mark) calculate the standard deviation or 95% confidence interval to quantify the spread.
Key Takeaways
- Confidence in a result comes from showing that it can be reproduced.
- The mean of several replicates is a more reliable estimate than any single reading.
- This is true for any quantitative measurement, not just mass-loss experiments.
Common Mistakes
- Suggesting vague "be more careful" or "human error" answers — these do not address the specific issue of a single reading.
- Suggesting a control experiment — that addresses validity, not confidence in this particular value.
- Saying "repeat and take an average" without explicitly mentioning what is being averaged.
Things to be Careful About
- The mark scheme credits only repeat + calculate a mean; one without the other is incomplete.
- This question is about confidence in this result, not about improving the method overall — so changing apparatus or technique is not relevant.
A scientist carried out an investigation into the effect of several different inhibitors on the breakdown of hydrogen peroxide.
All other variables were kept constant.
The results are shown in Table 1.3.
Table 1.3
| inhibitor | volume of oxygen after 5 minutes / |
|---|---|
| N | 8.6 |
| P | 8.2 |
| Q | 4.3 |
| R | 7.8 |
| S | 3.9 |
Draw a bar chart of the data in Table 1.3 on the grid in Fig. 1.6.
Use a sharp pencil for drawing graphs.

Answer
- x-axis: labelled inhibitor, with the five inhibitor letters N, P, Q, R, S placed below the five bars.
- y-axis: labelled volume of oxygen after 5 minutes / , scale from 0 to 10, with major gridlines and labels at 0, 2, 4, 6, 8, 10 (i.e. 2 cm on the grid = 2 cm³).
- Bars (equal width, separated, drawn with thin pencil lines and a clear horizontal top line):
- All five bars must be of equal width and drawn with a sharp pencil.
Bar chart with inhibitor on x-axis (N, P, Q, R, S), volume of O₂ / cm³ on y-axis (0 to 10, scale 2 cm = 2 cm³), bars of equal width and gaps; heights 8.6, 8.2, 4.3, 7.8, 3.9.
Background Concept
A bar chart is the correct display for a discrete (categorical) independent variable. Each bar represents one category, and the bar's height encodes the value of the dependent variable for that category. CIE conventions for bar charts:
- x-axis carries the discrete categories (here the letters N, P, Q, R, S);
- y-axis is a continuous scale of the dependent variable, beginning at 0;
- bars are of equal width, with gaps between them;
- the y-scale should be linear and use at least half the grid;
- bars should be drawn with thin continuous lines, with a clear horizontal top edge.
If the IV were a continuous variable (e.g. concentration on the x-axis), a line graph would be appropriate instead.
Understanding the Question
Table 1.3 lists five different inhibitors (N, P, Q, R, S) and the volume of oxygen collected from each reaction after 5 minutes. The IV is categorical (the identity of the inhibitor) and the DV is continuous (volume of oxygen in cm³). The grid in Fig. 1.6 is supplied blank. You must draw a bar chart of this data, following the conventions above.
Approach
- Choose the y-scale so that the tallest bar fits comfortably and the scale uses at least half the grid. The largest value is 8.6 cm³, so a scale of 0–10 cm³ with major gridlines every 2 cm³ is appropriate.
- Label both axes (quantity + unit on y, category on x).
- Draw five bars of equal width, separated by gaps, with one bar above each inhibitor label.
- Mark each bar's top with a thin horizontal line at the correct height (to the nearest mm on the grid).
Step-by-Step Reasoning
The five data points to plot are:
| Inhibitor | Volume of O₂ after 5 min / cm³ |
|---|---|
| N | 8.6 |
| P | 8.2 |
| Q | 4.3 |
| R | 7.8 |
| S | 3.9 |
The range of values is 3.9 to 8.6 cm³. With 2 cm = 2 cm³, each bar top can be located at:
- N: cm above the x-axis (bar reaches the top label "8") — actually at gridline "8" plus three small squares (since small square on this scale).
- P: , just below N's bar by cm on the grid.
- Q: , just above the "4" gridline by cm.
- R: , just below the "8" gridline by cm.
- S: , just below the "4" gridline by cm.
Key Takeaways
- Use a bar chart for a categorical IV and a line graph for a continuous IV.
- y-axis must begin at 0 and use a sensible scale that occupies at least half the grid.
- Bars are of equal width with gaps, drawn with a sharp pencil and a clear flat top line.
- Both axes must be labelled with quantity + unit.
Common Mistakes
- Drawing a line graph instead of a bar chart (this loses marks because the IV is categorical).
- Leaving the y-axis without a unit (the unit cm³ must be in the heading).
- Using unequal bar widths or omitting the gaps between bars.
- Choosing a scale that does not use at least half the grid (e.g. 0–100 when all values are < 10).
- Plotted bar tops that are visibly off the correct gridline (mark scheme requires plotting accurately).
Things to be Careful About
- The y-axis label must include both the quantity ("volume of oxygen after 5 minutes") and the unit ( in the heading).
- The x-axis label is the word inhibitor — the letters N, P, Q, R, S go under the bars, not as the axis title.
- 2 cm on the grid = 2 cm³ (i.e. 1 cm = 1 cm³) is a natural and recommended scale.
One of the inhibitors in Table 1.3 is a competitive inhibitor.
Explain how competitive inhibitors affect an enzyme-controlled reaction.
Answer
A competitive inhibitor:
- has a shape similar to the substrate;
- therefore has a shape complementary to the active site of the enzyme;
- binds to the active site, competing with the substrate for it;
- as a result, fewer enzyme–substrate complexes (ESCs) form, so the reaction rate falls.
(Any three of these points are sufficient for full marks.)
The inhibitor resembles the substrate, fits the active site, and so competes with the substrate for the active site, reducing the number of enzyme-substrate complexes formed.
Background Concept
Enzymes are biological catalysts with an active site — a small region whose three-dimensional shape is complementary to the substrate. The substrate binds to the active site to form an enzyme–substrate complex (ESC); the enzyme then catalyses the conversion of substrate to product.
Enzyme inhibitors reduce the rate of an enzyme-controlled reaction. There are two main classes:
- Competitive inhibitors have a shape similar to the substrate and bind reversibly to the active site. They compete with the substrate for the active site, but inhibition can be overcome by adding more substrate.
- Non-competitive inhibitors bind to a site other than the active site (an allosteric site), changing the enzyme's shape so the substrate can no longer bind. Inhibition cannot be overcome by adding more substrate.
Understanding the Question
Table 1.3 shows that different inhibitors give very different rates of oxygen production, suggesting they inhibit the catalase enzyme to different extents. The question states that one of these inhibitors is competitive and asks you to explain how competitive inhibitors affect an enzyme-controlled reaction in general.
Approach
The explanation should connect four ideas in order: shape similarity to substrate → fits the active site → competes with substrate → fewer ESCs form → reaction slows. Each link in the chain is a mark.
Step-by-Step Reasoning
- Shape similarity: the inhibitor's overall three-dimensional shape resembles that of the substrate (the natural substrate of catalase is hydrogen peroxide, H₂O₂). This is why the inhibitor is recognised by the enzyme's active site at all.
- Complementary to active site: because the inhibitor is similar in shape to the substrate, it has a complementary shape to the active site of the enzyme. It therefore fits into the active site where the substrate would normally bind.
- Competition: the inhibitor binds to the active site, occupying it in place of the substrate. The substrate and inhibitor compete for the same site. This is reversible — the inhibitor can leave and the substrate can then bind.
- Consequence: because some active sites are occupied by inhibitor instead of substrate, the number of enzyme-substrate complexes (ESCs) formed per unit time falls. The reaction rate therefore decreases. (Note that adding more substrate can out-compete the inhibitor and restore the rate.)
In the data of Table 1.3, a competitive inhibitor would be the one with the smallest volume of oxygen unless substrate concentration is saturating; a non-competitive inhibitor would still produce a low volume of oxygen even at very high substrate concentration.
Key Takeaways
- Competitive inhibition depends on shape mimicry of the substrate.
- The inhibitor and substrate compete for the same active site.
- The inhibition is reversible and is overcome by high substrate concentrations.
- The consequence is fewer ESCs and a lower reaction rate.
Common Mistakes
- Saying the inhibitor "blocks the active site" without mentioning its shape similarity to the substrate — this misses the mechanistic reason why the inhibitor can fit the site.
- Confusing competitive with non-competitive inhibition (e.g. saying the inhibitor binds to a different site).
- Saying the inhibitor "destroys" or "denatures" the enzyme — competitive inhibitors do not alter the enzyme's tertiary structure.
- Omitting the consequence (fewer ESCs, slower rate).
Things to be Careful About
- The mark scheme awards any three of the four listed points; including all four is safest.
- The term enzyme-substrate complex (ESC) is required — "enzyme-substrate" alone is too vague.
- Avoid using the word "competitive" as the explanation (it is the term being defined).
The rest of this paper
1 more questions- Q2Use of the Light Microscope · Presentation of Data and Observations · Analysis, Conclusions and Evaluation18M