Biology 9700/34 — May/June 2020
Cambridge AS Level · Advanced Practical Skills · worked solutions for every part, with the mark scheme
Topics Presentation of Data and Observations · Analysis, Conclusions and Evaluation · Manipulation, Measurement and Observation · Use of the Light Microscope
When potato cells are placed into different concentrations of sodium chloride solution, water moves between the sodium chloride solution and the potato cells.
You will investigate the effect of different concentrations of sodium chloride solution on potato tissue.
You will need to:
- prepare different concentrations of sodium chloride solution, S
- put potato tissue into the different concentrations of sodium chloride solution
- record the distance the potato tissue bends
- use your results to estimate the concentration of an unknown concentration of sodium chloride solution, U.
You are provided with the materials shown in Table 1.1.
Table 1.1
| labelled | contents | hazard | volume / |
|---|---|---|---|
| P | 7 pieces of potato tissue | none | — |
| S | 10% sodium chloride solution | none | 200 |
| U | unknown concentration of sodium chloride | none | 50 |
| W | distilled water | none | 200 |
It is recommended that you wear suitable eye protection.
You will need to prepare different concentrations of sodium chloride solution, using proportional dilution.
You will need to prepare of each concentration, using S and W.
Table 1.2 shows how to make up two of the concentrations of sodium chloride solution you will use.
Decide which other concentrations of sodium chloride solution you will use.
Complete Table 1.2 to show how you will prepare the concentrations of sodium chloride solution you will use.
Table 1.2
| percentage concentration of sodium chloride | volume of S / | volume of W / |
|---|---|---|
| 10 | 50 | 0 |
| 0 | 0 | 50 |
Decide the volume of sodium chloride solution you will use to cover the piece of potato tissue.
State the volume of sodium chloride solution you will use.
volume = ______
- Prepare the concentrations of sodium chloride solution as shown in Table 1.2, in the beakers provided. Mix well.
- Label the Petri dishes with the concentrations of sodium chloride solution prepared in step 1.
- Label another Petri dish U.
- Put a piece of potato tissue into each of the Petri dishes you have labelled.
You will need to cover the piece of potato tissue in each Petri dish with the appropriate sodium chloride solution prepared in step 1, as shown in Fig. 1.1.

- Put the volume of each concentration of sodium chloride solution you have decided in (a)(ii) into the appropriately labelled Petri dish.
- Repeat step 5 using U.
- Leave the pieces of potato tissue in the sodium chloride solutions for 20 minutes.
While you are waiting, use your time to continue with Question 1.
You will use graph paper to measure how far the pieces of potato tissue bend after being left for 20 minutes in the sodium chloride solutions.
Fig. 1.2 shows how you will prepare the graph paper, as described in step 8 and step 9.
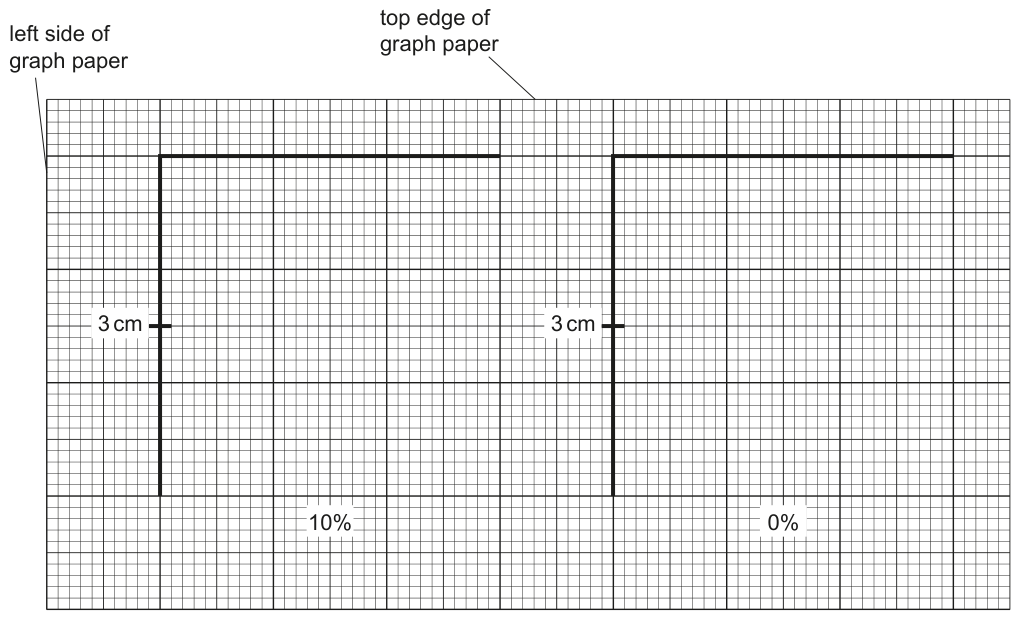
- On the graph paper provided, draw two lines at right angles to each other, as shown in Fig. 1.2. Each line should be approximately long.
Draw a mark on the vertical line below where the vertical line meets the horizontal line, as shown in Fig. 1.2. - On the same piece of graph paper repeat step 8 for each of the other concentrations of sodium chloride solution and for U.
- After 20 minutes (step 7) remove the piece of potato tissue from the 10% sodium chloride solution and put it onto a paper towel to remove the excess liquid.
- Put the piece of potato tissue on the vertical line of the graph paper, as shown in Fig. 1.3.
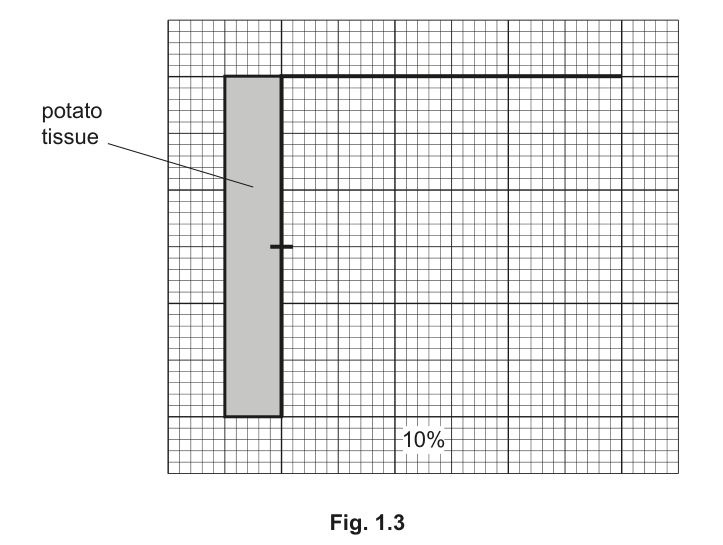
- Put your finger on the middle of the potato tissue at the mark and press firmly, as shown in Fig. 1.4.
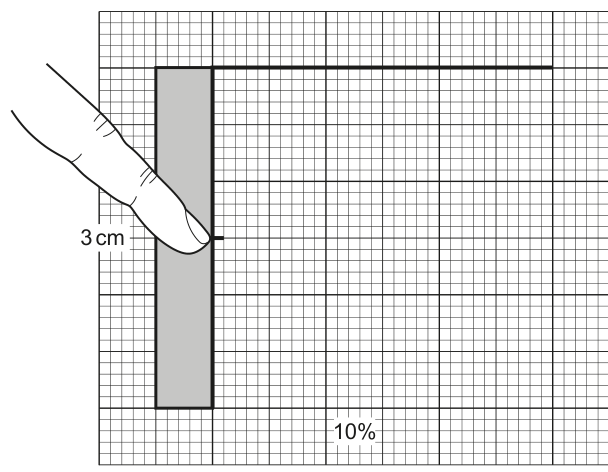
- Hold the potato tissue firmly in this position. Move the top of the potato tissue, as shown in Fig. 1.5, until there is some resistance.
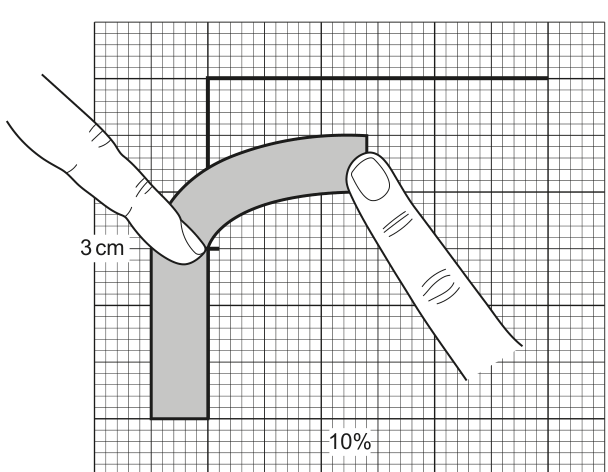
- Mark the position of the top of the potato tissue on the graph paper, as shown in Fig. 1.6.
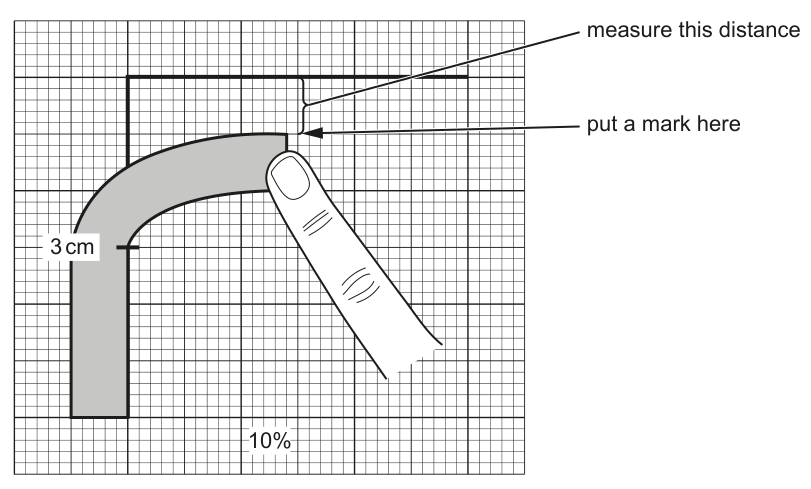
- Remove the potato tissue and put it in the container labelled For waste.
- Measure the distance between the mark and the horizontal line on the graph paper, as shown in Fig. 1.6.
- Record your result in (a)(iii).
- Repeat step 10 to step 17 using the potato tissue from the other concentrations of sodium chloride solution.
- Repeat step 10 to step 16 using the potato tissue from U. Record your result for U in (a)(iv).
Record your results in an appropriate table.
State the result for U. Use your results in (a)(iii) to estimate the concentration of sodium chloride in U.
result for U = ______
estimate = ______ %
Explain, in terms of water potential, the difference between the result for 10% sodium chloride solution and the result for 0% sodium chloride solution.
State the dependent variable.
Suggest how you could make improvements to the procedure so that a more accurate estimate of the concentration of sodium chloride in U can be obtained.
A systematic error may occur when a piece of apparatus with a scale is used.
State one piece of apparatus used in this investigation that may have a systematic error.
Suggest whether this affected your results and give a reason for your answer.
A scientist carried out an investigation into the effect of temperature on the number of molecules of a substance diffusing through a cell membrane in a set time.
The results are shown in Table 1.3.
Table 1.3
| temperature / | number of molecules per |
|---|---|
| 5 | 2 |
| 15 | 4 |
| 40 | 9 |
| 63 | 18 |
| 92 | 30 |
Plot a graph of the data in Table 1.3 on the grid in Fig. 1.7.
Use a sharp pencil for drawing graphs.

Describe and explain the trend in your graph.
description
explanation
The rest of this paper
1 more questions- Q2Use of the Light Microscope · Analysis, Conclusions and Evaluation · Presentation of Data and Observations18M