Biology 9700/35 — October/November 2019
Cambridge AS Level · Advanced Practical Skills · worked solutions for every part, with the mark scheme
Topics Manipulation, Measurement and Observation · Presentation of Data and Observations · Analysis, Conclusions and Evaluation · Use of the Light Microscope
Agar cubes that have been stained with a blue indicator can be used to investigate diffusion.
When ascorbic acid, A, diffuses into a stained agar cube, it causes the cube to decolourise (the blue colour disappears).
The end-point is reached when the cube has decolourised.
You will investigate the effect of changing the surface area to volume ratio of agar cubes on the diffusion of ascorbic acid by:
- cutting a block of stained agar, B, into cubes of different sizes
- putting cubes of different sizes into ascorbic acid, A
- recording the time taken for each size of agar cube to reach the end-point.
You are provided with the materials shown in Table 1.1.
Table 1.1
| labelled | contents | hazard | volume / |
|---|---|---|---|
| A | 10% ascorbic acid solution | none | 120 |
| B | one stained agar block | none | — |
Use the blunt forceps and paper towel to handle the agar block.
If any of the materials come into contact with your skin, wash off immediately under cold water.
It is recommended that you wear suitable eye protection.
You will need to cut agar cubes of different sizes from the agar block, B.
The largest cube you will cut is , as shown in Fig. 1.1.
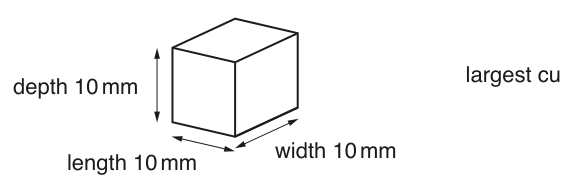
Decide on the sizes of the other agar cubes you will investigate.
Complete Table 1.2 to show the sizes of agar cubes you will investigate.
The first row, for the largest cube, has been completed for you.
Table 1.2
| length width depth of cube / | surface area / | volume / | surface area : volume |
|---|---|---|---|
| 600 | 1000 | ||
Carry out step 1 to step 13.
Use the blunt forceps and paper towel to handle the pieces of agar.
- Draw a grid on the graph paper as shown in Fig. 1.2.
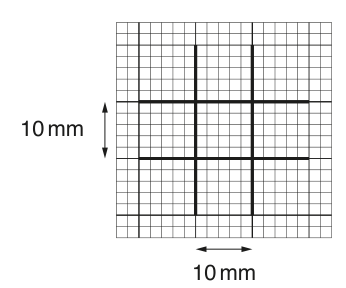
- Put the graph paper into the plastic wallet and put it on the white tile.
- Cut a small piece of agar from block B. Put the small piece of agar on the plastic wallet so that it is on top of the grid (drawn in step 1).
- Cut the small piece of agar so that each side is , using the grid as a guide, as shown in Fig. 1.3.
You will need to turn the piece of agar to make sure that each side is cut to .
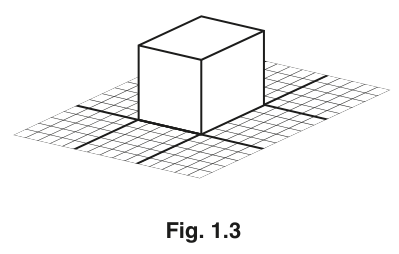
- Label a beaker 10 x 10 x 10 and put the agar cube you have cut into this beaker.
- Put any waste pieces of agar into the container labelled For waste.
- Remove the graph paper from the plastic wallet.
- Draw on the graph paper a grid for each of the sizes of agar cube as stated in Table 1.2.
- Repeat step 2 to step 6 with each of the sizes of agar cube as stated in Table 1.2.
- Put of A into the beaker labelled 10 x 10 x 10.
- Repeat step 10 with each of the other beakers you have labelled.
- Start timing.
- Record the time taken for each agar cube to reach the end-point (the agar cube has decolourised).
Do not stop the timer – keep it running continuously.
If any agar cube remains blue after 900 seconds, stop timing and record ‘more than 900’.
Record your results in an appropriate table.
Describe the trend in your results.
State one way in which you could improve the confidence in your results.
Describe a suitable control for this investigation.
Using your knowledge of diffusion and your answers in (a)(ii) and (a)(iii), suggest reasons why a low surface area to volume ratio could be a disadvantage to an organism.
Table 1.3 shows three possible sources of error when carrying out the investigation described by step 1 to step 13.
Complete Table 1.3 by stating the type of error as systematic or random and the effect on the trend seen in the results. The first one has been completed for you.
Table 1.3
| source of error | type of error | effect on trend |
|---|---|---|
| the mark on the syringe used to measure the volume of A actually measured | systematic | no effect as the same syringe was used each time |
| the agar block, B, had lumps in it where it was not dissolved properly | ||
| it was difficult to judge the end-point |
The procedure, described by step 1 to step 13, investigated the effect of surface area to volume ratio on diffusion, using the time taken to reach the end-point.
Think about how you could modify this procedure to investigate the effect of ascorbic acid concentration on the time taken to reach the end-point.
The size of the agar cube should be standardised.
Look at your results in (a)(ii) and state a size of agar cube that is appropriate to use.
size of agar cube = ______
Describe how you would modify the procedure to investigate the effect of ascorbic acid concentration on the time taken to reach the end-point.
Ascorbic acid is found in plants.
Iodine solution can be used to determine the concentration of ascorbic acid in a plant extract.
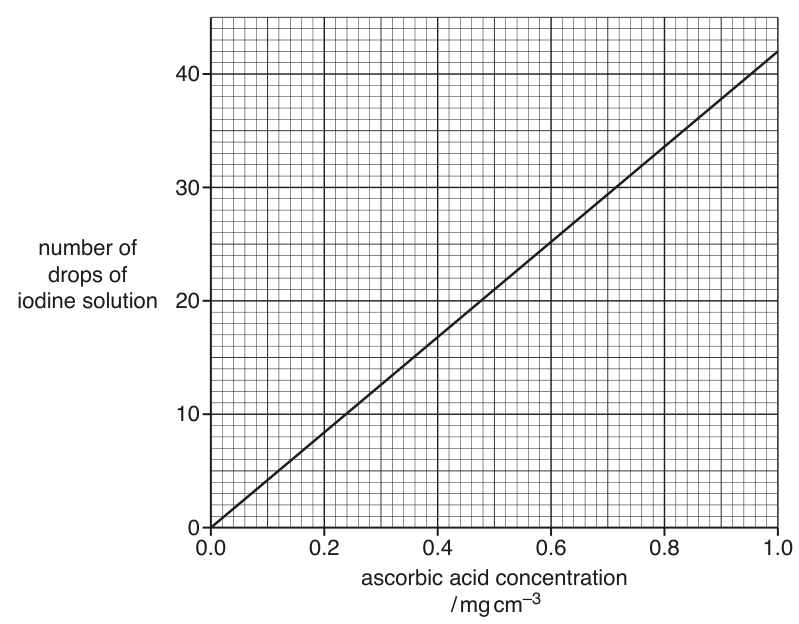
Fig. 1.4 shows a calibration graph that can be used to estimate the concentration of ascorbic acid in a plant extract.
A student carried out an investigation to compare the concentration of ascorbic acid in different plant extracts.
The results are shown in Table 1.4.
Table 1.4
| plant extract | number of drops of iodine solution | ascorbic acid concentration / |
|---|---|---|
| C | 40 | 0.95 |
| D | 8 | 0.19 |
| E | 26 | 0.62 |
| F | 13 | |
| G | 2 | 0.04 |
Using the graph in Fig. 1.4, complete Table 1.4 for plant extract F.
Plot a bar chart of the data in Table 1.4 on the grid in Fig. 1.5.
Use a sharp pencil for drawing graphs.
The rest of this paper
1 more questions- Q2Use of the Light Microscope18M