Biology 9700/34 — October/November 2019
Cambridge AS Level · Advanced Practical Skills · worked solutions for every part, with the mark scheme
Topics Analysis, Conclusions and Evaluation · Manipulation, Measurement and Observation · Presentation of Data and Observations · Use of the Light Microscope
When plant tissue is soaked in methylene blue solution, the solution enters the tissue and stains it blue. When the stained plant tissue is placed into solutions of different pH, methylene blue is released from the plant cells.
A student investigated the effect of pH on the release of methylene blue from the cells of potato tissue.
The student suggested the following hypothesis:
The lower the pH of the solution surrounding the potato tissue, the more methylene blue will be released into the solution.
You will investigate this hypothesis by comparing the release of methylene blue from potato tissue at different pH values.
- The pH values will be changed using buffers, P2, P3, P4, P5 and P6.
- Buffer PU has an unknown pH.
You are provided with the materials shown in Table 1.1.
Table 1.1
| labelled | contents | hazard | volume/ |
|---|---|---|---|
| P2 | buffer solution pH 2 | none | 25 |
| P3 | buffer solution pH 3 | none | 25 |
| P4 | buffer solution pH 4 | none | 25 |
| P5 | buffer solution pH 5 | none | 25 |
| P6 | buffer solution pH 6 | none | 25 |
| PU | buffer solution of unknown pH | none | 25 |
| W | distilled water | none | 200 |
| B | 3 potato cylinders stained with methylene blue, in distilled water | none | – |
Use the forceps to handle the potato cylinders.
If any solution comes into contact with your skin, wash off immediately under cold water.
It is recommended that you should wear suitable eye protection.
Methylene blue can stain skin and clothing.
Carry out step 1 to step 17. Use forceps when handling potato cylinders.
- Pour the water surrounding the potato cylinders in B into the container labelled For waste.
- Pour distilled water from the beaker labelled W into B so that the potato cylinders are covered. Stir gently with the glass rod.
- Put the potato cylinders onto the white tile using the forceps.
Measure the length of each potato cylinder in mm.
Record your measurements in Table 1.2.
Table 1.2
| potato cylinder | length/mm |
|---|---|
| 1 | |
| 2 | |
| 3 |
Answer
Record three lengths, e.g. (representative values):
| potato cylinder | length/mm |
|---|---|
| 1 | 30 |
| 2 | 30 |
| 3 | 30 |
e.g. 30, 30, 30 mm
Background Concept
Length is a continuous variable and is best measured with a ruler laid alongside the object, with the zero of the scale aligned to one end and the reading taken at the other end. Because the potato cylinders are small (a few cm long) the measurement is most usefully recorded in millimetres, and the precision of the ruler (typically 1 mm) should determine the precision of the recording.
Understanding the Question
Step 4 of the procedure asks the candidate to measure the length of each of the three stained potato cylinders in mm and to write the three measurements in Table 1.2. The mark is awarded for collecting three reasonable lengths (the mark scheme accepts whole numbers or values to 0.5 mm). The candidate's own values are accepted; there is no single correct answer because the actual cylinders are provided to each candidate.
Approach
Lay the cylinder next to a mm ruler, read the length at the opposite end, and record to the nearest mm or 0.5 mm. Repeat for all three cylinders. Keep the values realistic (typically 20–50 mm for a cork-borer-sized cylinder) and record in Table 1.2.
Step-by-Step Reasoning
The cylinder should be handled with forceps to avoid dye on the hands. The reading is taken at the far end of the cylinder, perpendicular to the ruler. Three measurements are required, one per row of Table 1.2. The values entered must be whole numbers or end in .5 (i.e. recorded to the precision of the mm ruler, not more decimal places).
Key Takeaways
In Paper 3 the candidate records their own measurements; marks are given for sensible values and correct precision, not for a single 'right answer'.
Common Mistakes
- Recording the values in cm (or with extra decimal places such as 30.27 mm) — the unit asked for is mm and the precision should not exceed that of the ruler.
- Reading the cylinder at an angle, which underestimates the true length.
Things to Be Careful About
Use forceps to avoid methylene blue staining the skin. Keep the cylinder aligned along the ruler.
The potato cylinders all have the same diameter.
Describe how you will standardise the surface area of each potato cylinder.
Answer
Cut all the potato cylinders to the same length (e.g. with a razor blade / scalpel, using a ruler as a guide), so that each has the same surface area.
cut all cylinders to the same length
Background Concept
The amount of methylene blue released from potato tissue depends on the surface area of tissue exposed to the surrounding buffer: more surface area means more dye can leave the cells per unit time. To compare the effect of pH fairly, surface area must be controlled.
Understanding the Question
The stem tells the candidate that all three potato cylinders already have the same diameter. The question asks how the surface area of each cylinder can be standardised. Because the diameter is fixed, equal surface area is achieved by making the lengths equal.
Approach
Surface area of a cylinder of fixed diameter is proportional to length. Equal length → equal surface area. Therefore the practical control is to cut each cylinder to the same length.
Step-by-Step Reasoning
Place a cylinder on a white tile (the stem has already transferred the cylinders to the tile in step 3). Using a ruler and a sharp blade, trim the ends so that all three cylinders are the same length. This gives equal surface area, isolating pH as the only variable that should affect the rate of dye release.
Key Takeaways
Identifying the variables that must be controlled is a core Paper 3 skill. Here, the diameter is given as already equal, so length is the remaining source of variation in surface area.
Common Mistakes
- Suggesting changing the diameter (the stem says it is the same for all three cylinders).
- Vague answers such as 'use the same amount of potato' — that does not specify how surface area is equalised.
Things to Be Careful About
The control should be specific and achievable with the apparatus listed. Cutting to the same length uses the ruler and scalpel / razor already implied by the procedure.
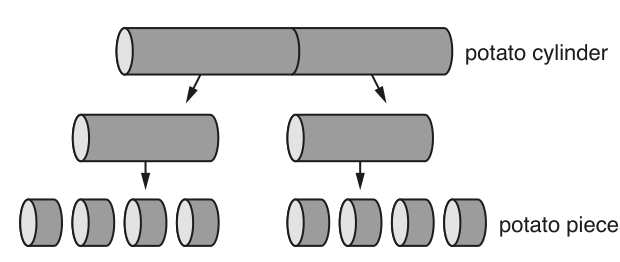
Cut one potato cylinder into two pieces and then cut each piece into four smaller pieces, as shown in Fig. 1.1. Repeat for the other two potato cylinders.
- Put the potato pieces into beaker B. Repeat step 2.
- Put four potato pieces into each of six test-tubes.
- Label the six test-tubes using the labels P2, P3, P4, P5, P6 and PU.
Buffer solution will be added to the pieces of potato in each test-tube.
The volume of buffer solution surrounding the plant tissue in the test-tube is a variable that must be standardised.
Think about how you will standardise the volume of buffer solution.
State the volume of buffer solution that you will use in each test-tube.
volume = ______
Answer
volume = 5 (of buffer, added to each test-tube).
e.g. 5 cm³
Background Concept
The amount of methylene blue released into the surrounding liquid will be diluted by the buffer. If different volumes of buffer are used in different tubes, the colour intensity observed will depend partly on dilution as well as on pH. To compare pH fairly, the same volume of buffer must be added to every tube.
Understanding the Question
Step 7 has the candidate prepare six labelled tubes, each containing four potato pieces. Before adding buffer, the candidate must state a single volume of buffer that will be added to each tube so that pH is the only variable affecting the colour observed.
Approach
Choose a volume that (a) is enough to cover the four potato pieces in the test-tube, (b) can be measured easily with the apparatus available (typically a 10 cm³ measuring cylinder or a graduated syringe), and (c) is the same in every tube. A small whole number is easiest to measure accurately; is a typical acceptable choice that completely covers the pieces and is small enough to give a detectable colour change.
Step-by-Step Reasoning
With four potato pieces sitting in the bottom of a test-tube, around 5 of buffer covers them adequately. This volume can be measured with a measuring cylinder to a precision of about . Whatever volume is chosen, it must be stated clearly with a unit and used identically in all six tubes.
Key Takeaways
In Paper 3, every controlled variable must be operationalised — a number with a unit. 'Same volume' on its own is not enough; the volume itself must be stated.
Common Mistakes
- Giving a volume without a unit (e.g. just '5').
- Choosing a volume that does not cover the potato pieces, or a volume that is too large to be measured accurately with the equipment provided.
Things to Be Careful About
Make sure the chosen volume is realistic for the apparatus (measuring cylinder / syringe). Volumes much above become harder to measure precisely with a 10 cm³ cylinder.
- Put the volume of buffer solution P2 stated in (a)(iii) into the appropriately labelled test-tube.
- Repeat step 8 for each of the other buffer solutions P3, P4, P5, P6 and PU.
- Put a bung into the test-tube labelled P2 and mix the contents.
- Remove the bung from the test-tube and rinse the bung with water in the beaker labelled For washing.
- Repeat step 10 and step 11 with the remaining test-tubes.
- Leave the test-tubes in the test-tube rack for 10 minutes.
While you are waiting, use your time to continue with Question 1.
- After 10 minutes, shake each test-tube and pour the liquid into six clean test-tubes.
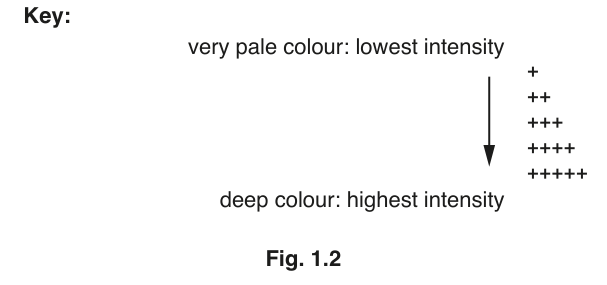
Fig. 1.2 shows the key you need to use to record your results.
Key:
- Observe the liquid in each test-tube.
It may help to observe the liquid with a piece of white card behind the test-tube.
You may observe the same intensity in more than one test-tube.
- Record your results for P2, P3, P4, P5 and P6 in (a)(iv) using the symbols shown in the key in Fig. 1.2.
Record your results in an appropriate table for P2, P3, P4, P5 and P6.
Answer
| pH | colour intensity |
|---|---|
| 2 | +++++ |
| 3 | ++++ |
| 4 | +++ |
| 5 | ++ |
| 6 | + |
See working — table with pH and colour intensity (lower pH → higher intensity).
Background Concept
When a variable (here, pH) is qualitative or difficult to measure directly, an ordinal scale can be used to record the observation. The key in Fig. 1.2 provides five levels, from '+' (very pale, lowest intensity) to '+++++' (deep, highest intensity). A results table must have a clear heading for the independent variable (pH) and a clear heading for the dependent variable (colour intensity), with each buffer recorded against the symbol that best matches what is seen.
Understanding the Question
After 10 minutes, the candidate shakes each tube, pours the liquid into a clean tube, and records the colour intensity for P2, P3, P4, P5 and P6 using the symbols in the key. The expected outcome is that lower pH releases more methylene blue from the cells, so the most acidic tube (P2) should be most intensely coloured and the least acidic (P6) the palest.
Approach
Hold each tube against a white card (as the procedure suggests), compare the colour to the key, and write the matching symbol in the table. The trend should run from most intense at low pH to least intense at high pH if the hypothesis is correct.
Step-by-Step Reasoning
Five marks are available: (1) the column 'pH'; (2) a column headed for the dependent variable, here 'colour intensity'; (3) results for all five pH values; (4) the correct trend, i.e. more intense at low pH and less intense at high pH; (5) results recorded using the +, ++, +++, ++++, +++++ scale. A small representative table satisfying all five points is shown in the solution.
Key Takeaways
Paper 3 tables need both the independent variable heading and a clear dependent variable heading; values are entered in the correct trend; symbols come from the supplied key. The colour intensity is qualitative and may be slightly different for different candidates, so the mark scheme awards the trend rather than the exact symbol.
Common Mistakes
- Putting the buffer label ('P2', 'P3' ...) instead of the pH value as the column heading.
- Recording an inconsistent trend (e.g. P4 paler than P5) — this contradicts the hypothesis and loses the trend mark.
- Writing the symbol with extra '+'s outside the key (e.g. '++++++').
Things to Be Careful About
Use the white card behind the tube to judge the intensity fairly, and observe the tubes in the same lighting conditions so that one tube is not judged against a brighter background than another.
- Record your result for PU in (a)(v) using one of the symbols shown in the key in Fig. 1.2.
Record your result for PU.
result for PU = ______
Answer
result for PU = +++ (representative — depends on candidate's own observation).
e.g. +++
Background Concept
The same intensity key is used for the unknown pH as was used for the known pH values in (a)(iv). The symbol written here is the candidate's own observation of the PU tube.
Understanding the Question
After 10 minutes the PU tube is observed in the same way as the P2–P6 tubes. The colour is recorded using one of the symbols from the key.
Approach
Compare the PU tube, against a white card, with the symbols in the key, and record the one that matches best.
Step-by-Step Reasoning
The exact symbol depends on the actual pH of the PU buffer supplied to the candidate. A representative answer is '+++' (which would be consistent with pH ≈ 4 in the solution to (a)(iv)). Whatever symbol is recorded, it must come from the key and be used consistently with the (a)(iv) table.
Key Takeaways
Use the same scale and the same observation conditions as for the known pH tubes so that the comparison in (a)(vi) is valid.
Common Mistakes
- Recording a phrase such as 'medium blue' instead of a symbol — the question requires a symbol from the key.
- Using a symbol that is not in the key (e.g. '++++++').
Things to Be Careful About
Make the comparison under the same lighting as the (a)(iv) tubes, ideally at the same time, so that the intensity can be compared reliably with the known pH tubes.
Using your results from (a)(iv) and (a)(v), estimate the pH of PU.
pH of PU = ______
Answer
pH of PU = 4 (representative — must match the symbol recorded in (a)(v) and the corresponding pH in the (a)(iv) table).
e.g. 4
Background Concept
Estimating an unknown by comparison with a series of standards is a standard analytical technique (used, for example, in pH indicator papers and colorimetric assays). Here, the colour intensity from PU is compared to the intensity already recorded for the five known pH buffers; the pH that gives the matching intensity is the estimate.
Understanding the Question
The symbol recorded in (a)(v) is read against the (a)(iv) table to find the pH that produced the same intensity. That pH is the best estimate for the pH of PU.
Approach
Locate the row in the (a)(iv) table whose symbol matches the symbol recorded for PU. The pH in that row is the answer.
Step-by-Step Reasoning
For example, if the candidate's (a)(iv) table shows '+' at pH 6, '++' at pH 5, '+++' at pH 4, '++++' at pH 3 and '+++++' at pH 2, and the PU tube was recorded as '+++', then the estimated pH of PU is 4. If the symbol lies between two known intensities the candidate may interpolate (e.g. between '++' and '+++' giving pH ≈ 4.5), but the mark scheme rewards any sensible value consistent with the candidate's own (a)(iv) and (a)(v) results.
Key Takeaways
Estimating an unknown by comparison with standards requires the comparison itself to be made under identical conditions — same lighting, same tube size, same time after mixing.
Common Mistakes
- Picking a pH that does not match the recorded symbol (the mark scheme requires the answer to be consistent with the candidate's own (a)(iv) table).
- Quoting the pH with too many significant figures (e.g. pH 4.27) — the resolution of the method is about one pH unit.
Things to Be Careful About
If the symbol recorded for PU does not exactly match any of the five standard pH tubes, the candidate should give the pH of the closest match and not invent a value outside the range tested.
Suggest one improvement to this investigation so that a more accurate estimate of the pH of PU can be made.
Answer
Use a series of colour standards (standard solutions of methylene blue at known concentrations) — or a colorimeter — to judge the intensity in the PU tube more accurately. Alternatively, test more pH values between the existing ones (e.g. pH 2.5, 3.5, 4.5, 5.5) to refine the estimate.
use colour standards (or a colorimeter) / use more intermediate pH values
Background Concept
The eye is a poor judge of colour intensity, especially when the difference between two tubes is small. Two common ways to improve quantitative comparison are: (1) prepare a set of colour standards of known intensity against which the unknown can be matched, and (2) use a colorimeter, which measures the absorbance of light through the solution and gives a numerical value. Either approach removes the subjectivity of 'looking' at the tubes.
Understanding the Question
The procedure uses an ordinal symbol scale to record colour intensity, and the estimate of the pH of PU depends on matching that symbol to one of the five standards. With only five standards and human eyes, the estimate is rough. The question asks for one improvement that would give a more accurate estimate.
Approach
Either reduce the subjective element of the colour judgement (colorimeter / colour standards) or increase the resolution of the pH scale (more pH values between those already tested).
Step-by-Step Reasoning
A colorimeter gives a numerical absorbance value, so a small difference between PU and one of the standards can be detected. Alternatively, a set of methylene blue solutions of known concentration, sealed in identical tubes, allows the PU tube to be matched more precisely. Using additional pH values (e.g. pH 2.5, 3.5, 4.5, 5.5) narrows the gap between standards and so refines the estimate. Any one of these is accepted.
Key Takeaways
'Improvements' in Paper 3 should target a specific limitation of the method and propose a realistic, equipment-available fix. Vague answers such as 'be more careful' or 'do more repeats' do not score.
Common Mistakes
- 'Repeat the experiment' — this would not give a more accurate estimate of the pH; it would test reproducibility.
- 'Use a different potato' — variability between cylinders affects the colour released but does not improve the resolution of the colour comparison.
- 'Be more accurate' — too vague to score.
Things to Be Careful About
Match the improvement to the actual limitation. The main limitation here is the subjectivity of the colour comparison (a small change in intensity is hard to see), so the improvement must address that — a colorimeter or colour standards are the right answers.
Think about how you would modify this procedure to investigate the effect of temperature on the release of methylene blue from the cells of potato tissue.
Describe how the independent variable (temperature) will be changed to investigate the release of methylene blue from the cells of potato tissue.
Answer
- Set up a thermostatically controlled water-bath at each chosen temperature so that the temperature of the buffer can be held constant (e.g. 10, 20, 30, 40, 50 — at least five different temperatures).
- Use at least five different temperatures, spread evenly across a suitable range, so that any trend in the release of methylene blue with temperature can be identified.
thermostatically controlled water-bath; at least 5 temperatures
Background Concept
To investigate the effect of an independent variable, the experimenter must (a) be able to set and hold that variable at chosen values, and (b) use enough values to see a trend. Temperature is best controlled with a thermostatically controlled water-bath, which holds the chosen temperature to within about . A water-bath is also safer than a naked flame for heating aqueous solutions.
Understanding the Question
The question keeps everything from the original procedure the same except the independent variable: instead of pH, temperature is now varied. The candidate is asked specifically how the temperature will be changed — i.e. the equipment used to set the temperature and the number of different temperatures to be tested.
Approach
Identify a piece of equipment that can hold a temperature accurately (thermostatically controlled water-bath), and choose a number of temperatures that is large enough to show a trend (at least five, with even spacing across a sensible range, e.g. 10–50 ).
Step-by-Step Reasoning
For each temperature, the test-tube containing the potato pieces and buffer would be stood in a water-bath set to that temperature. Holding the temperature constant across the 10-minute wait is essential — without a thermostat, the buffer would cool or warm during the experiment, and the variable would not be controlled. Using at least five temperatures allows a graph of colour intensity (or absorbance) against temperature to be drawn, and any optimum (where membrane proteins begin to denature) to be identified.
Key Takeaways
Independent variables in biology are often changed by a piece of equipment (water-bath, pH meter, colorimeter, etc.) and the experiment must use a sufficient number of values for a trend to be visible. Paper 3 rewards these two design points explicitly.
Common Mistakes
- 'Use different temperatures' without saying how the temperature is held — this is the same kind of vague answer that loses the equipment mark.
- Using only two or three temperatures, which would not be enough to see a trend.
- Using temperatures so close together (e.g. 19, 20, 21) that they are within the uncertainty of the bath.
Things to Be Careful About
Keep all other variables from the original procedure the same: same volume of buffer, same number of potato pieces, same 10-minute wait. Only temperature is changed.
A student investigated the effect of soil pH on grass growth.
Grass was grown in pots containing soil of different pH values for 90 days. The grass was then collected, dried and weighed. All other variables were kept constant.
The results are shown in Table 1.3.
Table 1.3
| soil pH | mean mass of grass/g |
|---|---|
| 4.5 | 7.5 |
| 5.0 | 9.5 |
| 5.5 | 11.1 |
| 6.0 | 12.5 |
| 6.5 | 13.4 |
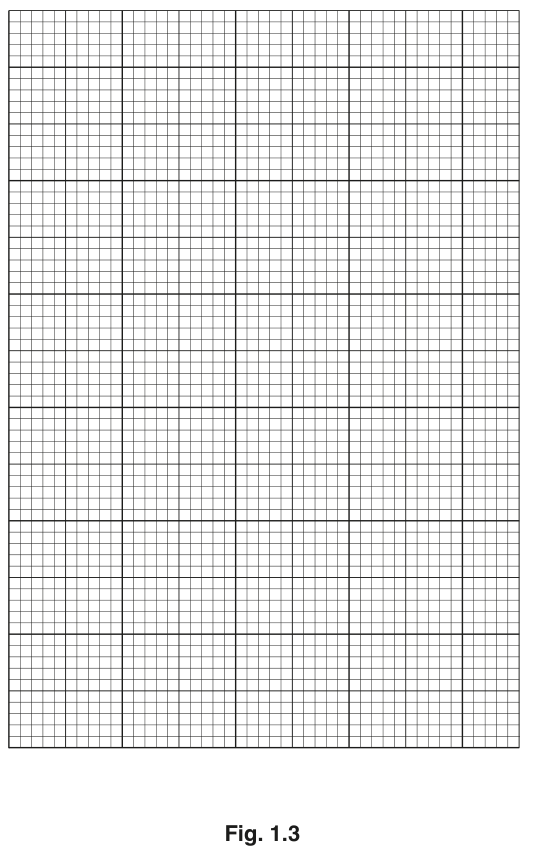
Plot a graph of the data in Table 1.3 on the grid in Fig. 1.3.
Use a sharp pencil for drawing graphs.
Answer
Plot the following five points on the grid provided, with soil pH on the x-axis and mean mass of grass / g on the y-axis:
Join the points with a smooth curve (a line of best fit). The curve rises from lower-left to upper-right, but bends so that the slope decreases as pH increases.
See working — graph of mean mass of grass against soil pH with five points and a smooth curve.
Background Concept
A graph of a continuous dependent variable against a continuous independent variable should have the independent variable on the x-axis and the dependent variable on the y-axis. The axes should be labelled with the quantity and the unit (e.g. '/g'), the scale should be linear and should use at least half the grid in both directions, points are plotted with a small cross or a dot in a circle, and a smooth curve (or line of best fit) is drawn through the points.
Understanding the Question
The candidate is given five pairs of values in Table 1.3 and asked to plot them on the grid in Fig. 1.3. Four marks are available: (1) correct axis labels; (2) appropriate scales labelled every 2 cm; (3) all five points plotted accurately; (4) a smooth line / curve of best fit through the points.
Approach
Use a sharp pencil. Choose a scale on the x-axis that covers 4.0 (or 4.5) to 7.0 with major gridlines every 0.5 pH. Choose a scale on the y-axis that covers 0 to 15 g with major gridlines every 2 or 3 g. Plot the points and join them with a smooth curve.
Step-by-Step Reasoning
- x-axis label: 'soil pH'.
- y-axis label: 'mean mass of grass / g' (the slash means 'per', so '/g' is the unit, not '/g' as part of the quantity name).
- Scales: a 0.5 unit pH = 2 cm is a sensible x-scale (4.0 to 7.0 spans 12 cm); a 1 g = 1 cm or 2 g = 1 cm is a sensible y-scale (0 to 15 g spans 15 or 7.5 cm). Each major gridline (every 2 cm) must be labelled.
- Plotting: mark each of the five points with a small cross or a dot in a circle. A small cross is usually more accurate because the centre of the cross can be read off precisely.
- Line: join the points with a smooth curve. Because the points bend (the increments in mass get smaller as pH increases), a straight line is not appropriate. A smooth curve is the correct choice.
Key Takeaways
The four marks test the standard CIE graph conventions: axes with quantity + unit, sensible linear scale, accurate plotting, appropriate line. These conventions are the same in every Paper 3 / Paper 5 graph.
Common Mistakes
- Plotting pH on the y-axis (the independent variable goes on the x-axis).
- Forgetting the unit on the y-axis label (just 'mass of grass' loses the unit mark).
- Using a non-linear scale, e.g. a compressed scale, or starting the y-axis at 5 g (which exaggerates the trend).
- Joining the points with straight zig-zag line segments instead of a smooth curve.
- Drawing the line through the origin, which is not justified by the data.
Things to Be Careful About
Use a sharp pencil and a ruler for the axes. Plot the points carefully, then draw the curve in one smooth motion with a pencil, freehand. The curve does not have to pass through every point exactly, but should pass close to all of them.
Use Table 1.3 and the graph in (b)(i) to describe the trend in the data.
Answer
- As the soil pH increases from 4.5 to 6.5, the mean mass of grass increases.
- The mean mass of grass increases at a decreasing rate. (For example, the mass rises by from pH 4.5 to 5.0, but only by from pH 6.0 to 6.5.)
as pH increases the mean mass of grass increases; the increase is at a decreasing rate
Background Concept
A 'trend' in a set of data describes how the dependent variable changes as the independent variable is changed. A good description has two parts: (1) the overall direction (increase / decrease) and (2) the shape of the change (linear, increasing at a constant rate, increasing at a decreasing rate, levelling off, etc.). Data quotes — actual numbers from the table — are the most convincing way to support a description of shape.
Understanding the Question
The candidate is asked to use both Table 1.3 and the graph in (b)(i) to describe the trend in the data. Two marks are available: one for the direction of the trend and one for the shape (or for data quotes that illustrate the shape).
Approach
Read the table from low pH to high pH and check whether the mass goes up or down. Then look at the differences between successive entries to see whether the increases are getting bigger, smaller or staying the same.
Step-by-Step Reasoning
Direction: the mass rises from at pH 4.5 to at pH 6.5, so as pH increases the mass increases.
Shape: the successive increases are , , , . The increases get smaller as pH rises, so the mass is increasing at a decreasing rate. The same conclusion is visible on the graph: the curve flattens as it moves to the right.
Key Takeaways
A description of a trend should always include both direction and shape. Data quotes (the actual numbers, or the differences between them) are the easiest way to show shape and earn the second mark.
Common Mistakes
- 'The mass increases' on its own — earns only the first mark; the second mark requires the shape (decreasing rate) or supporting data.
- 'The mass increases linearly' — this is wrong; the rate of increase falls, so the relationship is curved, not linear.
- 'The mass doubles' or other generalisations that do not match the numbers.
Things to Be Careful About
Make sure the direction is stated with the independent variable first ('as pH increases...'), not the other way round. The shape should be supported by data, not asserted.
Minerals from the soil enter a plant with the help of membrane-bound protein molecules.
Suggest how a low pH could affect the growth of grass.
Answer
- A low pH (high concentration) denatures the membrane-bound carrier proteins in the root cell-surface membrane, changing the shape of their active site.
- This reduces the active transport of mineral ions into the root hair cells, so the plant absorbs fewer minerals and grows less.
denatures membrane proteins; reduces active transport of mineral ions
Background Concept
Most mineral ions (e.g. , , , ) are taken up by plant roots against their concentration gradient, by active transport through specific carrier proteins in the cell-surface membrane of root hair cells. These carrier proteins are held in their functional shape by hydrogen bonds and other weak interactions, both of which are sensitive to pH. At very low pH the high concentration of ions disrupts these interactions and denatures the protein, so that it can no longer bind and transport its specific ion.
Understanding the Question
The stem states that 'minerals from the soil enter a plant with the help of membrane-bound protein molecules' and Table 1.3 shows that grass mass is lowest at the most acidic pH tested (4.5). The candidate must suggest how a low pH could affect the growth of grass by linking pH to the function of the membrane proteins.
Approach
Identify the type of protein (a carrier for active transport), explain how low pH damages it (denaturation by disrupting hydrogen bonds / tertiary structure), and link the loss of protein function to the biological outcome (less mineral uptake, slower growth).
Step-by-Step Reasoning
At pH 4.5, the high concentration around the root hair cells disturbs the tertiary structure of the carrier proteins. The active site loses its specific shape and can no longer bind the mineral ion. The rate of active transport of minerals into the root falls, so fewer minerals reach the rest of the plant, and growth (measured as dry mass after 90 days) is reduced. Both points — denaturation of the protein and the consequence for active transport — are needed for the two marks.
Key Takeaways
Plant mineral nutrition depends on specific carrier proteins in the root cell-surface membrane. Any environmental factor that denatures these proteins (extreme pH, high temperature, certain heavy-metal ions) will reduce mineral uptake and therefore plant growth. This is also the link between soil pH and crop yield in agriculture.
Common Mistakes
- 'Kills the plant' — too vague; the question is about the mechanism, not the outcome.
- 'Stops photosynthesis' — minerals are taken up by the roots; photosynthesis is reduced only as a downstream effect and is not what the question is asking about.
- 'Osmosis is affected' — osmosis is the movement of water, not of mineral ions, and the question is specifically about membrane proteins moving minerals.
- Citing 'diffusion' rather than 'active transport' — most mineral ions are taken up against a concentration gradient, so the correct term is active transport.
Things to Be Careful About
The question awards one mark for the effect on the protein (denature / change shape of active site) and one mark for the effect on transport (reduced active transport of mineral ions). Both must appear for full marks.
The rest of this paper
1 more questions- Q2Use of the Light Microscope · Analysis, Conclusions and Evaluation19M