Biology 9700/21 — October/November 2019
Cambridge AS Level · AS Level Structured Questions · worked solutions for every part, with the mark scheme
Topics Immunity · Enzymes · Nucleic Acids and Protein Synthesis · Biological Molecules · Cell Structure · Transport in Plants · +5 more
Fig. 1.1 shows the structure of the amino acid glycine.
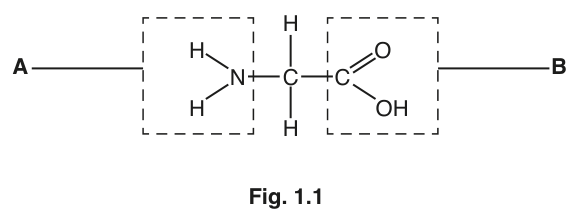
Name the parts of the amino acid molecule labelled A and B in Fig. 1.1.
A ______
B ______
Answer
A amino / amine group
B carboxyl / carboxylic acid (group)
A = amino group; B = carboxyl group
Background Concept
Amino acids are the monomer building blocks of polypeptides and proteins. Every standard (α) amino acid shares a common backbone: a central (α) carbon bonded to four different groups:
- a hydrogen atom (–H)
- an amino group (–NH₂) — group A in Fig. 1.1
- a carboxyl group (–COOH) — group B in Fig. 1.1
- an R group (variable side chain), which distinguishes the twenty standard amino acids from one another
In glycine, the simplest amino acid, the R group is just another hydrogen, so the α-carbon carries two hydrogens.
The amino group is basic (it can accept H⁺ to become –NH₃⁺) and the carboxyl group is acidic (it can donate H⁺ to become –COO⁻). At physiological pH, an amino acid typically exists as a zwitterion with both groups ionised.
Understanding the Question
The candidate is shown Fig. 1.1, the structure of glycine. Two regions are boxed and labelled A and B. Part (a)(i) simply asks for the name of each boxed functional group.
Approach
Identify each boxed region by the atoms it contains:
- Group A: a nitrogen atom (N) bonded to two hydrogen atoms → –NH₂
- Group B: a carbon double-bonded to oxygen and single-bonded to –OH → –COOH
Step-by-Step Reasoning
Group A contains one nitrogen atom covalently bonded to two hydrogen atoms and to the central α-carbon. This is the amino group (–NH₂). The mark scheme accepts "amino" or "amine".
Group B contains a carbon atom with a C=O double bond and a C–OH single bond, attached to the central α-carbon. Together these atoms make the carboxyl group (–COOH). The mark scheme accepts "carboxyl" or "carboxylic acid".
Key Takeaways
- Every standard amino acid has both an amino group and a carboxyl group on its α-carbon.
- The amino group is one of the sites that forms peptide bonds (with carboxyl groups of other amino acids).
- The carboxyl group is the other site of peptide bond formation (with amino groups of other amino acids).
Common Mistakes
- Calling group A "ammonia" — that is the molecule NH₃; here it is the –NH₂ amino group covalently attached to carbon.
- Calling group B "carbonyl" — that refers only to the C=O part; with the –OH attached, it is a carboxyl group.
- Writing only the chemical formula (NH₂ or COOH) instead of naming the group.
Things to Be Careful About
- "Amino" and "amine" are both accepted; use either, but use the term, not the formula, as the answer.
Amino acids are monomers used to build proteins.
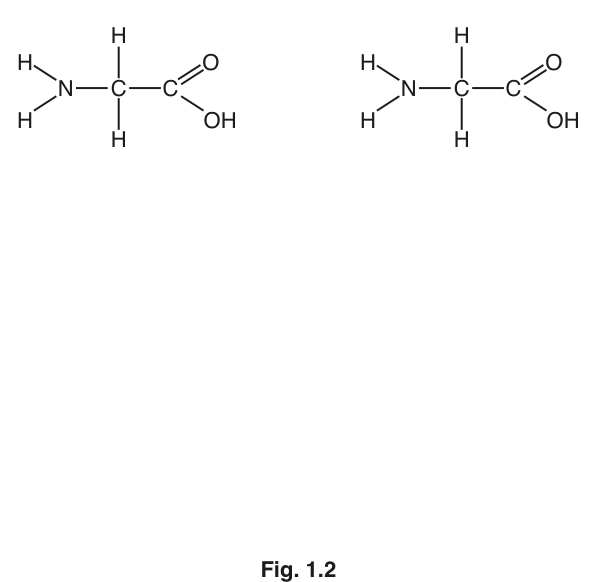
Complete Fig. 1.2 by drawing a diagram to show the formation of a peptide bond between two molecules of glycine.
Answer
The completed dipeptide has the structure:
with one molecule of shown separately as the product of the condensation reaction.
Dipeptide drawn with peptide bond –C(=O)–N(H)– between the two glycine molecules and an H₂O molecule released.
Background Concept
Amino acids are joined together by a peptide bond (also called an amide bond), which forms in a condensation reaction. In peptide bond formation:
- the –OH of the carboxyl group (–COOH) of one amino acid is removed
- an –H from the amino group (–NH₂) of the next amino acid is removed
- the two removed groups combine to release one molecule of water (H₂O)
- a new covalent bond forms between the C of the carboxyl group and the N of the amino group: –C(=O)–N(H)–
This is a condensation (dehydration) reaction because water is the byproduct.
The peptide bond itself is a single covalent C–N bond, but the adjacent C=O double bond and N–H single bond are retained on either side, so the linkage is often written as –CO–NH–.
Understanding the Question
The candidate is shown Fig. 1.2, which depicts two glycine molecules drawn side by side with a gap between them for the answer. The question asks the candidate to complete Fig. 1.2 by drawing the formation of the peptide bond.
Approach
Draw three things in the gap between the two glycines:
- A peptide bond — a single C–N bond — linking the carboxyl carbon of the left glycine to the amino nitrogen of the right glycine.
- Retain the C=O double bond on the left glycine's former carboxyl carbon, and the N–H bond on the right glycine's former amino nitrogen (these bonds are not broken).
- Draw an H₂O molecule released as the byproduct (with a downward arrow or just shown separately).
Step-by-Step Reasoning
Mark 1 — peptide bond joining N (amine) to C (carboxyl) on the adjacent amino acid:
- From the left glycine, the C that was part of –COOH remains in place.
- From the right glycine, the N that was part of –NH₂ remains in place.
- Draw a single covalent bond between this C and this N.
Mark 2 — C=O and N–H shown correctly in the dipeptide:
- On the left glycine, retain the C=O double bond from the original carboxyl group.
- On the right glycine, retain the N–H single bond (one of the two original N–H bonds; the other H has been removed and used in H₂O).
- The resulting linkage reads –C(=O)–N(H)–.
Mark 3 — formation of a water molecule:
- The –OH lost from the left glycine's carboxyl group combines with the –H lost from the right glycine's amino group.
- Show a separate H₂O molecule (with its O–H bonds) somewhere in the answer — usually drawn above the dipeptide with a downward arrow into the bond.
The completed dipeptide reads (left to right):
Key Takeaways
- Peptide bond formation is a condensation reaction: water is the byproduct.
- The C–N peptide bond is single; the adjacent C=O and N–H bonds are retained.
- Two identical amino acids (e.g. two glycines) form a dipeptide via one peptide bond and one water molecule.
Common Mistakes
- Joining the two N atoms (N–N) instead of C–N.
- Joining the two carboxyl groups via an oxygen (C–O–C) instead of C–N.
- Breaking the C=O double bond in the carboxyl group.
- Forgetting to draw the water molecule (no mark for the byproduct).
- Drawing the dipeptide with the wrong overall charge (e.g. drawing both N–H groups as –NH₃⁺).
Things to Be Careful About
- The peptide bond is a single C–N bond, but the adjacent C=O and N–H bonds are still there — the linkage looks like –CO–NH– when written out.
- Only one H₂O is produced per peptide bond.
- The drawing should clearly distinguish the peptide bond C–N from the rest of the structure.
Plasma cells synthesise and secrete antibodies.
Fig. 1.3 is a transmission electron micrograph showing a plasma cell.
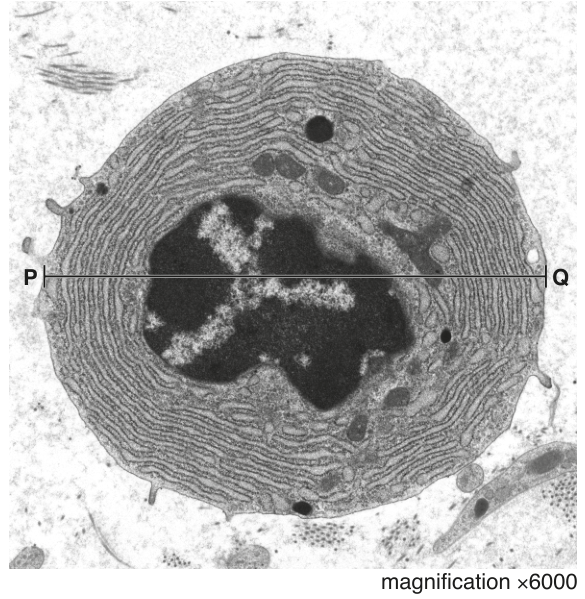
Use a label line and the label T on Fig. 1.3 to identify where the genes coding for the polypeptide chains of the antibodies are located.
Answer
Draw a label line ending inside any part of the darkly-stained, centrally-located nucleus in Fig. 1.3 and label it T.
Genes are located on the DNA in the nucleus.
T labels the nucleus.
Background Concept
In a eukaryotic cell, the genetic material (DNA) is enclosed within the nucleus, a membrane-bound organelle. The DNA is organised into chromosomes, which carry the genes that code for proteins, including the polypeptide chains of antibodies. The nucleus is therefore the source of all genetic information for protein synthesis.
On a transmission electron micrograph, the nucleus typically appears as a large, darkly-stained region near the centre of the cell, surrounded by a nuclear envelope (a double membrane).
Understanding the Question
The candidate is shown Fig. 1.3, a TEM of a plasma cell at ×6000 magnification. The plasma cell synthesises and secretes antibodies, which are proteins made of polypeptide chains encoded by genes. Part (b)(i) asks the candidate to draw a label line with the label T to indicate the location of these genes.
Approach
Identify the darkly-stained, roughly circular central region of the plasma cell in Fig. 1.3 — this is the nucleus. Genes are located in the nucleus (on the chromosomes). Draw the label T to point to any part of this region.
Step-by-Step Reasoning
- Locate the large, dark, central area in the TEM image: this is the nucleus.
- The chromosome-bearing DNA is dispersed throughout the nucleus (as euchromatin and heterochromatin); the antibody genes lie within this DNA.
- Draw a label line from the letter T (placed in white space around the nucleus) to any point inside the nucleus. The mark scheme accepts "label line to any area of the nucleus".
Key Takeaways
- The nucleus contains the cell's DNA and therefore all its genes.
- Plasma cells produce antibody polypeptide chains by expressing specific genes for immunoglobulin heavy and light chains.
Common Mistakes
- Pointing T at the cytoplasm (specifically at the rough endoplasmic reticulum) — this is where the protein is synthesised, not where the genes are.
- Pointing T at the dark "speckled" region inside the nucleus thinking it is a separate structure — this is heterochromatin (condensed DNA), still part of the nucleus.
Things to Be Careful About
- The mark scheme allows T to point to any area within the nucleus — pointing at chromatin or at the nucleolus is acceptable.
Calculate the actual diameter of the plasma cell shown by the line P–Q.
Write down the formula used to make your calculation.
Show your working and give your answer to the nearest micrometre (µm).
formula
actual diameter = ______
Working
Measuring the line P–Q on Fig. 1.3 gives an image length of approximately .
Answer
15 µm
15 µm
Background Concept
Magnification describes how many times larger an image is than the actual specimen:
Rearranging this equation gives:
To use this, all measurements must be in the same units. A common technique is to convert everything to micrometres (µm): .
Understanding the Question
Part (b)(ii) gives the magnification of the TEM as and shows a line P–Q spanning the diameter of the plasma cell. The candidate must write down the formula, substitute, and calculate the actual diameter of the cell to the nearest micrometre.
Approach
- Write the formula: .
- Measure the length of P–Q on the printed figure (in mm).
- Convert to µm (multiply by 1000).
- Divide by the magnification (6000) to get the actual diameter in µm.
- Round to the nearest µm.
Step-by-Step Reasoning
Measure the image length of P–Q. On a typical printed copy of this paper, P–Q spans about across the diameter of the cell. (This is the value that produces the mark-scheme answer; actual measurements on a candidate's paper may differ slightly but should give approximately the same result.)
Convert units:
Apply the formula:
Round to the nearest µm: .
Key Takeaways
- Always convert to the same units before dividing. With an image measured in mm, converting to µm before dividing gives a clean µm answer.
- The answer must include the unit (µm).
Common Mistakes
- Using the wrong rearrangement of the magnification formula (e.g. instead of dividing).
- Forgetting to convert mm to µm, so writing instead of .
- Omitting the unit µm in the final answer.
- Not writing the formula (the mark scheme awards a separate mark for the formula).
Things to Be Careful About
- Always quote the unit (µm).
- Show the working — even if the answer is correct, you lose a mark if the formula and substitution are absent.
- The candidate's measurement may be slightly different from depending on the printed scale of the paper, but should give an answer close to .
The plasma cell in Fig. 1.3 is very metabolically active.
Suggest why there are very few mitochondria visible in the electron micrograph in Fig. 1.3.
Answer
Only a thin section of the cell is visible in the TEM, so most of the cytoplasm (and any mitochondria within it) is outside the plane of the section / lies in other sections.
OR
The plasma cell's main role is protein synthesis and secretion (not ATP production), so it has relatively few mitochondria; most of its ATP comes from anaerobic respiration / glycolysis.
Only a thin section is shown, so most of the cell — including any mitochondria — is outside the plane of the section.
Background Concept
A transmission electron microscope (TEM) produces an image by passing a beam of electrons through an extremely thin slice of a specimen (typically thick). What is seen in the micrograph is therefore a 2D "slice" through the cell, not the whole 3D structure. Any organelle that does not lie within this thin section will not appear in the image, even if it is present in the cell.
Plasma cells are highly specialised for protein synthesis and secretion (of antibodies). They have an extensive rough endoplasmic reticulum (visible as the concentric membranes in Fig. 1.3) and a large Golgi apparatus. Mitochondria are present but relatively few compared with cells specialised for ATP production (e.g. cardiac muscle cells).
Understanding the Question
Part (b)(iii) notes that the plasma cell is very metabolically active (lots of protein synthesis) and asks the candidate to suggest why only a few mitochondria are visible in the TEM.
Approach
Two lines of reasoning are valid:
- TEM artefact: only a thin section is shown, so the absence of mitochondria in this particular section does not mean the cell has none.
- Functional specialisation: plasma cells have relatively few mitochondria because their main role is protein synthesis and secretion, not ATP production.
Step-by-Step Reasoning
The mark scheme accepts any one valid suggestion. The most defensible answer for an A-level candidate is the TEM artefact explanation: because the specimen is sliced extremely thinly, only the organelles that lie within that thin plane are captured in the image. Mitochondria are typically long — most of them lie outside the plane of any given thin section, so a single section of a plasma cell will rarely show many.
Key Takeaways
- A TEM image is a 2D slice, not the whole 3D cell.
- Absence in a TEM section does not equal absence in the cell.
- Plasma cells are specialised for protein synthesis and secretion, not for aerobic ATP production.
Common Mistakes
- Saying the cell has no mitochondria — this is wrong; plasma cells do have some mitochondria.
- Saying the cell has few mitochondria because it doesn't need much ATP — protein synthesis does require ATP, but plasma cells obtain most of it from glycolysis / anaerobic respiration of glucose.
Things to Be Careful About
- The "thin section" argument is the safest and most exam-appropriate answer.
Sieve tube elements in plants have very few organelles such as mitochondria.
Explain how having very few organelles is an adaptation of the sieve tube element to its function.
Answer
- Having very few organelles reduces resistance to the flow of sap through the sieve tube element. ;
- Less space is taken up by organelles, so a greater volume of sap can pass through per unit time. ;
- Translocation occurs by mass flow / pressure flow, which does not require energy from the sieve tube element itself, so few mitochondria are needed for this. ;
- Any metabolic reactions required are carried out by the companion cell, not by the sieve tube element. ;
Few organelles reduce resistance to sap flow and increase lumen volume for sap; mass flow needs no cellular energy so few mitochondria are required; the companion cell carries out metabolism on behalf of the sieve tube element.
Background Concept
Sieve tube elements are the conducting cells of the phloem. They are highly specialised for the translocation of assimilates (mainly sucrose) from source regions (e.g. photosynthesising leaves) to sink regions (e.g. roots, fruits, growing shoots). This movement occurs by mass flow (also called pressure flow) along a gradient of hydrostatic pressure generated by active loading of sucrose at the source and unloading at the sink.
A mature sieve tube element has:
- no nucleus
- very few ribosomes
- very few mitochondria
- reduced cytoplasm pushed to the periphery
- sieve plates (perforated end walls) connecting it to neighbouring sieve elements
- a companion cell closely associated with it, which carries out the metabolic functions
The companion cell supplies the sieve tube element with ATP and proteins and performs the metabolic tasks that the sieve element cannot perform itself.
Understanding the Question
Part (c) explains that sieve tube elements have very few organelles such as mitochondria. It asks the candidate to explain how this is an adaptation to their function of transporting assimilates.
Approach
Think about what sieve tube elements need to do (transport sap efficiently) and how having few organelles helps:
- Less resistance to flow: an empty lumen offers less frictional resistance than a cytoplasm filled with organelles.
- More space for sap: the more open the cell, the more sap can pass through per unit time.
- Mass flow does not require cellular energy: the driving force is the pressure gradient between source and sink, generated by the loading/unloading processes at either end, not by the sieve tube element itself. So few mitochondria are needed for ATP production.
- Companion cell provides metabolism: the companion cell carries out respiration and other metabolic reactions on behalf of the sieve element.
Step-by-Step Reasoning
Point 1 (mark-scheme credit): Fewer organelles means less resistance to the flow of sap through the lumen of the sieve tube element.
Point 2 (mark-scheme credit): Less space is taken up by organelles, so the internal volume available for sap flow is increased. More sap can pass through per unit time (the rate of translocation is higher).
Point 3 (mark-scheme credit): Mass flow / pressure flow is the mechanism of translocation, and it does not require energy from the sieve tube element itself. Energy is needed at the source to load sucrose actively into the phloem (creating the pressure) and at the sink to unload it, but these processes are carried out by the companion cell. So the sieve tube element does not need many mitochondria to generate ATP.
Point 4 (mark-scheme credit / AVP): The companion cell carries out the metabolic reactions (e.g. aerobic respiration, synthesis of proteins) that the sieve tube element cannot do, freeing the sieve tube element to be a passive conduit.
Key Takeaways
- Sieve tube elements are adapted for efficient translocation of assimilates.
- Few organelles = low resistance + large lumen + reduced energy demand.
- The companion cell performs the metabolic role that the sieve tube element has shed.
- Mass flow does not require ATP from the sieve tube element itself.
Common Mistakes
- Confusing sieve tube elements with xylem vessels (xylem vessels are dead and empty; sieve tubes are living but have reduced contents).
- Saying sieve tubes have no organelles — they have some, just very few.
- Saying the absence of organelles is to "save energy" — sieve tubes do still need ATP, but the companion cell supplies it.
- Missing the link to mass flow / pressure flow mechanism.
Things to Be Careful About
- "Few organelles" is a feature; "less resistance to flow", "more space for sap", "mass flow doesn't need cellular energy", and "companion cell does metabolism" are the four mark-scheme credit ideas. Two of these are required for full marks.
The rest of this paper
5 more questions- Q2Infectious Diseases · Immunity · Enzymes · Nucleic Acids and Protein Synthesis11M
- Q3Cell Membranes and Transport6M
- Q4Transport in Mammals · Immunity11M
- Q5Immunity · Enzymes12M
- Q6Nucleic Acids and Protein Synthesis · The Mitotic Cell Cycle · Gas Exchange9M