Biology 9700/35 — May/June 2019
Cambridge AS Level · Advanced Practical Skills · worked solutions for every part, with the mark scheme
Topics Analysis, Conclusions and Evaluation · Manipulation, Measurement and Observation · Presentation of Data and Observations · Use of the Light Microscope
Blood plasma contains proteins. The concentration of protein in blood plasma may change according to the health of a person.
The concentration of protein in blood plasma can be measured to identify possible health problems.
In this investigation you will be using protein solutions, P and U, instead of blood plasma.
You will need to:
- prepare a serial dilution of solution P
- carry out the test for protein on each concentration of protein solution
- carry out the test for protein on the unknown concentration of protein, U
- estimate the concentration of protein in U.
You are provided with the materials shown in Table 1.1.
Table 1.1
| labelled | contents | hazard | volume/ |
|---|---|---|---|
| P | 1% protein solution | none | 30 |
| U | protein solution of unknown concentration | none | 10 |
| W | distilled water | none | 100 |
| K | 5% potassium hydroxide solution | harmful irritant | 20 |
| C | 0.15% copper sulfate solution | none | 20 |
If any solution comes into contact with your skin, wash off immediately under cold water. It is recommended that you wear suitable eye protection.
You will need to:
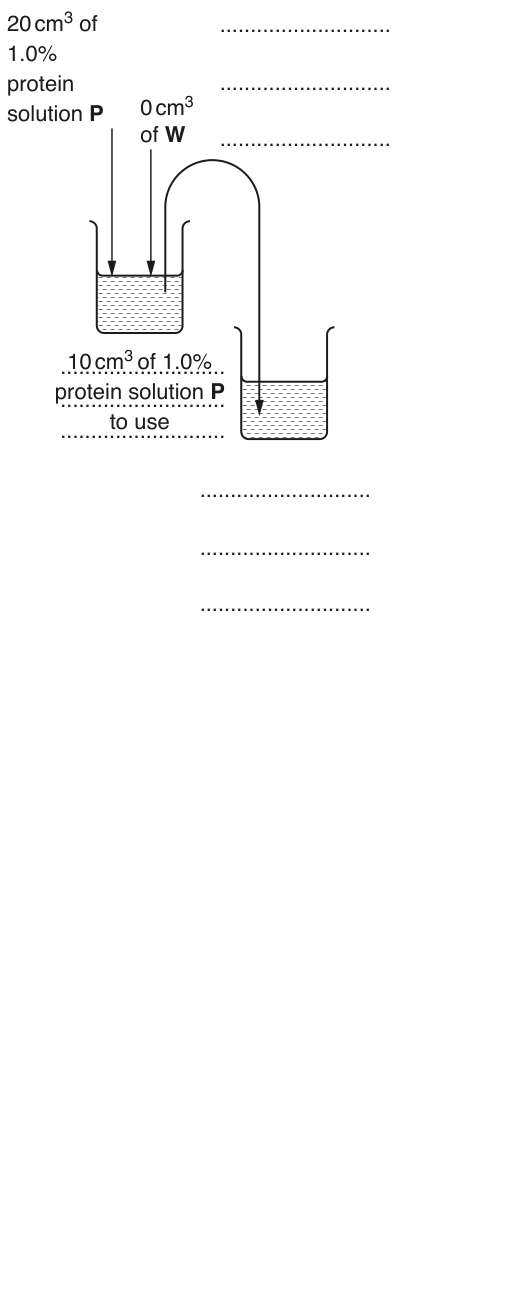
- make a serial dilution of 1.0% protein solution, P, which reduces the concentration by half between each successive dilution
- prepare of each concentration of protein solution.
Fig. 1.1 shows the first two beakers you will use to make your serial dilution.
Complete Fig. 1.1 by drawing as many extra beakers as you need for your serial dilution.
For each beaker:
- state, under the beaker, the volume and concentration of protein solution available for use in the investigation
- use one arrow with a label, above the beaker, to show the volume and concentration of protein solution added to prepare the concentration
- use another arrow with a label, above the beaker, to show the volume of W added to prepare the concentration.
Carry out the test for protein on the different concentrations of protein using step 1 to step 7.
- Prepare the concentrations of protein solution as decided in (a)(i) and shown in Fig. 1.1. Use a glass rod to mix the protein solutions and water.
- Label the test-tubes with the concentrations of the protein solutions prepared in step 1.
- Put of each concentration into the appropriately labelled test-tube.
- Label another test-tube 0.0% and put of W into this test-tube.
- Put of K into each test-tube. Shake gently to mix.
- Put of C into each test-tube. Shake gently to mix.
- Leave the test-tubes for at least 2 minutes. Shake gently to mix.
You will see a range of colours depending on the concentration of protein present.
Table 1.2 shows the range of colours and the letters you will use to record your observations in (a)(ii).
Table 1.2
| colour | letters to use |
|---|---|
| very pale blue/colourless | VP |
| pale blue | PB |
| blue | B |
| pale purple | PP |
| purple | P |
| dark purple | DP |
After step 7 you will see some of the colours in Table 1.2.
Record the colours, in an appropriate table, by using the letters in Table 1.2.
You may use the same letters for more than one test-tube.
It may help to observe the colour with a piece of white card behind the test-tube.
You now need to estimate the concentration of U using your results.
- Label a test-tube U and put of U into this test-tube.
- Repeat step 5 to step 7 then record the colour of U in (a)(iii).
State the colour of U after step 7.
colour of U = ______
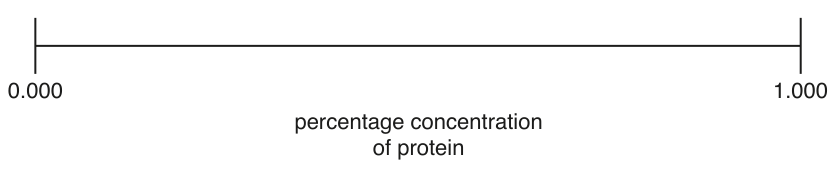
Complete Fig. 1.2 to show the position on the line of each of the percentage concentrations of protein solution in (a)(i).
Using your results in (a)(ii) and (a)(iii), put the label U on Fig. 1.2 to show an estimate of the concentration of protein in U.
Suggest how you could change the independent variable to have more confidence in your estimate of the concentration of protein in U.
Suggest the apparatus that could be used to measure the concentration of protein in U more accurately.
The concentration of protein in blood plasma from five people with the same infection was measured for 11 days.
The results are shown in Table 1.3.
Table 1.3
| time / days | concentration of protein in blood plasma / | |||||
|---|---|---|---|---|---|---|
| person 1 | person 2 | person 3 | person 4 | person 5 | mean | |
| 0 | 57 | 53 | 52 | 59 | 54 | 55 |
| 3 | 91 | 89 | 94 | 90 | 86 | 90 |
| 6 | 120 | 115 | 115 | 120 | 130 | 120 |
| 8 | 87 | 106 | 82 | 81 | 86 | |
| 11 | 53 | 62 | 59 | 54 | 57 | 57 |
Complete Table 1.3 by calculating the mean at 8 days.
Space for working.
Plot a graph of the mean values shown in Table 1.3 on the grid in Fig. 1.3.
Use a sharp pencil for drawing graphs.

Explain, using your knowledge of the immune system, the increase in the concentration of protein in blood plasma between day 0 and day 6.
The rest of this paper
1 more questions- Q2Use of the Light Microscope · Analysis, Conclusions and Evaluation19M