Biology 9700/34 — May/June 2019
Cambridge AS Level · Advanced Practical Skills · worked solutions for every part, with the mark scheme
Topics Use of the Light Microscope · Manipulation, Measurement and Observation · Presentation of Data and Observations · Analysis, Conclusions and Evaluation
Onion cells in sodium chloride solutions may show plasmolysis, where the cell surface membrane pulls away from the cell wall.
Fig. 1.1 shows onion cells in different states of plasmolysis.
- Cell A is showing no plasmolysis.
- Cells B, C and D are all showing plasmolysis.
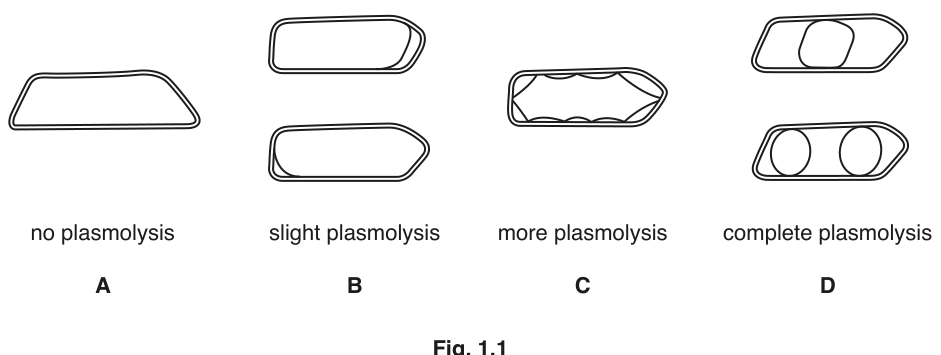
Fig. 1.1
Different concentrations of sodium chloride solutions have different water potentials.
When onion cells are put into a sodium chloride solution with a lower water potential than the cells, water leaves the vacuoles and the cells show plasmolysis.
You are provided with the materials shown in Table 1.1.
Table 1.1
| labelled | contents | hazard | volume / |
|---|---|---|---|
| S1 | sodium chloride solution + onion tissue | none | 50 |
| S2 | sodium chloride solution + onion tissue | none | 50 |
| S3 | sodium chloride solution + onion tissue | none | 50 |
| S4 | sodium chloride solution + onion tissue | none | 50 |
If any solution comes into contact with your skin, wash off immediately under cold water.
It is recommended that you wear suitable eye protection.
S1 is sodium chloride solution.
S2, S3 and S4 are , and , but not necessarily in that order.
You will need to:
- observe a sample of onion cells from S1, S2, S3 and S4
- decide how many cells you will observe to record the states of plasmolysis
- record the number of cells that show the different states of plasmolysis, A, B, C and D, as shown in Fig. 1.1
- use your results to identify the concentration of the sodium chloride solutions, S2, S3 and S4.
Carry out step 1 to step 7 to prepare a slide of onion tissue.
- Label one dry and clean microscope slide, S1. Put the slide on a paper towel.
- Put a few drops of sodium chloride solution, S1, onto the microscope slide.
- Remove a piece of the onion tissue from S1. Peel off the inner epidermis as shown in Fig. 1.2. The inner epidermis may start to separate or have become separated from the rest of the onion tissue, so the epidermis may be floating in the sodium chloride solution.
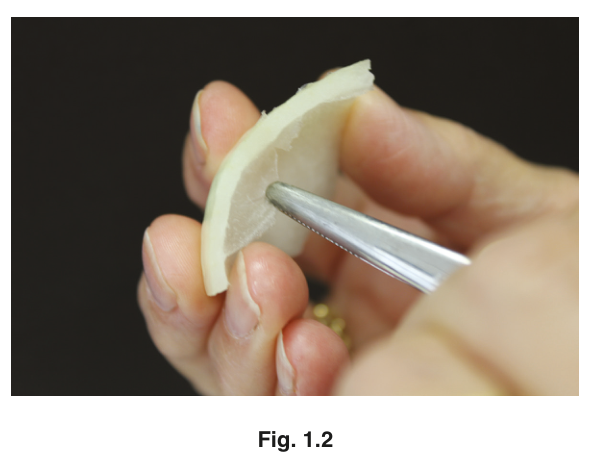
Fig. 1.2
- Cut one piece of the epidermis so that it will fit under a coverslip. Put the remaining epidermis into S1.
- Put the piece of epidermis on the labelled microscope slide as shown in Fig. 1.3. If the piece of epidermis is folded, you may need to add more drops of S1 so that it floats and can be unfolded.
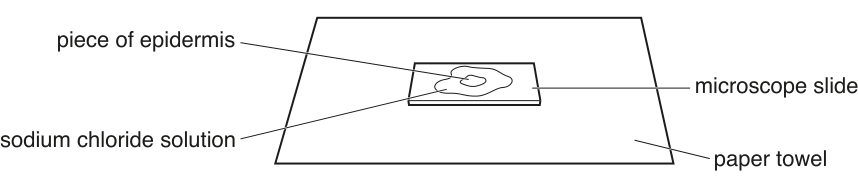
Fig. 1.3
- Put a coverslip over the piece of epidermis on the microscope slide. Use a paper towel to remove any excess solution that is outside the coverslip.
- Observe the cells of the epidermis using the microscope. You may need to reduce the amount of light entering the microscope to observe the cells clearly.
You need to decide which objective lens you will use and decide the number of cells you will need to observe to give you confidence in your results.
State the objective lens you will use and the number of cells you will observe. Explain how this will give you confidence in your results.
objective lens ______
number of cells ______
explanation ______
-
Using the objective lens and the number of cells you decided in (a)(i), count the number of cells for S1 that are in each state of plasmolysis, A, B, C and D (as shown in Fig. 1.1). Record your results in (a)(ii).
-
Repeat step 1 to step 8 for each of S2, S3 and S4. Record your results in (a)(ii).
Record your results in an appropriate table.
Solution S1 is .
S2, S3 and S4 are , and , but not necessarily in that order.
Using your results in (a)(ii), identify the concentration of sodium chloride solution in S2, S3 and S4.
S2 ______
S3 ______
S4 ______
Observe the onion cells on the microscope slide you labelled S4.
Select four adjacent, touching cells, with at least two cells showing plasmolysis.
Make a large drawing of these four cells.
Use one ruled label line and label to identify the cell surface membrane of one cell.
A student investigated the effect of different concentrations of sucrose solutions on pieces of potato tissue.
- Each piece of potato tissue was cut to exactly in length and had a cross-sectional area of exactly .
- Each piece of potato tissue was put into a different concentration of sucrose solution.
- After 1 hour the length of each piece of potato was measured.
The results of the student's investigation are shown in Table 1.2.
Table 1.2
| sucrose concentration / | change in length / |
|---|---|
| 0.0 | +2.5 |
| 0.2 | +1.5 |
| 0.4 | 0.0 |
| 0.6 | -0.5 |
| 1.0 | -1.5 |
Describe the pattern of water movement shown in Table 1.2.
Using your knowledge of water potential, explain the result at .
The student decided to compare the effect of different concentrations of sucrose solution using a different type of potato.
Complete Table 1.3 to suggest how three variables would need to be standardised.
Table 1.3
| variable | how variable may be standardised |
|---|---|
The rest of this paper
1 more questions- Q2Manipulation, Measurement and Observation · Presentation of Data and Observations · Analysis, Conclusions and Evaluation · Use of the Light Microscope21M