Biology 9700/31 — May/June 2019
Cambridge AS Level · Advanced Practical Skills · worked solutions for every part, with the mark scheme
Topics Presentation of Data and Observations · Analysis, Conclusions and Evaluation · Manipulation, Measurement and Observation · Use of the Light Microscope
Catalase breaks down hydrogen peroxide as shown in Fig. 1.1.
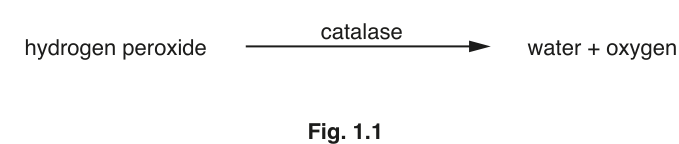
Fig. 1.1
The decrease in the concentration of hydrogen peroxide can be measured to investigate the progress of this enzyme-catalysed reaction.
Catalase can be found in plant extract.
Potassium manganate(VII) solution can be used to estimate the concentration of hydrogen peroxide.
The greater the concentration of hydrogen peroxide, the higher the volume of potassium manganate(VII) solution needed to reach the end-point.
The end-point is reached when the first colour change appears and stays for at least 5 seconds.
Potassium manganate(VII) solution will be added one drop at a time using a syringe.
Carry out step 1 to step 3 to practise releasing drops from a syringe.
- Fill a syringe with of distilled water, W.
- Hold the syringe over an empty beaker as shown in Fig. 1.2. Push the plunger slowly to release one drop.
- Repeat this until you can release one drop at a time.
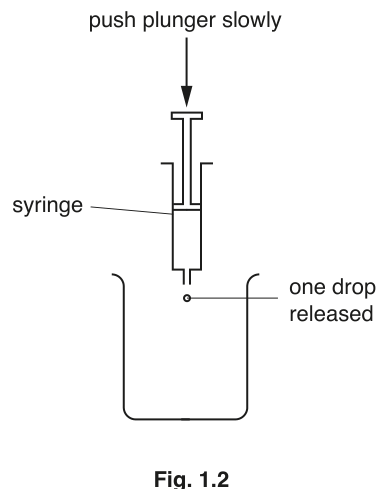
Fig. 1.2
You will need to investigate the effect of changing pH on the activity of the enzyme catalase by:
- changing the pH using different pH buffers
- measuring the volume of P needed to reach the end-point for each pH.
The lower the concentration of hydrogen peroxide remaining after 5 minutes, the lower the volume of P needed to reach the end-point.
You are provided with the materials shown in Table 1.1.
Table 1.1
| labelled | contents | hazard | volume/ |
|---|---|---|---|
| A | dilute sulfuric acid | irritant | 25 |
| H | 1% hydrogen peroxide solution | irritant | 25 |
| P | 1% potassium manganate(VII) solution | oxidising harmful | 50 |
| E | plant extract solution | harmful irritant | 25 |
| B3 | buffer pH3 | none | 10 |
| B4 | buffer pH4 | none | 10 |
| B5 | buffer pH5 | none | 10 |
| B6 | buffer pH6 | none | 10 |
| B7 | buffer pH7 | none | 10 |
If any solution comes into contact with your skin, wash off immediately under cold water.
It is recommended that you wear suitable eye protection.
Carry out step 4 to step 18 to investigate the effect of pH on the activity of catalase in the plant extract E.
- Label 5 beakers pH3, pH4, pH5, pH6 and pH7.
- Put of each buffer into the appropriately labelled beaker.
- Put of E into each beaker. Stir gently to mix.
- Leave the beakers for at least 1 minute. Stir gently to mix.
The reaction will start as soon as H is added to the mixture of E and buffer in step 8.
- Put of H into each beaker. Stir gently to mix.
- Leave for 5 minutes.
While you are waiting, use your time to continue with Question 1.
- After 5 minutes, put of A into each beaker. Stir gently to mix.
You will now test each solution to find the volume of P needed to reach the end-point.
- Put the beaker labelled pH3 onto a white tile.
- Fill the syringe labelled P with of P.
- Wipe off any P from the outside of the syringe with a paper towel.
- Put one drop of P, as shown in Fig. 1.2, into the beaker labelled pH3.
- Stir gently to mix.
- Repeat step 14 and step 15 until the end-point is reached.
You may need to refill the syringe with P.
- Record in (a)(ii) the volume of P added.
- Repeat step 11 to step 17 with each of the beakers labelled pH4, pH5, pH6 and pH7.
Think about the hazards of using the materials in Table 1.1.
State whether you think the risk of using the materials is low, medium or high.
Give a reason for your answer.
risk ______
reason ______
Record your results in an appropriate table.
State the independent variable in this investigation.
Use your results in (a)(ii) to suggest an optimum pH for catalase in this plant extract.
Give a reason for your answer.
optimum pH = ______
reason ______
Identify one source of error in this investigation.
Explain why this is a source of error.
source of error ______
explanation ______
Suggest how you would make improvements to this investigation in order to obtain a more accurate estimate of the optimum pH for catalase in this plant.
A student carried out another investigation into the effect of temperature on the release of oxygen from hydrogen peroxide, using a plant extract containing the enzyme catalase.
Test-tubes containing plant extract and hydrogen peroxide were placed in thermostatically controlled water-baths, at five different temperatures for 180 seconds.
The volume of oxygen produced was measured. All other variables were standardised.
The results are shown in Table 1.2.
Table 1.2
| temperature / | volume of oxygen produced in 180 seconds / |
|---|---|
| 17.5 | 3.7 |
| 25.0 | 6.4 |
| 38.5 | 9.8 |
| 47.5 | 4.3 |
| 60.0 | 0.3 |
Plot a graph of the data in Table 1.2 on the grid in Fig. 1.3.
Use a sharp pencil for drawing graphs.
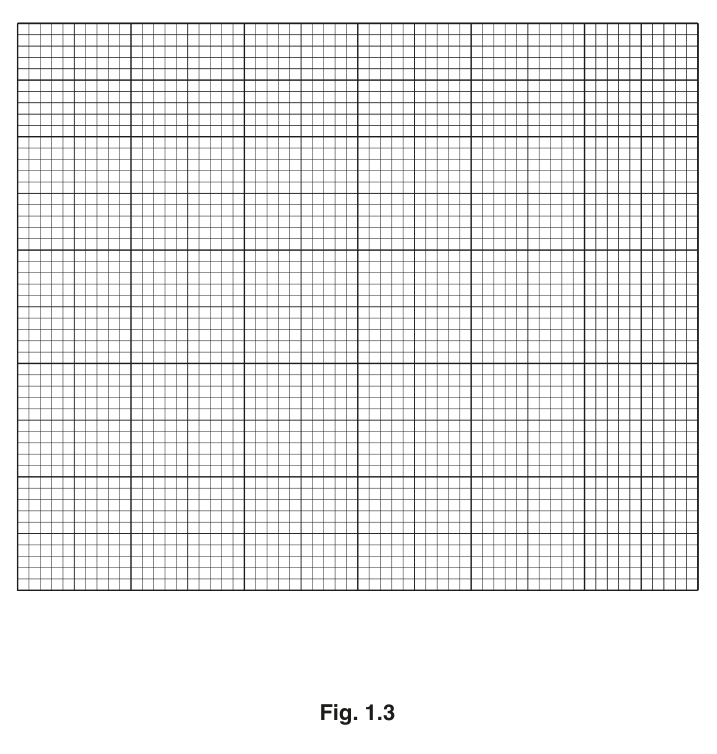
Fig. 1.3
Use your graph in Fig. 1.3 to determine the volume of oxygen produced when the temperature is .
Show on your graph how you determined your answer.
volume of oxygen = ______
Suggest an explanation for the results between and .
Suggest an appropriate control the student could have used for this investigation.
The rest of this paper
1 more questions- Q2Use of the Light Microscope · Analysis, Conclusions and Evaluation · Presentation of Data and Observations18M