Biology 9700/33 — February/March 2019
Cambridge AS Level · Advanced Practical Skills · worked solutions for every part, with the mark scheme
Topics Manipulation, Measurement and Observation · Analysis, Conclusions and Evaluation · Presentation of Data and Observations · Use of the Light Microscope
Plants transport sucrose through vascular bundles in stems and roots.
You are required to investigate the movement of sucrose solution.
The apparatus will be set up as shown in Fig. 1.1, using a large test-tube and a syringe.
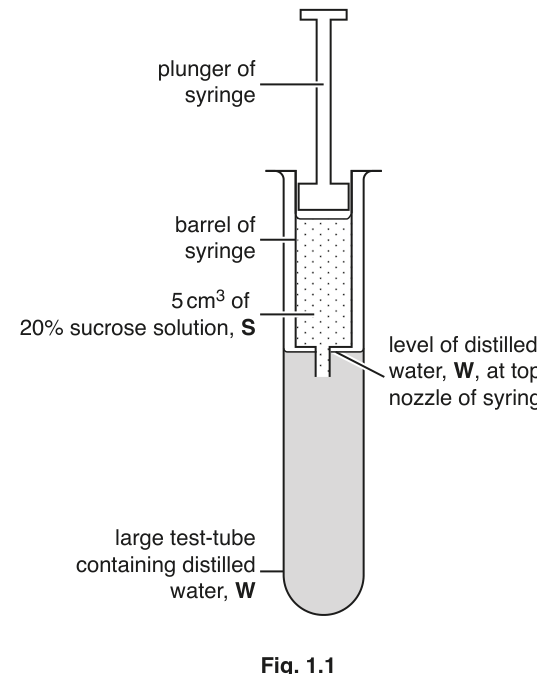
Fig. 1.1
You are provided with the materials shown in Table 1.1.
Table 1.1
| labelled | contents | hazard | volume / |
|---|---|---|---|
| S | 20% sucrose solution | none | 40 |
| W | distilled water | none | 300 |
Carry out step 1 to step 5 to investigate the movement of sucrose solution from the syringe.
- Set up the apparatus as shown in Fig. 1.1 but without any distilled water, W, in the large test-tube.
- Observe and record in (a)(i) your observations of any movement of the sucrose solution.
- Put W into the large test-tube. The level of W must be to the top of the nozzle of the syringe, as shown in Fig. 1.1.
- Observe and record in (a)(i) your observations.
- Empty the syringe and the large test-tube into the container labelled For waste.
Complete Table 1.2.
Table 1.2
| contents of large test-tube | observations |
|---|---|
| without distilled water | |
| with distilled water |
State a tissue in a plant vascular bundle in which the same type of movement occurs as that observed in (a)(i) when the large test-tube contains distilled water.
Give a reason for your answer.
tissue ______
reason ______
You will need to investigate the movement of the sucrose solution out of the syringe by:
- setting up the apparatus, as shown in Fig. 1.2
- collecting the sucrose solution released from the syringe during each of the first four two-minute periods after setting up the apparatus, as shown in Fig. 1.2
- testing the mixtures of sucrose solution and water collected during each of the four two-minute periods, using the non-reducing sugar test
- recording the time taken for the first colour change to occur when heating each mixture with Benedict’s solution during the non-reducing sugar test.
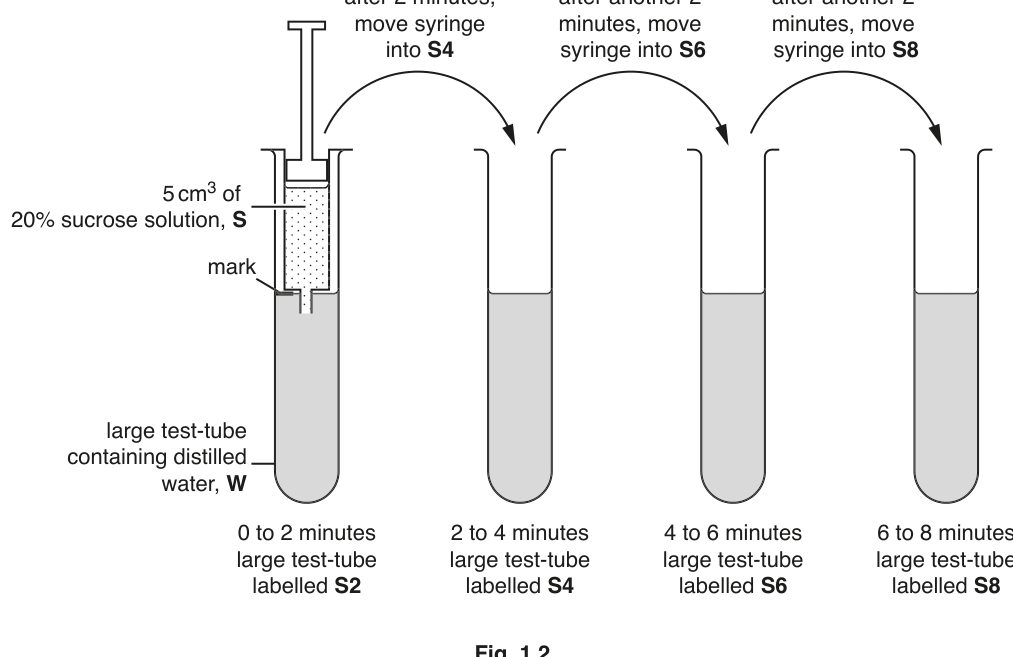
Fig. 1.2
- Set up a water-bath and heat the warm water to boiling. This will be used in step 20 and step 27 during the tests for non-reducing sugar.
- Label the four large test-tubes S2, S4, S6 and S8.
The apparatus needs to be set up as shown in Fig. 1.2 so that at the start there is a standard volume of distilled water in each of the large test-tubes S2, S4, S6 and S8.
- Put the empty syringe from step 5 into the large test-tube labelled S2.
- Put a mark on the large test-tube labelled S2, as shown in Fig. 1.2, so that the mark is level with the top of the nozzle of the syringe.
Describe how you will use the apparatus provided to find the volume of distilled water, W, needed to fill the large test-tube to the mark, when the syringe is in place.
Find the volume of distilled water, W, needed to fill the large test-tube to the mark, using the method you described in (b)(i).
volume = ______
- Put the volume of distilled water, W, stated in (b)(ii) into each of the four large test-tubes, S2, S4, S6 and S8.
- Fill a syringe with more than of sucrose solution, S. Push the plunger in to the mark to make sure that there are no air bubbles in the nozzle.
- Put the syringe into the first large test-tube, S2, as shown in Fig. 1.2. The nozzle of the syringe must be below the surface of the distilled water, W. Start the timer.
- Leave the syringe in the large test-tube S2 for 2 minutes, then remove the syringe and put it immediately into the next large test-tube, S4. The nozzle of the syringe must be below the surface of the distilled water, W. Leave for a further 2 minutes. Do not stop the timer.
- Repeat this process with each of the two remaining large test-tubes, S6 and S8, removing the syringe from the last large test-tube, S8, at 8 minutes. Each time, the nozzle of the syringe must be below the surface of the distilled water, W.
To estimate the rate of movement of the sucrose solution into distilled water, W, the solution collected in each large test-tube will be tested for non-reducing sugar. After hydrolysing any non-reducing sugar present, the measurement used will be the time taken for the first colour change to occur when the solution is heated with Benedict’s solution. This measurement allows the test to be semi-quantitative.
A student suggested the hypothesis that:
the rate of movement of the sucrose solution from the syringe into the water in the large test-tube will decrease with time.
If the student’s hypothesis is correct, describe the expected trend in the time taken for the first colour change to occur when each solution collected in the large test-tubes S2, S4, S6 and S8 is heated with Benedict’s solution.
You will test the samples of the solution collected during each two-minute period for non-reducing sugar, using step 15 to step 31.
You are provided with the materials shown in Table 1.3.
Table 1.3
| labelled | contents | hazard | volume / |
|---|---|---|---|
| H | dilute hydrochloric acid | irritant | 50 |
| A | 10g sodium hydrogencarbonate powder | none | — |
| Benedict’s | Benedict’s solution | harmful | 50 |
It is recommended that you wear suitable eye protection. If any of these materials come into contact with your skin, wash them off immediately under cold water.
- Put a bung into one of the large test-tubes, S2, S4, S6 or S8, and, with a finger on the top of the bung, shake the solution to mix well.
- Remove the bung and pour the solution from this large test-tube into a labelled beaker.
- Put of the solution in the beaker into a labelled small test-tube.
- Put of dilute hydrochloric acid, H, into the same small test-tube. Shake this test-tube gently to mix.
- Repeat step 15 to step 18 for each of the solutions in the remaining large test-tubes.
- Put all the small test-tubes into the boiling water-bath (set up in step 6). Leave the test-tubes for 2 minutes.
- After 2 minutes, remove the small test-tubes from the water-bath and put them into the beaker of water labelled For cooling.
You will need the boiling water-bath again for step 27.
- Leave the small test-tubes in the beaker to cool for 3 minutes. After 3 minutes, continue to step 23.
- Put a small amount of sodium hydrogencarbonate, A, into each small test-tube. The mixture will fizz and rise up inside each small test-tube.
- Repeat step 23 until there is no more fizzing and a small amount of sodium hydrogencarbonate, A, is left in the bottom of each test-tube.
- Put of Benedict’s solution into the small test-tube containing S2.
- Shake the small test-tube gently to mix.
- Put this small test-tube into the boiling water-bath. Start timing.
- Measure the time taken to the first appearance of a colour change in the small test-tube.
If there is no colour change after 180 seconds, stop timing and record the result in (b)(iv) as ‘more than 180’.
- Record in (b)(iv) the result from step 28.
- Remove the small test-tube from the boiling water-bath. Put the small test-tube in the test-tube rack.
- Repeat step 25 to step 30 with each of the other solutions instead of S2.
Record your results in an appropriate table.
The student’s hypothesis stated that:
the rate of movement of the sucrose solution from the syringe into the water in the large test-tube will decrease with time.
State whether your results provide evidence to support or reject this hypothesis.
Explain how your results provide evidence for this decision.
support or reject ______
explanation ______
A student modified the procedure by:
- using a 10% sucrose solution in the syringe
- collecting sucrose solution from the syringe in four-minute periods over a total time of 20 minutes
- collecting any precipitate (solid particles) formed during the Benedict’s test when testing each solution for non-reducing sugar
- drying and weighing the precipitate from each test to determine the mass of sucrose that had been present.
After carrying out the procedure, the student processed and analysed the results to calculate the rate of movement of the sucrose solution at specific times after placing the syringe in the large test-tube of water for the first time.
The calculated rates are shown in Table 1.4.
Table 1.4
| time / minutes | rate of movement of sucrose solution / arbitrary units (au) |
|---|---|
| 4 | 0.18 |
| 8 | 0.09 |
| 12 | 0.04 |
| 16 | 0.02 |
| 20 | 0.01 |
Plot a graph of the data in Table 1.4 on the grid provided.
Use a sharp pencil for drawing graphs.

Use your graph to find the rate of movement of sucrose solution at 5 minutes.
Show on the graph how you determined your answer.
rate of movement = ______
The procedure investigated how the rate of movement of sucrose solution from the syringe changed with time.
The procedure can be modified to investigate the effect of sucrose concentration, instead of time, on the rate of movement of sucrose solution. In the modified procedure, the sucrose solution from the syringe only needs to be collected once. The time period over which the sucrose solution is collected in the procedure needs to be standardised.
Use the graph to suggest a suitable time period for collecting the sucrose solution from the syringe.
Give a reason for your answer.
time period ______
reason ______
Think about how else you could modify this procedure to investigate the effect of using different concentrations of sucrose on the rate of movement of the sucrose solution.
State the concentrations of sucrose solution you would use.
______
Describe how the concentrations of sucrose solution would be prepared.
______
The rest of this paper
1 more questions- Q2Use of the Light Microscope · Manipulation, Measurement and Observation · Presentation of Data and Observations · Analysis, Conclusions and Evaluation19M