Biology 9700/36 — October/November 2018
Cambridge AS Level · Advanced Practical Skills · worked solutions for every part, with the mark scheme
Topics Presentation of Data and Observations · Manipulation, Measurement and Observation · Analysis, Conclusions and Evaluation · Use of the Light Microscope
The emulsion test is used to detect the presence of lipids in a sample.
To carry out the emulsion test, ethanol is added to the sample. If lipids are present they will dissolve in the ethanol. When water is then added, the lipids in the ethanol will form droplets in the water. The droplets in the water form an emulsion.
The emulsion appears as cloudiness in the layer towards the bottom of the test-tube, as shown in Fig. 1.1.
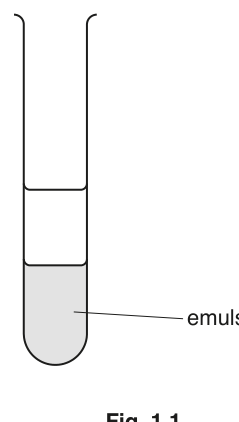
Fig. 1.1
A student investigated the effect of the concentration of ethanol on the cloudiness of the emulsion during the emulsion test.
The student suggested the following hypothesis:
lowering the concentration of ethanol below 100% will have no effect on the cloudiness of the emulsion.
You will need to investigate this hypothesis by:
- diluting 100% ethanol, A, to provide further concentrations of ethanol
- carrying out the emulsion test using these concentrations of ethanol
- recording the cloudiness of the emulsion formed.
You are provided with the materials shown in Table 1.1.
Table 1.1
| labelled | contents | hazard | volume / |
|---|---|---|---|
| A | 100% ethanol | flammable | 60 |
| L | vegetable oil (lipid) | flammable | 40 |
| W | distilled water | none | 60 |
If A comes into contact with your skin, wash off immediately under cold water.
It is recommended that you wear suitable eye protection.
You will need to use simple (proportional) dilution of the ethanol, A, to make further concentrations of ethanol between 100% and 75%, by reducing each successive dilution by 5%.
You need to prepare of each concentration.
Table 1.2 shows how to prepare the highest concentration (100%) and the lowest concentration (75%).
Complete Table 1.2 to show how you will prepare further concentrations of ethanol.
Table 1.2
| volume of A / | volume of W / | percentage concentration of ethanol |
|---|---|---|
| 10.0 | 0.0 | 100 |
| 7.5 | 2.5 | 75 |
Read step 1 to step 13 before carrying out this investigation.
- Prepare the concentrations of ethanol as shown in Table 1.2, in the beakers provided.
- Label one test-tube as a control.
- Put of L into this test-tube.
- Put of W into the same test-tube. Shake the test-tube gently for 20 seconds.
The control test-tube will be needed for step 10.
- Put of L into all the other test-tubes.
- Put of 100% ethanol into one of the test-tubes containing L. Shake the test-tube gently for 20 seconds.
- Put of W into the same test-tube. Shake the test-tube gently for 20 seconds.
- Repeat step 6 to step 7 with each of the other concentrations of ethanol as prepared in step 1.
- Leave all the test-tubes for approximately 1 minute so that the layers become visible.
- Observe the cloudiness of the emulsion, as shown in Fig. 1.1, in each test-tube compared with the control.
The control will not be cloudy.
Use the key in Fig. 1.2 and record the results in (a)(ii).
You may find it useful to observe the cloudiness of the emulsion with a piece of black card behind it.
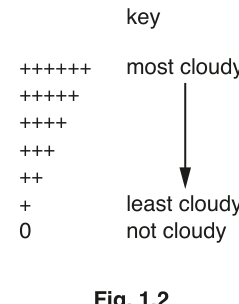
Fig. 1.2
- Tip the contents of each test-tube, except the control, into the container labelled For waste.
- Rinse these test-tubes twice using a syringe and the water in the container labelled For washing.
- Repeat step 5 to step 10.
Record your results in an appropriate table, including the mean result for each concentration of ethanol.
State the independent variable in the investigation you have just carried out.
Identify one significant source of error when measuring the dependent variable and suggest one improvement to reduce this source of error.
The student’s hypothesis stated that:
lowering the concentration of ethanol below 100% will have no effect on the cloudiness of the emulsion.
State whether you support or reject this hypothesis.
Explain how your results provide evidence for this decision.
support or reject ______
In the test-tubes the layer above the emulsion consists of undissolved lipids.
Suggest how the student could find the volume of ethanol required to dissolve all the lipid in L.
Some foods contain two types of fat, unsaturated fat (U) and saturated fat (S). The proportions of these two types of fat vary according to the food.
A scientist carried out some tests to determine the mass of these two types of fat found in three food samples, X, Y and Z. The total mass of each food sample was .
The results are shown in Table 1.3.
Table 1.3
| food sample | mass of fat in of food / (type of fat U) | mass of fat in of food / (type of fat S) |
|---|---|---|
| X | 10.75 | 23.50 |
| Y | 1.50 | 1.25 |
| Z | 8.50 | 6.50 |
Calculate the percentage of the total fat in food sample X that is unsaturated.
Show all the steps in your working and use appropriate units.
Draw a bar chart of the data shown in Table 1.3 on the grid in Fig. 1.3.
The bars should be separated for each food sample.
Use a sharp pencil for drawing bar charts.
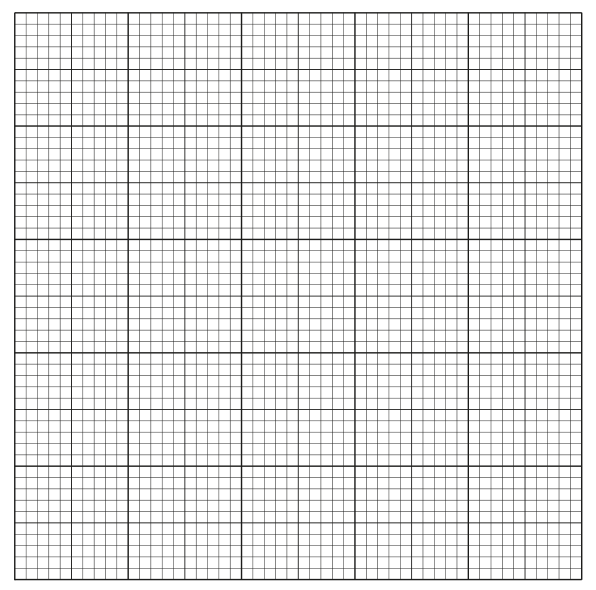
Fig. 1.3
The rest of this paper
1 more questions- Q2Use of the Light Microscope · Presentation of Data and Observations18M