Biology 9700/33 — October/November 2018
Cambridge AS Level · Advanced Practical Skills · worked solutions for every part, with the mark scheme
Topics Presentation of Data and Observations · Analysis, Conclusions and Evaluation · Manipulation, Measurement and Observation · Use of the Light Microscope
Plant cells contain enzymes which catalyse some of their metabolic reactions. Some of these enzymes catalyse the release of oxygen from hydrogen peroxide.
A cylinder of potato tissue will have these enzymes on the surface.
When hydrogen peroxide solution and a cylinder of potato tissue are mixed, oxygen bubbles are released.
You will need to investigate the effect of surface area by:
• changing the surface area
• counting the number of bubbles of oxygen released in a set time (dependent variable).
You are provided with the materials shown in Table 1.1 and Table 1.2.
Table 1.1
| labelled | contents | hazard | volume / |
|---|---|---|---|
| H | hydrogen peroxide solution | moderate | 40 |
| W | water | none | 100 |
If any of H comes into contact with your skin, wash off immediately under cold water.
It is recommended that you wear suitable eye protection and gloves.
Table 1.2
| labelled | contents | details | quantity |
|---|---|---|---|
| P | potato cylinders | same cross-sectional area | 4 |
(a) To investigate the effect of surface area, other variables need to be standardised.
Each potato cylinder has been provided with the same diameter but with different lengths.
Each cylinder of potato tissue must be cut to the same length.
- Cut each of the four potato cylinders in the beaker labelled P, to a length of .
To investigate the effect of surface area, the surface area can be changed by cutting each of these four cylinders into a different number of pieces.
The formula for calculating the total surface area of a cylinder is shown in Fig. 1.1.
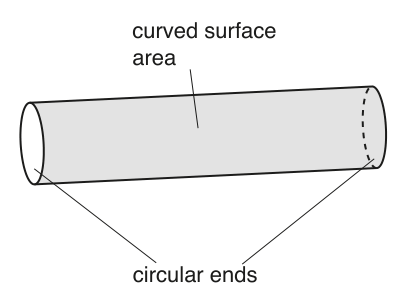
Total surface area of a cylinder = curved surface area + surface area of all the circular ends.
Fig. 1.1
The curved surface area of a cylinder can be calculated by using the formula:
All the cylinders start with the same length () and have the same radius, so the curved surface area is standard.
The total curved surface area is the same for all four cylinders, even when a cylinder is cut into several pieces, as shown in the example on page 4.
To change the total surface area, each cylinder is cut into a different number of pieces.
The change in surface area depends on the number of the circular ends, .
EXAMPLE
One cylinder has 2 circular ends as shown in Fig. 1.2.
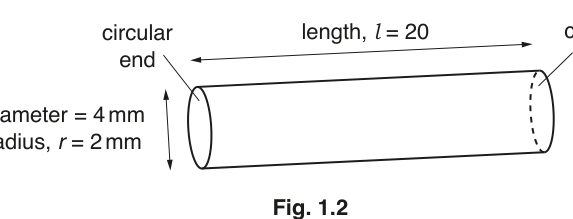
Fig. 1.2
• number of circular ends,
• area of one circular end = (to the nearest whole number)
• surface area of all the circular ends =
Fig. 1.3 shows another cylinder with the same radius and length, which is cut into two pieces. There are then 4 circular ends.
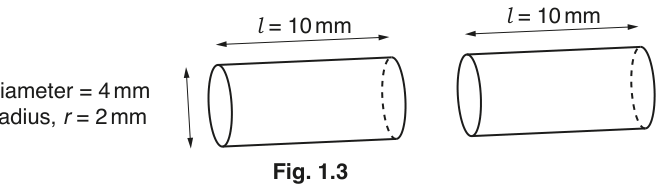
Fig. 1.3
• total number of circular ends,
• area of circular end = to the nearest whole number
• surface area of all the circular ends =
(to the nearest whole number)
Measure the diameter of one of the cylinders in P and calculate the radius, .
= ______
Place one potato cylinder on a flat surface and lay a ruler (in ) across its circular end, measuring the widest distance. Halve the value to obtain the radius.
Answer
r = 2 mm
Background Concept
A cylinder has two key cross-sectional measurements: the diameter (the distance straight across the circular end, through the centre) and the radius (the distance from the centre to the edge). The relationship is:
The radius is the quantity that appears in every formula we will use in this question — for the curved surface area () and for the area of a circular end (). So the first job in any cylinder-area calculation is to determine accurately.
Understanding the Question
The question stem tells you that all four potato cylinders in P were supplied with the same cross-sectional area — so the same diameter and therefore the same radius — but with different lengths. Before any calculation, you must measure the diameter of one cylinder yourself (rather than assume the value shown in the figure) so that every later calculation rests on a real measurement. The mark scheme accepts the answer within a sensible range, to the nearest whole mm or to 0.5 mm, reflecting ruler precision.
Approach
- Place one potato cylinder flat on the bench and lay a mm ruler across its circular end, measuring the widest distance across the circle (this is the diameter).
- Read the value to the nearest mm (or 0.5 mm if your ruler allows).
- Halve it to get the radius.
Step-by-Step Reasoning
Fig. 1.2 in the question stem shows a cylinder with diameter = 4 mm and radius = 2 mm. When you measure your own cylinder with a ruler, the diameter should be close to 4 mm, giving a radius close to 2 mm. The mark scheme accepts values in a sensible range around this, so a value of 2 mm (or anything in the range ~1.5–2.5 mm to 0.5 mm) is appropriate.
Key Takeaways
- Always measure a quantity rather than assume a value from a diagram, even when the diagram is provided.
- The radius is half the diameter, and is the quantity used in cylinder-area formulae.
- Record measurements to the precision of the instrument (a ruler typically to the nearest mm or 0.5 mm).
Common Mistakes
- Forgetting to halve the diameter and writing the diameter into the space for the radius.
- Recording the radius in cm instead of mm, then forgetting to convert when substituting into formulae that use mm.
- Reading the ruler from an angle (parallax error) and over-estimating the diameter.
Things to Be Careful About
- The question says one of the cylinders, not each — you only need one measurement because all cylinders have the same cross-section.
- The unit of the radius should match the unit of length you will use later; the rest of the question uses mm, so the radius should be in mm.
- Do not give an answer with spurious decimal places (e.g. 1.97 mm) that a ruler cannot resolve.
Calculate the curved surface area, to the nearest whole number, using .
curved surface area = ______
Working
Answer
curved surface area =
251 mm²
Background Concept
The curved surface area of a cylinder (the area of its outer side, excluding the two flat ends) is given by:
where is the radius of the circular end and is the length of the cylinder. This formula is obtained by 'unrolling' the curved surface into a flat rectangle of width (the circumference) and height .
Understanding the Question
Part (a)(ii) asks you to calculate the curved surface area of one of the 20 mm-long potato cylinders, using the radius you measured in (a)(i). The question stem gives the formula with and already substituted, so the only variable you need to insert is your measured value of . The answer should be rounded to the nearest whole number and quoted with the correct unit of area.
Approach
- Substitute your value of from (a)(i) into the expression .
- Evaluate the result.
- Round to the nearest whole number.
- Quote the correct unit of area (mm², since all lengths are in mm).
Step-by-Step Reasoning
With mm:
Rounded to the nearest whole number: .
Note that the curved surface area is the same for all four cylinders, because they all have the same radius and the same total length (20 mm), even after being cut into pieces. Cutting a cylinder into shorter pieces does not change its total curved surface area — the new surfaces created by the cuts are ends, not additional curved surface.
Key Takeaways
- The formula gives the curved (lateral) surface only — it excludes the two flat ends.
- Cutting a cylinder into pieces changes the number of ends but not the total curved surface area.
- Always quote the correct unit, and match it to the unit of length used in the calculation.
Common Mistakes
- Forgetting to give the unit, or giving a linear unit (mm) instead of an area unit (mm²).
- Using (the diameter) instead of .
- Failing to round to the nearest whole number as the question asks.
Things to Be Careful About
- The mark scheme awards 1 mark for the correct numerical value (rounded) and 1 separate mark for the unit — make sure both are present.
- The unit may be written as mm² or cm², but using mm² is more consistent with the lengths given in mm and the end area in (a)(iii).
For the potato cylinders in P, use to calculate the area of one circular end to the nearest whole number.
Use as 3.14 and use as recorded in (a)(i).
area of one circular end = ______
Working
Answer
area of one circular end =
13 mm²
Background Concept
The area of a circle is:
Because the ends of a cylinder are circles, this same formula gives the area of one flat end of a potato cylinder. It is independent of the length of the cylinder — only the cross-section matters.
Understanding the Question
Part (a)(iii) asks for the area of one circular end of a potato cylinder, using and the radius you measured in (a)(i). The answer should be rounded to the nearest whole number. This single value will then be reused in every row of Table 1.3, so it is worth getting right first time.
Approach
- Square the radius from (a)(i).
- Multiply by 3.14.
- Round to the nearest whole number.
Step-by-Step Reasoning
With mm:
Rounded to the nearest whole number: . This matches the worked example in the question stem, which used the same radius of 2 mm.
Key Takeaways
- The area of a circle increases with the square of the radius — doubling the radius quadruples the end area.
- A small change in radius produces a relatively large change in end area, so this calculation is sensitive to the precision of the radius measurement.
Common Mistakes
- Using as 3.14159... instead of 3.14 (the question specifies 3.14).
- Using the diameter (4) instead of the radius (2), giving 50 mm² instead of 13 mm².
- Forgetting to square the radius.
- Giving the answer to 1 decimal place (12.6) instead of to the nearest whole number.
Things to Be Careful About
- The answer should be to the nearest whole number, matching the example in the question stem.
- This value is reused in every row of Table 1.3, so record it carefully and copy it accurately into each row.
Complete Table 1.3 to calculate the total surface area when using different numbers of pieces to include:
• one whole cylinder
• one cylinder cut into two pieces
• two other cylinders cut into two different numbers of pieces.
Table 1.3
| number of pieces cut from one cylinder | number of circular ends, | area of one circular end from (a)(iii) / | surface area of all the ends / | curved surface area from (a)(ii) / | total surface area / |
|---|---|---|---|---|---|
| 1 | 2 | ||||
| 2 | 4 | ||||
- Cut each of the four cylinders into the number of pieces, as shown in Table 1.3.
- Put the pieces into the shallow dish labelled C.
Cover with a damp paper towel to prevent the pieces from drying out.
You will use the apparatus as shown in Fig. 1.4.
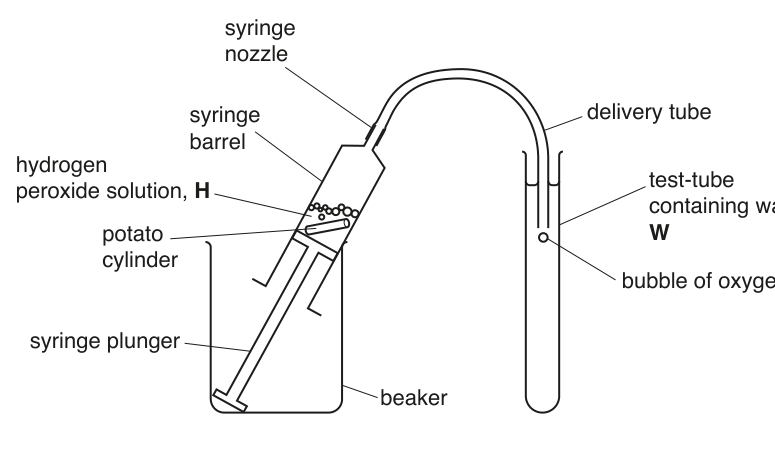
Fig. 1.4
Answer
| number of pieces cut from one cylinder | number of circular ends, | area of one circular end from (a)(iii) / | surface area of all the ends / | curved surface area from (a)(ii) / | total surface area / |
|---|---|---|---|---|---|
| 1 | 2 | 13 | 26 | 251 | 277 |
| 2 | 4 | 13 | 52 | 251 | 303 |
| 4 | 8 | 13 | 104 | 251 | 355 |
| 8 | 16 | 13 | 208 | 251 | 459 |
see table
Background Concept
When a cylinder is cut into pieces, the total number of circular ends is:
because each piece has two ends and the original outer ends are still there. The total surface area of all the ends is therefore:
The total surface area of the cut pieces is the sum of the curved surface area (unchanged by cutting) and the end surface area:
This is the independent variable of the experiment: it determines how much catalase is exposed to the hydrogen peroxide, and therefore how fast oxygen is released.
Understanding the Question
You are given Table 1.3 with two rows already started (1 piece, 2 pieces) and asked to add two further rows using different numbers of pieces. You must:
- fill in the first column (number of pieces) for the two new rows,
- fill in the last column (total surface area) for the row where the cylinder is cut into 2 pieces,
- and (for full marks) the last column for the two new rows too.
The mark scheme explicitly credits a mark for choosing 4 then 8 pieces (any two different numbers greater than 2 are acceptable, but 4 and 8 give a sensible spread of total surface area).
Approach
- Pick two new numbers of pieces — for example, 4 and 8. (Any two different numbers greater than 2 are acceptable.)
- For each row, calculate:
- (number of pieces)
- end area = (using 13 mm² from (a)(iii))
- total surface area = end area + 251 (curved SA from (a)(ii))
Step-by-Step Reasoning
For 1 piece: , end area = , total = .
For 2 pieces: , end area = , total = .
For 4 pieces: , end area = , total = .
For 8 pieces: , end area = , total = .
Key Takeaways
- The total surface area is dominated by the curved surface when the cylinder is long, but cutting into more pieces progressively increases the contribution from the ends.
- The relationship between number of pieces and total surface area is linear: doubling the number of pieces adds to the end area.
- Each row of the table is built from the same three components (n, end area, curved area) — keeping the working systematic makes the table easy to fill in correctly.
Common Mistakes
- Halving instead of doubling the number of pieces to get .
- Forgetting that the curved surface area is the same in every row.
- Choosing numbers of pieces that are too similar (e.g. 2 and 3) — this does not give a wide enough range of total surface area to investigate the effect properly.
Things to Be Careful About
- The two extra rows you add should use clearly different numbers of pieces from each other and from 1 and 2, so that the range of total surface area is wide enough to show a clear trend in bubble count later.
The position of the delivery tube in the test-tube of water should be standardised to have confidence in the results.
Describe how you will standardise the position of the delivery tube in the test-tube of water, as shown in Fig. 1.4.
Answer
Make a mark (e.g. with a pen or a small piece of tape) on the delivery tube a fixed distance from its end. When setting up each trial, lower the delivery tube into the test-tube of water until the mark is level with the rim of the test-tube, so the end of the delivery tube is always at the same depth in the water.
Mark the delivery tube so the end is at the same depth in the water for every trial.
Background Concept
A control variable (or standardised variable) is a factor held constant across all trials so that it cannot be the cause of any observed differences. If a variable is not controlled, it becomes a confounding variable and the experiment can no longer be a fair test of the independent variable.
In this experiment the depth of the delivery-tube end in the water influences how easily oxygen bubbles emerge and how easy they are to count. A tube end that is shallow lets bubbles escape quickly and individually; a deep end may cause back-pressure on the syringe and slow the gas flow. So the position must be the same in every trial.
Understanding the Question
Part (a)(v) asks specifically how you would standardise the position of the delivery tube inside the test-tube of water, so that you can be confident any difference in bubble count is due to the surface area of the potato and not to a difference in the depth at which the tube is sitting.
Approach
The principle is to set a fixed reference point on the delivery tube itself, so that each time the tube is placed in the test-tube it sits at exactly the same depth. This is most easily done with a small mark (pen, varnish, or a small label) placed a measured distance from the end of the tube.
Step-by-Step Reasoning
- Measure a fixed distance from the open end of the delivery tube (for example 1 cm).
- Mark this position clearly with a pen, or attach a small piece of tape as a visible ring.
- When setting up the test-tube, lower the delivery tube into the water until the mark is level with the rim of the test-tube. The end of the tube is then at the same depth every time.
- Use this same procedure for every trial and every repeat.
Key Takeaways
- A control variable is best standardised by creating a fixed, physical reference, not by trying to estimate the depth by eye.
- Anything that can change between repeats — including the position of apparatus — must be controlled if results are to be comparable.
- The mark scheme credit comes from naming the practical action (mark the tube) AND its purpose (end always at the same depth).
Common Mistakes
- Saying 'put the tube in the same place' without describing how (the marking step is the key).
- Standardising the test-tube position (less of a problem because the test-tube is held in a rack) instead of the delivery tube position.
- Describing standardisation of an unrelated variable (e.g. temperature), which does not answer the question.
Things to Be Careful About
- The question is about the position of the delivery tube in the test-tube of water, not the position of the syringe in the beaker.
- The mark scheme credits a specific, actionable step (a mark on the tube) — describing the aim alone ('keep the depth the same') does not earn the mark on its own.
- Set up the test-tube with W and the delivery tube, as shown in Fig. 1.4 and described in (a)(v). Do not attach the tubing to the syringe. You may stand the test-tube in the test-tube rack provided.
- Remove the plunger from the syringe.
- Put potato tissue into the barrel of the syringe, for example the whole cylinder in one piece.
- Replace the plunger and push it to the mark, as shown in Fig. 1.5.
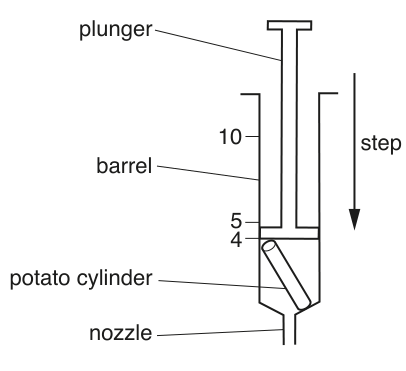
Fig. 1.5
- Put the nozzle of the syringe into the beaker containing H.
- Pull the plunger out to the mark so that H enters the syringe, as shown in Fig. 1.6.
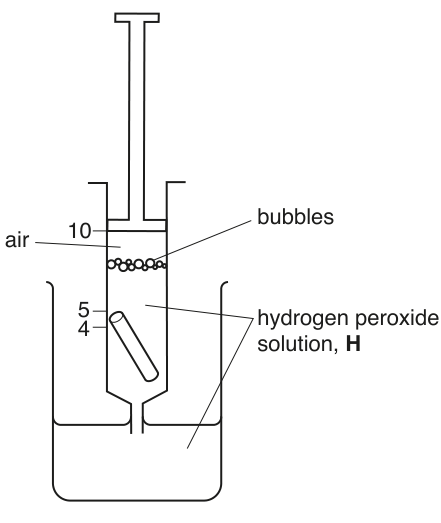
Fig. 1.6
- Hold the syringe above the beaker containing H and push the plunger to adjust the level of H to the mark in the syringe, as shown in Fig. 1.7.
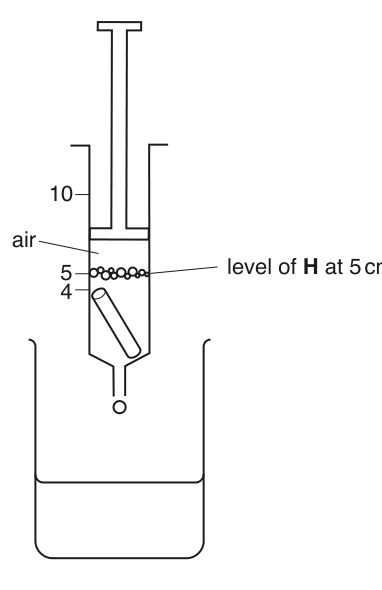
Fig. 1.7
- Turn the syringe upside down so that the nozzle is up and there is air in the top of the syringe barrel. Carefully wipe the nozzle with a paper towel to remove excess H.
- Tap the syringe barrel to make sure all the potato pieces are in H.
- Attach the delivery tube to the nozzle to make an airtight fit.
- Put the syringe into a beaker as shown in Fig. 1.4 (page 5).
- Put the end of the delivery tube back into the test-tube as described in (a)(v).
- Start timing when the first bubble is observed in the water in the test-tube.
- Count the bubbles at intervals of 30 seconds up to 120 seconds. Record the results in (a)(vi).
- Using a paper towel to avoid H coming into contact with your skin, remove the delivery tube from the syringe, keeping the syringe nozzle up.
- Then push the plunger to empty as much as possible of H into the container labelled 'For waste'.
- Slowly pull out the plunger and put the potato tissue and remaining H into the container labelled 'For waste'.
- Repeat step 6 to step 20 with both of the pieces from the cylinder cut into two pieces.
- Repeat step 6 to step 20 with each of the other two cylinders which have been cut into different numbers of pieces.
Record your results for the total surface area as shown in Table 1.3 and the number of bubbles at each 30 seconds in an appropriate table.
Answer
| Total surface area / | Number of bubbles at | |||
|---|---|---|---|---|
| 277 | representative | representative | representative | representative |
| 303 | representative | representative | representative | representative |
| 355 | representative | representative | representative | representative |
| 459 | representative | representative | representative | representative |
Representative example for the largest surface area (459 , 8 pieces) — cumulative totals at each time point:
| Time / | Total bubbles |
|---|---|
| 30 | 18 |
| 60 | 35 |
| 90 | 51 |
| 120 | 65 |
The number of bubbles should be greater for larger surface areas at every time point — i.e. the row for 459 should contain higher counts than the row for 277 at every time point.
See working — student-dependent data table.
Background Concept
A results table in a Cambridge practical paper must follow a small set of conventions:
- The independent variable is normally placed in the left-most column.
- Each column heading includes the quantity and the unit separated by a solidus ('/').
- All entries in a column are recorded to the same number of decimal places.
- The data must show the expected biological trend (here: more bubbles at larger surface area), and the trend should be reproducible.
The independent variable here is total surface area (varied by cutting the cylinders into different numbers of pieces), and the dependent variable is the number of bubbles of oxygen released at each of four time points.
Understanding the Question
Part (a)(vi) is the data-recording step of the experiment. After carrying out the procedure for all four surface areas, you must record your results in an appropriate table. The exam mark scheme rewards five things:
- a heading for the number of bubbles at each time point,
- a heading for total surface area with the correct unit (mm²),
- the four time points 30, 60, 90 and 120 s,
- results for at least three surface areas across at least three time periods,
- a sensible trend — bubbles for the lowest surface area < bubbles for the largest surface area.
Approach
- Draw a table with the four total surface areas in the first column (in increasing order is clearest).
- Make column headings that read 'Number of bubbles at 30 s', 'Number of bubbles at 60 s', etc. — or a single combined heading 'Number of bubbles at time t / s' with sub-columns.
- Fill in the counts as the experiment proceeds, reading the cumulative total at each time point.
- Check the trend: bubble counts must increase with total surface area.
Step-by-Step Reasoning
A well-presented table looks like the layout shown in the solution above. The independent variable (total surface area) is in the left column so the eye can scan down the rows and see the effect of increasing surface area at any one time. The cumulative bubble count at each time point is recorded in the body of the table.
If you want to find the rate in a 30-second interval (used in (a)(vii)), it is convenient to add a derived column 'Bubbles in each 30 s' obtained by subtracting consecutive cumulative values. This makes the calculation in (a)(vii) much quicker.
The trend in the data must be monotonic: at every time, more bubbles should be counted for a higher surface area than for a lower one. If the trend is the opposite, the experiment has gone wrong — most likely because the pieces of potato were not actually all in the hydrogen peroxide, or because the bubbles were being counted at a different depth in the water (the (a)(v) standardisation was missed).
Key Takeaways
- A results table must combine the independent variable, the dependent variable and the time at which the dependent variable was measured.
- Headings must include units.
- The recorded data should match the expected biological trend — if it does not, that is itself information and should be queried.
- Derived columns (e.g. bubbles per 30 s) make later calculations much easier.
Common Mistakes
- Omitting units from the headings (or putting the unit in the body of the table instead of the heading).
- Putting time as the first column and surface area across the top — this is acceptable but harder to read.
- Recording the number of bubbles per 30 s interval instead of the cumulative total at each time point, which makes it impossible to draw a cumulative graph later.
- Recording data that shows the wrong trend (more bubbles for the smaller surface area), which loses the trend mark.
Things to Be Careful About
- The values shown are representative — the actual numbers depend on your own experiment. The structure and conventions of the table are what earn the marks, not the specific numbers.
- Each column should have a consistent number of decimal places (whole numbers here, since you cannot count a fraction of a bubble).
- The trend mark requires the row for the largest total surface area to have the largest number of bubbles at any given time — check this before leaving the experiment.
Using the results in (a)(vi), calculate for the largest surface area:
• the mean number of bubbles in 30 seconds
• the rate of activity, .
Show all the steps in your working and use appropriate units.
mean number of bubbles = ______
rate of activity = ______
Working
Using the four counts of bubbles released in each 30 s interval for the largest surface area (representative example): 18, 17, 16, 14.
To convert from per 30 s to per minute, multiply by 2 (because ):
Answer
mean number of bubbles = (per 30 s)
rate of activity =
mean ≈ 16 bubbles per 30 s; rate ≈ 33 min⁻¹
Background Concept
A mean is calculated by adding all the values together and dividing by the number of values:
A rate is a quantity per unit time. To convert a count per 30 s into a count per minute, multiply by 2 (because there are two 30-second intervals in one minute).
Understanding the Question
Part (a)(vii) asks you to use the data you recorded in (a)(vi) for the largest total surface area (i.e. the 8-piece cylinder, total surface area 459 mm² in the worked example) to calculate:
- the mean number of bubbles released in a 30 s interval,
- the rate of activity, expressed in .
You must show all the working; the mark scheme specifically awards a mark for writing 'addition of results divided by number of results' as the calculation step.
Approach
- For the largest surface area, identify the four 30 s interval counts (subtract consecutive cumulative totals if you recorded cumulative values).
- Sum them and divide by 4 to find the mean.
- Multiply the mean by 2 to convert from per 30 s to per minute.
- Quote the rate with the correct unit ().
Step-by-Step Reasoning
Using the representative interval counts 18, 17, 16, 14 (so the cumulative at 120 s is 65):
The rate has units of 'number of bubbles per minute', written as .
Key Takeaways
- A mean always requires the addition step to be visible in the working — the mark scheme explicitly credits this.
- Rates are quoted in the form 'quantity per unit time' with the time unit in the denominator.
- The conversion factor from per 30 s to per minute is always 2.
Common Mistakes
- Dividing the cumulative total at 120 s by 4 without first working out the per-interval counts — this gives the mean cumulative count, not the mean rate.
- Forgetting to multiply by 2 to convert to .
- Quoting the rate with the unit 'bubbles per minute' rather than , or omitting the unit entirely.
Things to Be Careful About
- The mean should be calculated from the four 30 s interval counts, not from the four cumulative totals at 30, 60, 90, 120 s (those would give a much larger, biologically meaningless number).
- The rate must be quoted with the correct unit. Cambridge conventions accept or 'per min' but expect a clear unit.
- The mark scheme awards 1 mark for using the largest surface area data, 1 for the mean calculation step, and 1 for the rate with units.
A significant source of error in this procedure is the different size of the bubbles which are released. An improvement to reduce this error would be to measure the volume of oxygen released.
Complete Table 1.4 to suggest:
• how to measure the volume of oxygen released
• one other significant source of error in this procedure
• how to make an improvement to reduce this other error.
Table 1.4
| significant source of error | how to make an improvement |
|---|---|
| different sizes of bubbles released | |
| another significant source of error | |
| ______________________________ |
Answer
| significant source of error | how to make an improvement |
|---|---|
| different sizes of bubbles released | collect the oxygen in a gas syringe, or by displacement of water, and measure the volume of oxygen released |
| different amounts of catalase in different potatoes | cut all four potato cylinders from the same potato so the catalase activity is comparable |
see table
Background Concept
A source of error is a specific feature of the procedure that introduces variability into the dependent variable that is not due to the independent variable. An improvement is a change to the procedure that removes or reduces that specific source of variability. Good answers in Cambridge practical papers always pair an error with a concrete, targeted improvement — vague answers such as 'human error' or 'be more accurate' earn no credit.
The question stem has already pre-filled the first row of the table with the error 'different sizes of bubbles released' and asks for an improvement to that error, plus a different significant source of error with its own improvement.
Understanding the Question
Table 1.4 has two error/improvement rows to complete:
- Row 1 (error already given): suggest an improvement to the bubble-size error.
- Row 2 (entirely blank): suggest a different significant source of error and pair it with a concrete improvement.
Approach
- For the bubble-size row, the most direct improvement is to stop counting bubbles and instead measure the volume of oxygen released. A gas syringe (a graduated syringe that can be pushed out by gas) or water displacement (collect the gas over water in a measuring cylinder or burette) both work.
- For the second error, look for any biological factor that varies between the four cylinders. The most obvious is that the cylinders come from different parts of the potato (or different potatoes), so they contain different amounts of catalase. The improvement is to use cylinders from the same potato (or to standardise mass of tissue).
Step-by-Step Reasoning
Error 1 — different sizes of bubbles: Counting bubbles gives a count, not a measure of oxygen produced. Two large bubbles can carry the same volume of oxygen as ten small bubbles, so the bubble count is an unreliable proxy for the actual rate of the reaction. The improvement is to use a gas syringe or water displacement to measure the volume of oxygen directly. A gas syringe is easier to read off at intervals; water displacement in a measuring cylinder or burette is a useful alternative if no gas syringe is available.
Error 2 — different amounts of catalase in different potatoes: Catalase is the enzyme that breaks down hydrogen peroxide. If the four cylinders come from different potatoes (or different parts of different potatoes) the catalase concentration per cylinder will vary, and this variation will affect the bubble count independently of the surface area. The improvement is to cut all four cylinders from the same potato, so the catalase content per cylinder is approximately constant.
Other valid error/improvement pairs (worth knowing):
- Hydrogen peroxide concentration may be slightly different in different syringes → use the same stock solution for all four trials.
- Temperature may change during the experiment → use a water bath at constant temperature, or carry out the trials in a temperature-controlled room.
- Bubbles are counted by eye and may be missed → use a gas syringe or data logger to measure volume continuously.
Key Takeaways
- Improvements must be specific and target the named error — 'be more careful' or 'repeat the experiment' are not accepted as improvements.
- The best improvements either measure the dependent variable more directly (e.g. volume of gas instead of bubble count) or control a confounding variable (e.g. using tissue from the same source).
- The mark scheme credits 1 mark for the volume measurement, 1 for a different error, and 1 for a paired improvement to that second error.
Common Mistakes
- Writing a vague improvement such as 'measure more accurately' for the bubble-size row — the question requires a named piece of apparatus or method.
- Pairing the second improvement with the same error (bubble size) rather than a different source of error.
- Naming 'human error' or 'timing error' as the second error — these are too vague for credit.
Things to Be Careful About
- The mark scheme credits (a) the volume-measurement improvement, (b) a different source of error, and (c) a paired improvement to that second error. All three are needed for full marks.
- The improvement must be one the candidate can actually carry out in a school lab — 'use mass spectrometry' is not a realistic improvement.
Think about how you could modify this procedure to investigate the effect of concentration of substrate, starting with 6% hydrogen peroxide, on the activity of the enzyme (catalase) in the potato tissue.
Describe how you could change the independent variable, concentration of substrate.
Answer
Prepare at least five different concentrations of hydrogen peroxide (e.g. , , , , , ) by serial or proportional dilution of the stock solution with water. Use each concentration in a separate trial with the same procedure described in (a)(vi).
Use at least 5 concentrations of hydrogen peroxide prepared by serial or proportional dilution from a 6% stock.
Background Concept
The independent variable is the factor the experimenter deliberately changes. In the original experiment it is the total surface area of the potato tissue. In this modified experiment it is the concentration of hydrogen peroxide (the substrate of catalase). To investigate its effect properly:
- the experimenter must prepare a sensible range of concentrations (spanning the values where the effect is expected to change),
- the experimenter must use a sensible number of different values (at least 5 is the Cambridge convention, so that a graph through the points shows a clear trend),
- the concentrations must be prepared accurately by dilution of a known stock solution.
A serial dilution is a stepwise dilution: each tube contains half (or some fixed fraction) of the concentration of the previous one. A proportional dilution mixes specific volumes of stock and water to give each target concentration directly (e.g. of stock + of water gives a 1-in-6 dilution).
Understanding the Question
The question asks specifically how to change the independent variable, concentration of substrate — i.e. how to set up the different concentrations of hydrogen peroxide that will be tested.
Approach
- Decide on a sensible range of concentrations (between and the stock, e.g. , , , , , , ).
- Decide on the dilution method (serial or proportional).
- Describe the dilution method clearly enough that another person could follow it.
Step-by-Step Reasoning
Proportional dilution example, starting from a stock:
- — use the stock undiluted.
- — mix equal volumes of stock and water ().
- — mix volume of stock with volumes of water ().
- And so on.
Serial dilution example:
- Place of water into each of five test tubes.
- Add of stock to the first tube → solution.
- Mix and transfer of the solution to the second tube → solution.
- Repeat to halve the concentration at each step.
In both cases, at least 5 different concentrations should be tested, and the same procedure as in (a)(vi) is then followed for each one (with the same potato tissue, same temperature, same timing).
Key Takeaways
- Varying an independent variable means preparing a range of values, not just two.
- Cambridge convention is at least 5 values of the independent variable for a fair investigation.
- The method of preparation (serial or proportional dilution) is the practical core of the answer.
Common Mistakes
- Saying 'use different concentrations' without specifying how many or how to make them.
- Describing a single dilution (e.g. only) instead of a range.
- Naming the dependent variable (number of bubbles) or a control variable (temperature) instead of describing how to change the independent variable.
Things to Be Careful About
- The mark scheme credits 1 mark for stating that at least 5 different concentrations are used, prepared by serial or proportional dilution. Both parts — the number and the method — are needed for full credit.
The rest of this paper
1 more questions- Q2Use of the Light Microscope · Analysis, Conclusions and Evaluation · Presentation of Data and Observations21M