Biology 9700/31 — October/November 2018
Cambridge AS Level · Advanced Practical Skills · worked solutions for every part, with the mark scheme
Topics Presentation of Data and Observations · Manipulation, Measurement and Observation · Analysis, Conclusions and Evaluation · Use of the Light Microscope
Yeast cells contain enzymes which catalyse the breakdown of glucose to produce ethanol and carbon dioxide. This process is used to make beer. After the beer has been made, the yeast is no longer needed and is removed.
The yeast cells are removed by allowing the cells to sink slowly to the bottom of the container, forming a sediment. This process is called sedimentation.
You will need to follow the progress of sedimentation of yeast cells in a test-tube. You will need to measure the height of the sediment at different times, for a total of 10 minutes.
You will use a graph paper scale to measure the sediment.
Test-tube A in Fig. 1.1 shows how the test-tube will be set up at the start (0 minutes).
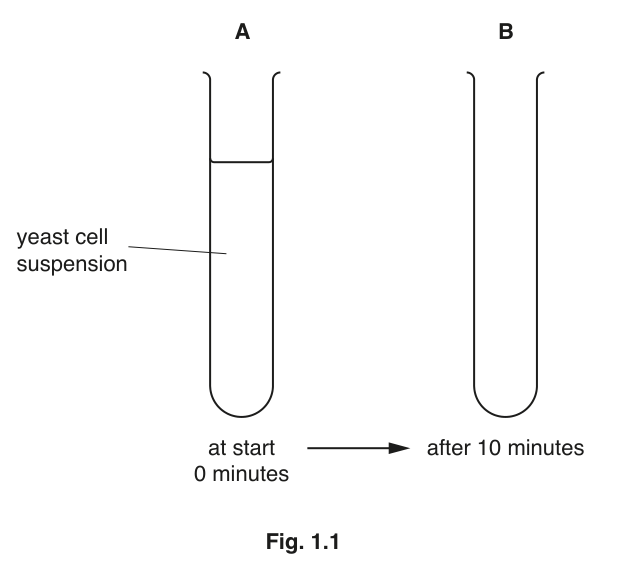
Fig. 1.1
Decide what you would expect the contents of the test-tube to look like after 10 minutes of sedimentation.
Draw on test-tube B in Fig. 1.1:
- the layers that you expect to see after 10 minutes of sedimentation
- label lines and labels for the layers.
Answer
On test-tube B in Fig. 1.1, draw:
- a horizontal line across the tube at the same level as the surface of the liquid in test-tube A, marking the slightly lower liquid surface after 10 minutes;
- a second horizontal line a short distance above the closed bottom of test-tube B and shade/hatch the region between this line and the bottom of the tube to show the layer of settled yeast cells;
- a label line (no arrowhead) from this shaded layer to the word sediment.
See drawing on test-tube B: supernatant above a small shaded sediment layer at the bottom, with the layer labelled.
Background Concept
Yeast cells are denser than water. When a yeast suspension is allowed to stand, the cells sink under gravity to form a sediment at the bottom of the container, while the supernatant (clarified liquid) above becomes progressively clearer. The interface between sediment and supernatant is a fairly sharp horizontal boundary that builds up over time.
Understanding the Question
The question asks the candidate to predict, and then draw, what test-tube B will look like after 10 minutes of sedimentation, and to label the sediment layer. Test-tube A is the starting uniform suspension; test-tube B is the same tube after 10 minutes.
Approach
Visualise the start state (uniform suspension in A) and think about what changes when cells sink: a layer of yeast forms at the bottom, the supernatant above becomes clearer, and the upper liquid surface drops very slightly because the cells below the original surface are now packed at the bottom.
Step-by-Step Reasoning
- Upper liquid level: Draw a horizontal line across test-tube B at the same level as the liquid surface in test-tube A (or marginally lower, because the sediment occupies space at the bottom). This marks the new top of the supernatant.
- Sediment layer: Draw a horizontal line a short distance above the closed bottom of test-tube B. Shade or hatch the region between this line and the bottom of the tube to represent the accumulated yeast cells.
- Label: Draw a straight label line (no arrowhead) from the shaded region to the word sediment.
Key Takeaways
- Predicting observations is part of practical planning; connect theory (cells sink because they are denser) with what is visually observed.
- Annotated biological drawings require clear lines, no arrowheads on labels, and unambiguous layer identification.
Common Mistakes
- Drawing the sediment layer too thick (implies unrealistically rapid sedimentation in 10 minutes).
- Forgetting to label the sediment or drawing an arrow instead of a label line.
- Drawing the upper liquid surface higher than in A (it cannot rise when cells sink).
Things to Be Careful About
- Use a label line (a straight line with no arrowhead) rather than an arrow when labelling.
- The lines representing the liquid surface and the top of the sediment layer must be straight and horizontal.
- The shaded sediment region should be at the bottom of the tube, not in the middle.
Describe how you will use the graph paper scale to measure the sediment.
You may draw on test-tube B to help you with your answer.
Answer
Hold the graph paper scale vertically against the side of test-tube B, with the of the scale level with the bottom of the sediment. Count the number of small squares covered by the sediment layer; each small square on a standard graph paper scale represents , giving the height of the sediment in mm.
Hold the scale against the tube and count the small squares from the bottom of the sediment to its top.
Background Concept
Graph paper has a regular array of small squares, each typically on a side. By holding the scale against a vertical column of liquid or solid, the height can be read off by counting squares.
Understanding the Question
The candidate must describe how to use the graph paper scale provided to obtain the height of the sediment in mm.
Approach
Align the zero of the scale with the bottom of the sediment, then count the small squares covered by the sediment.
Step-by-Step Reasoning
- Hold the graph paper scale vertically against the outside of the test-tube, with the zero of the scale at the bottom of the sediment layer.
- Count the small squares covered by the sediment layer.
- Convert the count to mm (each small square ).
Key Takeaways
- A graph paper scale is a simple ruler; the key skill is reading it accurately while keeping the test-tube upright and undisturbed.
Common Mistakes
- Starting the count from the top of the liquid instead of from the bottom of the sediment.
- Saying 'use a ruler' without specifying that the scale is held against the tube and that squares are counted.
Things to Be Careful About
- The scale must be held vertically against the tube; tilting gives an inaccurate reading.
- The 0 of the scale must align with the bottom of the sediment, not the bottom of the tube.
- Do not disturb the contents of the tube while measuring.
Decide how often you will take these measurements, including measuring the sediment at 10 minutes.
State the times you will use for measuring the sediment.
Answer
Take measurements at , , , , and minutes — six readings at regular intervals across the period (start, end and four in between).
0, 2, 4, 6, 8 and 10 minutes.
Background Concept
To track a process such as sedimentation, the candidate needs enough time points to see the trend without disturbing the sample too frequently. Regular intervals make the data easier to plot and interpret.
Understanding the Question
The candidate must state the times at which they will measure the sediment height, including the endpoint.
Approach
Divide the period into equal intervals; the mark scheme requires at least four regular intervals.
Step-by-Step Reasoning
With a total period, five regular intervals give readings at , , , , and . This satisfies the 'at least four regular intervals' requirement and includes both the start () and the end ().
Key Takeaways
- Practical measurements should be spaced so the trend can be seen clearly without disturbing the sample too often.
Common Mistakes
- Choosing irregular intervals (e.g. , , , ) — these make the data harder to plot and analyse.
- Omitting the or minute measurement.
- Choosing too few or too many intervals — very short intervals (e.g. every ) become impractical when measuring five tubes at each time point.
Things to Be Careful About
- The intervals should be practical given that five tubes must each be read at every time point.
There are molecules on the surface of yeast cells which cause the yeast cells to stick together.
The more cells that stick together, the faster the rate of sedimentation. This process may be affected by the pH of the yeast cell suspension.
You will need to:
- investigate the effect of the independent variable, pH, on the sedimentation of a yeast cell suspension
- use the results to estimate the pH of buffer BU.
You are provided with the materials shown in Table 1.1.
Table 1.1
| labelled | contents | hazard | volume / |
|---|---|---|---|
| Y | yeast cell suspension | none | 50 |
| B3 | buffer pH3 | none | 25 |
| B4 | buffer pH4 | none | 25 |
| B5 | buffer pH5 | none | 25 |
| B6 | buffer pH6 | none | 25 |
| BU | buffer (pH unknown) | none | 25 |
| C | calcium chloride solution | irritant | 25 |
If any of C comes into contact with your skin, wash off immediately under cold water.
It is recommended that you wear suitable eye protection.
Read step 1 to step 9 before proceeding.
- Put of B3 into a test-tube.
- Put of C into the same test-tube.
- Stir Y in the beaker, then put of Y into the same test-tube.
- Repeat step 1 to step 3 for B4, B5, B6 and BU.
- Put a bung into one of the test-tubes and invert the test-tube three times to mix the contents.
- Repeat step 5 for all the other test-tubes.
- Immediately start timing.
- At your selected times, as stated in (a)(iii), measure the sediment in each test-tube, as you described in (a)(ii). Do not disturb the contents of the test-tubes.
- Record your results for B3, B4, B5 and B6 in (a)(iv) and record the results for BU in (a)(v).
Record your results for B3, B4, B5 and B6 in an appropriate table.
Answer
A suitable table (values are representative — the candidate records their own measurements):
| pH | height of sediment / mm | |||||
|---|---|---|---|---|---|---|
| time / minutes | ||||||
Conventions used:
- 'pH' as the row heading (left column).
- 'height of sediment / mm' as the column data heading with 'time / minutes' as the sub-heading.
- All values as whole numbers (each = number of squares on the graph paper scale).
- pH 4 shows the greatest sediment height (with pH 3 close behind); pH 6 the smallest — matching the expected pattern.
Table of height of sediment / mm against time / minutes for pH 3, 4, 5 and 6, with pH 4 (or 3) showing the greatest height.
Background Concept
In Paper 3, a results table earns marks for correct conventions: clear headings, units in accepted form, consistent decimal places, and the expected pattern in the data. The candidate's own measurements are accepted within a sensible range provided the trend is correct.
Understanding the Question
The candidate must record, in a suitable table, the height of sediment measured (using the method described in (a)(ii)) for each of the four known-pH tubes (B3, B4, B5, B6) at each chosen time interval (from (a)(iii)).
Approach
Lay out the table with the independent variable (pH) on one axis and time on the other; include the units in the heading; record heights in mm as whole numbers; ensure the trend matches the expected pattern (pH 3 or 4 gives greatest sedimentation).
Step-by-Step Reasoning
- Headings: Use 'pH' as a heading on the left for the rows. Use 'height of sediment / mm' as the data heading at the top of the columns, with 'time / minutes' as a sub-heading giving each time point.
- Recording: Enter the measured heights for each pH at each time. All entries are in mm and are whole numbers (because the candidate counts whole squares on a graph-paper scale).
- Pattern: Sedimentation is fastest around pH 3 or 4 (the optimum for the surface molecules that cause cells to aggregate) and slowest at pH 6.
- Decimal places: Be consistent — all entries whole numbers with no trailing zeros or decimals.
Key Takeaways
- Tables in Paper 3 must obey conventions: quantity + unit in the heading, independent variable as the row (or column) heading, processed data with consistent precision.
- The pattern in the data should match the expected biological response.
Common Mistakes
- Forgetting to include the unit (/ mm) in the heading.
- Recording heights as decimals (e.g. mm) when whole squares are being counted.
- Reversing rows and columns so that pH is across the top — both layouts are accepted, but the heading convention (pH as row label, height of sediment / mm as column heading) is the cleaner one.
- Failing to start the table at mm at time (the sediment cannot have height before the cells have started to settle).
Things to Be Careful About
- The values entered are the candidate's own measurements — they will not match this example exactly, but should follow the same general pattern (pH 4 highest, then pH 3, pH 5, pH 6 lowest).
- The marks are awarded for the conventions and the correct pattern, not for a specific numerical value.
Complete Table 1.2 by recording your results for BU.
Table 1.2
| time / minutes | 10 | |
|---|---|---|
| height of sediment / mm |
Use your results in (a)(iv) and (a)(v) at 10 minutes to estimate the pH for BU.
estimated pH of BU = ______
Answer
Table 1.2 completed (representative values):
| time / minutes | ||||||
|---|---|---|---|---|---|---|
| height of sediment / mm |
At the height of sediment for BU is . Compared with the values from (a)(iv) (pH , pH , pH , pH ), lies between pH and pH , closer to pH .
Estimated pH of BU = – (e.g. )
pH ≈ 4–5 (representative example).
Background Concept
To estimate an unknown pH from a sedimentation curve, the height of sediment at a fixed time (here ) is compared against the heights obtained at known pH values. The unknown pH is read by interpolation between the two known values it falls between.
Understanding the Question
The candidate records the height of sediment for the unknown-pH tube BU at each time interval, then uses the value (compared with the corresponding values for B3–B6 from (a)(iv)) to estimate the pH of BU.
Approach
- Record the height of sediment for BU at each time interval.
- Compare the value for BU with the values for pH 3, 4, 5 and 6 at .
- Estimate by interpolation.
Step-by-Step Reasoning
- The candidate's own measurements for BU are entered in Table 1.2 at each time interval.
- The value for BU is compared with the values from (a)(iv): e.g. pH 3 , pH 4 , pH 5 , pH 6 . A representative BU value of falls between pH 4 and pH 5, closer to pH 5, so the estimate is around pH .
- The estimate depends on the candidate's data; what matters is that the estimate is consistent with the candidate's measurements.
Key Takeaways
- An unknown value can be estimated by interpolation against a calibration curve of known values.
- The reliability of the estimate depends on how close the unknown value is to a known point — gaps in the calibration reduce accuracy.
Common Mistakes
- Recording only the value (the mark scheme requires heights at each time interval).
- Estimating the pH without reference to the (a)(iv) data.
- Stating the pH to an unrealistic precision (e.g. pH ) when the calibration points are far apart.
Things to Be Careful About
- The estimate must be consistent with the candidate's own measurements.
- A whole-number pH (e.g. pH 5) is acceptable if the data clearly points to that value.
Suggest how to modify this procedure to obtain a more accurate estimate of the pH for BU.
Answer
- Use additional buffer solutions at pH values between those already provided (e.g. pH , , ) so that the calibration set is denser — this gives at least five pH values across the range, narrowing the gap between adjacent known points.
- Compare the height of sediment for BU directly with the closest known pH on either side, so the estimate is by narrow interpolation between adjacent calibration points rather than across a wide gap.
Use more pH values (at least 5) and compare the BU result directly with the closest known pH.
Background Concept
The accuracy of an interpolation depends on the spacing of the calibration points. If the unknown lies between two widely-spaced known values, the estimate is coarse; adding intermediate known values narrows the interval and refines the estimate.
Understanding the Question
The candidate must suggest how to modify the procedure to obtain a more accurate estimate of the pH of buffer BU.
Approach
Identify what limits the accuracy of the current estimate (large spacing between pH 4, 5 and 6) and propose changes that tighten the calibration around the unknown.
Step-by-Step Reasoning
- The provided buffers are pH 3, 4, 5, 6 — four points spaced pH unit apart. The unknown BU's sediment height is compared against these, but the gap between consecutive pH values may be too large for a precise estimate.
- Improvement 1: prepare (or be provided with) additional buffers at intermediate pH values (e.g. pH 3.5, 4.5, 5.5). This increases the number of calibration points to at least five and reduces the spacing.
- Improvement 2: compare the BU result directly with the known pH on either side (the two bracketing values) so the estimate is by interpolation between adjacent calibration points, not across a wide gap.
Key Takeaways
- More calibration points → finer resolution → more accurate estimate of an unknown value.
- Improvements should be matched to the specific limitation identified.
Common Mistakes
- Suggesting vague improvements such as 'be more careful' (not specific to the design and not credited).
- Suggesting more repeats at the same pH values (this improves reliability, not the accuracy of the pH estimate).
Things to Be Careful About
- The improvement must address the accuracy of the pH estimate specifically, not just the precision of individual readings.
Suggest an explanation for the effect of pH on the sedimentation of yeast cells.
Answer
At the pH where the greatest sedimentation occurred, the molecules on the surface of the yeast cells caused the cells to be more attracted towards each other (or to aggregate more strongly). The cells therefore stuck together into larger clumps, which sank faster, giving a greater height of sediment at each time point.
At the optimum pH, surface molecules cause cells to stick together into larger clumps that sediment faster.
Background Concept
Sedimentation rate depends on the effective size of the sinking particles. Individual yeast cells sink slowly, but aggregates of many cells sink much faster because their mass increases faster than the cross-sectional area exposed to drag. Anything that promotes cell–cell adhesion therefore accelerates sedimentation.
Understanding the Question
The question gives the context (molecules on the cell surface cause cells to stick together; more sticking → faster sedimentation; pH may affect this). The candidate must suggest a biological explanation for the observed effect of pH on sedimentation.
Approach
Connect the observation (pH affects sedimentation) to the mechanism (cell-surface molecules cause sticking; sticking is pH-dependent).
Step-by-Step Reasoning
- At the pH where sedimentation was fastest, the surface molecules on yeast cells were most effective at promoting cell–cell adhesion.
- Cells stuck together into larger aggregates that sank more rapidly, giving a greater height of sediment at each time point.
- At other pH values (e.g. pH 6) the molecules were less effective at causing adhesion, so cells remained more dispersed and sedimented more slowly.
Key Takeaways
- The rate of sedimentation reflects the effective size of the sinking particles, not just the density of individual cells.
- pH can affect surface chemistry and therefore adhesion between cells.
Common Mistakes
- Saying 'cells are denser at low pH' (incorrect — the density of individual cells does not change meaningfully with pH).
- Saying 'cells are more active at low pH' (irrelevant to sedimentation).
Things to Be Careful About
- The explanation must link pH → surface molecules → cell–cell adhesion → faster sinking, not just assert that pH changes the rate.
Identify one significant source of error in this investigation.
Explain why this is a source of error.
source of error ______
explanation ______
Answer
Source of error: The boundary between the sediment and the supernatant above it is not a sharp line; it is a gradient, so it is difficult to judge exactly where the sediment ends.
Explanation: This makes the measurement of the height of the sediment subjective and uncertain — different observers, or the same observer at different times, will record slightly different values, reducing the reliability of the results.
Difficulty of determining the boundary of the sediment — the meniscus is not sharp, so the reading is uncertain.
Background Concept
Many practical measurements are limited by the resolution of the human eye in judging a boundary, an end-point or a colour change. In sedimentation, the cells form a layer that is denser at the bottom and progressively less dense towards the top, so the upper edge of the sediment is a gradient rather than a sharp line.
Understanding the Question
The candidate must identify one significant source of error in the investigation and explain why it is a source of error.
Approach
Think about which step in the procedure introduces the largest uncertainty. The key measurement is the height of the sediment, and that depends on judging where the sediment ends.
Step-by-Step Reasoning
- The most uncertain measurement is the height of the sediment, because the boundary between the sediment and the supernatant above is not sharp.
- Different observers (or the same observer at different times) will judge the boundary slightly differently.
- This uncertainty affects every reading, so it is a significant source of error.
Key Takeaways
- A 'source of error' is something that introduces variability or bias into the measurement.
- For this investigation, the boundary judgement is the dominant source of uncertainty.
Common Mistakes
- Naming generic 'human error' without specifying what is being misjudged (vague and not credited).
- Suggesting that the volume of buffer or yeast is uncertain (these are measured by syringe / pipette and are precise enough).
- Naming the timing as a source of error (timing to the nearest minute is adequate for the scale of the experiment).
Things to Be Careful About
- The source of error must be specific to this investigation and must affect the results significantly.
- The explanation must say why the source affects the result (not just name it).
At the end of beer making, the yeast is no longer needed and is separated from the beer by sedimentation.
The progress of sedimentation can be monitored by removing samples of beer at intervals over a period of 30 hours and counting the number of yeast cells remaining in the beer, as shown in Table 1.3.
Table 1.3
| time / hours | number of yeast cells / arbitrary units |
|---|---|
| 0 | 1180 |
| 10 | 720 |
| 20 | 250 |
| 25 | 190 |
| 30 | 180 |
Plot a graph of the data shown in Table 1.3 on the grid in Fig. 1.2.
Use a sharp pencil for drawing graphs.
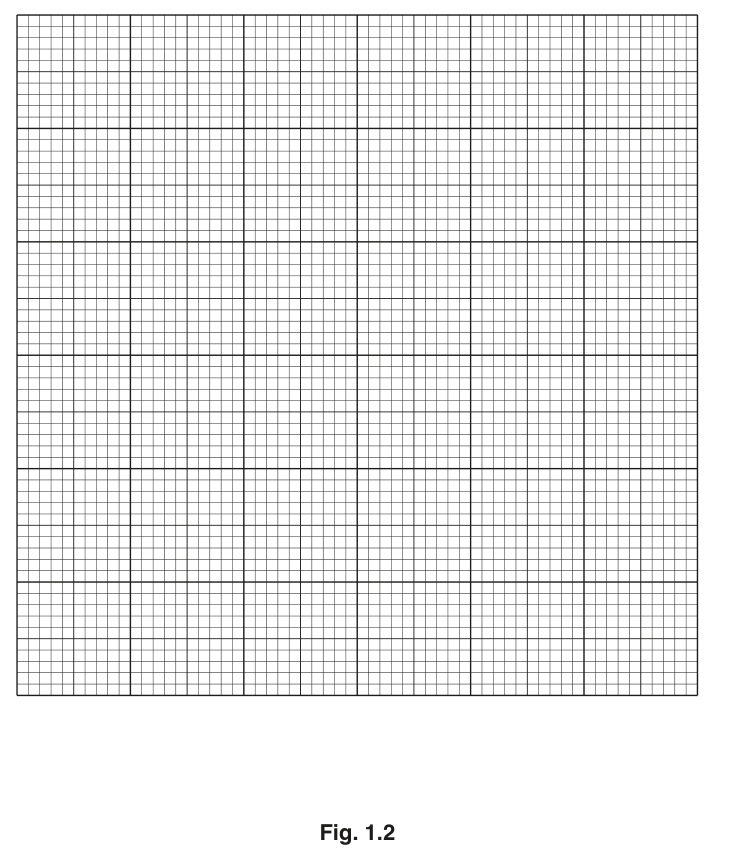
Fig. 1.2
Answer
Plot the data on the grid in Fig. 1.2:
- -axis: labelled time / hours, scale to (gridlines at , , , , , , ).
- -axis: labelled number of yeast cells / arbitrary units , scale to (gridlines at , , , , , , ).
- Five points plotted as small crosses (×) or dots in circles (⊙): , , , , .
- Connect the points with thin straight lines (point-to-point), not a smooth curve.
Line graph with five points connected by straight lines.
Background Concept
A line graph in Paper 3 must have: a clear context (here implied by the axes), correctly labelled axes with units, a scale that uses at least half the grid in both directions and is not awkward (e.g. avoid to or to ), accurately plotted points, and an appropriate line (point-to-point for serial data, smooth curve only when the underlying trend is continuous).
Understanding the Question
The candidate must plot the data from Table 1.3 on the grid provided in Fig. 1.2. The data show the number of yeast cells remaining in beer over hours — a serial dataset where consecutive time points are joined.
Approach
Identify the independent variable (time) for the -axis and the dependent variable (number of yeast cells) for the -axis. Choose a scale that uses most of the grid and is easy to read. Plot each point as a small cross or dot-in-circle. Join the points point-to-point with a thin line.
Step-by-Step Reasoning
- Axes: time on , number of yeast cells on ; both axes labelled with quantity and unit.
- Scales: -axis from to , major gridlines every hours (so to ); -axis from to , major gridlines every (so to ). Both use more than half the grid.
- Plotting: place a small cross or dot-in-circle at each of the five points, to within half a small square.
- Line: join the points with straight thin lines, point-to-point (not a smooth curve), because the data are serial measurements at discrete times.
Key Takeaways
- Choose easy scales (multiples of , , or on the time axis; , or on the number axis).
- Use at least half the grid in both directions.
- Join serial data point-to-point; reserve smooth curves for continuous relationships.
Common Mistakes
- Choosing an awkward scale (e.g. to ) that makes plotting difficult.
- Drawing a smooth curve rather than point-to-point lines.
- Plotting the points as large filled blobs (obscure the actual position).
- Using the wrong axis (e.g. number of cells on , time on ).
Things to Be Careful About
- The mark scheme requires the line to be thin (a sharp pencil and a ruler for straight segments).
- Each point must be plotted to within half a small square; check against the grid.
Use your graph to find the number of yeast cells at 18 hours.
Show on the graph how you determined your answer.
number of yeast cells = ______
Answer
Draw a vertical construction line from on the -axis up to the curve; then draw a horizontal construction line from that point on the curve across to the -axis and read off the value.
With a point-to-point line between and , at hours the line is at:
Number of yeast cells at hours .
≈ 340 arbitrary units cm⁻³ (read from candidate's graph).
Background Concept
Reading an intermediate value from a line graph involves drawing a vertical construction line from the -axis up to the curve, then a horizontal line across to the -axis to read off the value. The mark scheme requires the construction lines to be visible on the graph.
Understanding the Question
The candidate must read off the number of yeast cells at hours from the graph just plotted, and show on the graph how the value was obtained.
Approach
Locate on the -axis, draw a vertical line up to the curve, then a horizontal line across to the -axis, and read off the value.
Step-by-Step Reasoning
- On the -axis, find (between the and gridlines, closer to ).
- Draw a vertical construction line straight up to where the plotted line passes at that time.
- From that intersection, draw a horizontal construction line to the -axis and read off the value.
- With a point-to-point line between and , the linear interpolation at gives:
So the answer is approximately .
Key Takeaways
- Always show construction lines (vertical from -axis to the curve, then horizontal to -axis) so the examiner can see the method.
- The exact value depends on the candidate's drawn line; the marks are for the correct method and a value consistent with the line.
Common Mistakes
- Forgetting to draw the construction lines on the graph (the mark scheme requires this).
- Reading off the value from the -axis at a wrong position.
- Extrapolating the curve rather than interpolating between plotted points.
Things to Be Careful About
- The two construction lines should be drawn lightly with a sharp pencil, ideally with a ruler, so they are clearly visible but do not obscure the curve.
- The value should be quoted with the unit .
The rest of this paper
1 more questions- Q2Use of the Light Microscope · Presentation of Data and Observations19M