Biology 9700/35 — May/June 2018
Cambridge AS Level · Advanced Practical Skills · worked solutions for every part, with the mark scheme
Topics Analysis, Conclusions and Evaluation · Manipulation, Measurement and Observation · Presentation of Data and Observations · Use of the Light Microscope
The enzyme E catalyses the hydrolysis (breakdown) of sucrose to fructose and glucose.
You are required to investigate the effect of substrate concentration on this enzyme-catalysed reaction.
The products of the hydrolysis of sucrose will change the colour of potassium manganate(VII) solution, P, from purple to colourless.
You have been provided with test-tube Z which shows the colourless end-point.
You will need to:
- prepare a serial dilution of sucrose solution
- investigate the action of E on the different concentrations of sucrose solution
- record the time taken to reach the end-point for each concentration of sucrose solution.
You are provided with the materials shown in Table 1.1.
Table 1.1
| labelled | contents | hazard | volume/ |
|---|---|---|---|
| S | 10% sucrose solution | none | 20 |
| W | distilled water | none | 50 |
| A | sulfuric acid | irritant | 20 |
| E | 1% enzyme solution | irritant | 20 |
| P | 0.01% potassium manganate(VII) solution | low risk irritant | 20 |
It is recommended that you wear suitable eye protection.
If A, E or P come into contact with your skin, wash off immediately under cold water.
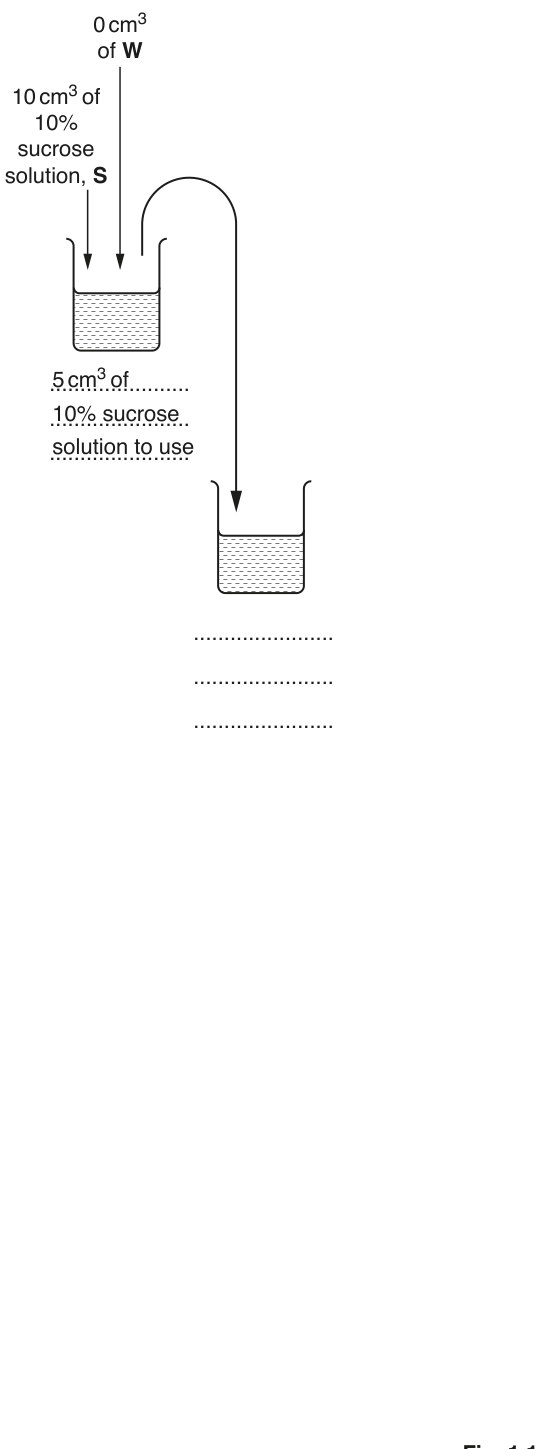
You will need to make a serial dilution of the 10% sucrose solution, S, which reduces the concentration by half between each successive dilution.
You will need to prepare of each concentration of sucrose solution.
Fig. 1.1 shows the first two beakers you will use to make your serial dilution.
Complete Fig. 1.1 by drawing as many extra beakers as you need for your serial dilution.
For each beaker:
- state, under the beaker, the volume and concentration of the sucrose solution available for use in the investigation
- use one arrow, with a label above the beaker, to show the volume and concentration of the sucrose solution added to prepare the concentration of sucrose solution in the beaker
- use another arrow, with a label above the beaker, to show the volume of W added to prepare the concentration of sucrose solution in the beaker.
The first beaker in Fig. 1.1 has been labelled for you.
Read step 1 to step 12 before proceeding.
- Prepare the concentrations of sucrose solution, as shown in Fig. 1.1.
- Label as many test-tubes as you require for all the sucrose solutions prepared in step 1.
- Put of 10% sucrose solution into the labelled test-tube.
- Repeat step 3 with each of the other concentrations.
- Using the beakers labelled hot water and cold water, set up a water-bath with water between and .
You will not need to maintain this temperature during steps 8 to 10.
The reaction will start when E is added in step 6.
- Put of E into each test-tube, using the syringe labelled E. Shake gently to mix.
- Put all of the test-tubes into the water-bath and start timing.
- Leave the test-tubes in the water-bath for 8 minutes.
During the 8 minutes continue with Question 1.
- At 8 minutes remove the test-tubes from the water-bath and immediately put of A into each of the test-tubes. Shake gently to mix.
- Put of P into each of the test-tubes and start timing. Shake gently to mix.
- Record in (a)(ii) the time in minutes and seconds (raw results) for each test-tube to reach the end-point, as shown by the contents of test-tube Z. Do not stop the timer.
If the end-point has not been reached after 10 minutes, stop timing and record as 'more than 10'.
- When all the times have been recorded, record the time taken to reach the end-point in seconds (processed results) in (a)(ii).
Record your results in an appropriate table, including:
- raw results
- processed results.
Using your results in (a)(ii), calculate the rate of enzyme activity in 10% sucrose solution.
State your answer in standard form.
Show all the steps in your working and use appropriate units.
rate of enzyme activity = ______
This procedure investigated the effect of substrate concentration on the activity of an enzyme. To modify this procedure to investigate a different variable, the substrate concentration should be kept the same.
Describe how you would standardise the substrate concentration.
Think about how you could modify this procedure to investigate the effect of pH on the rate of enzyme activity.
State the pH values you would select and describe how you would change the pH.
pH values ______
description ______
A scientist carried out a similar experiment to investigate the effect of substrate concentration on the activity of an enzyme in the presence of an inhibitor.
The concentration of the enzyme and the concentration of the inhibitor were standardised. The rate of enzyme activity was calculated at different concentrations of substrate. All other variables were kept constant.
The results are shown in Table 1.2.
Table 1.2
| percentage substrate concentration | rate of enzyme activity / arbitrary units (au) |
|---|---|
| 0.0 | 0.0 |
| 2.0 | 1.9 |
| 6.0 | 5.6 |
| 9.0 | 8.5 |
| 11.0 | 9.4 |
| 12.0 | 9.4 |
Plot a graph of the data in Table 1.2 on the grid in Fig. 1.2.
Use a sharp pencil for drawing graphs.

Explain the effect that increasing the substrate concentration from 2.0% to 6.0% has on the rate of enzyme activity.
The scientist repeated the experiment but without an inhibitor. was reached at 4.5% substrate concentration and was the same in both experiments.
State the type of inhibitor present.
The rest of this paper
1 more questions- Q2Use of the Light Microscope · Analysis, Conclusions and Evaluation19M