Biology 9700/34 — May/June 2018
Cambridge AS Level · Advanced Practical Skills · worked solutions for every part, with the mark scheme
Topics Manipulation, Measurement and Observation · Presentation of Data and Observations · Analysis, Conclusions and Evaluation · Use of the Light Microscope
Yeast cells contain enzymes which catalyse the breakdown of glucose to produce ethanol and carbon dioxide. When dissolved, the carbon dioxide forms a weak acid.
The activity of the yeast cells is determined by measuring the change in pH using Universal Indicator paper.
As the yeast continues to break down the glucose, the concentration of ethanol becomes toxic and the yeast cells are killed.
You will need to investigate the effect of different concentrations of ethanol on the activity of yeast cells.
You are provided with the materials shown in Table 1.1.
Table 1.1
| labelled | contents | hazard | volume/ |
|---|---|---|---|
| E | 15% ethanol | flammable harmful | 50 |
| W | distilled water | none | 100 |
| U | unknown concentration of ethanol | flammable harmful | 20 |
| Y | beaker and 6 test-tubes, with 1 g of dried yeast in each tube | none | – |
| G | glucose solution | none | 100 |
| P | Universal Indicator paper with pH colour chart | none | 3 lengths |
It is recommended that you wear suitable eye protection.
Ethanol is harmful and highly flammable. If any comes into contact with your skin, wash off immediately under cold water.
Keep the ethanol covered when you are not using it.
A student found that, at concentrations of ethanol greater than 15%, there was no activity of the yeast cells.
The student suggested the hypothesis:
Concentrations of ethanol below 15% will continue to cause the death of yeast cells.
You will need to investigate this hypothesis by measuring the activity of the yeast cells using different concentrations of ethanol.
You will need to make a serial dilution of 15% ethanol, E, which reduces the concentration by half between each successive dilution.
You will need to prepare of each concentration of ethanol.
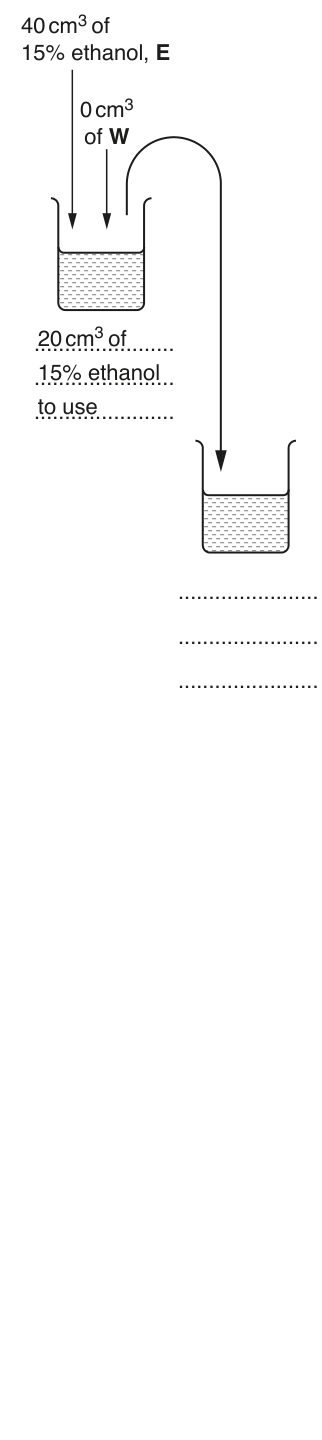
Fig. 1.1 shows the first two beakers you will use to make your serial dilution.
Complete Fig. 1.1 by drawing as many extra beakers as you need for your serial dilution.
For each beaker:
- state, under the beaker, the volume and concentration of ethanol available for use in the investigation
- use one arrow, with a label above the beaker, to show the volume and concentration of ethanol added to prepare the concentration of ethanol in the beaker
- use another arrow, with a label above the beaker, to show the volume of W added to prepare the concentration of ethanol in the beaker.
The first beaker in Fig. 1.1 has been labelled for you.
Answer
Add four more beakers to the right of the second (dotted-line) beaker. Each new beaker has two arrows pointing into it and a label below.
- Beaker 2 (already started): arrow from beaker 1 labelled '20 cm³ of 15% ethanol', arrow labelled '20 cm³ of W', and below the beaker write '20 cm³ of 7.5% ethanol to use'.
- Beaker 3: arrow labelled '20 cm³ of 7.5% ethanol', arrow labelled '20 cm³ of W', below: '20 cm³ of 3.75% ethanol to use'.
- Beaker 4: arrow labelled '20 cm³ of 3.75% ethanol', arrow labelled '20 cm³ of W', below: '20 cm³ of 1.875% ethanol to use'.
- Beaker 5: arrow labelled '20 cm³ of 1.875% ethanol', arrow labelled '20 cm³ of W', below: '20 cm³ of 0.9375% ethanol to use'.
The five concentrations to use in the investigation are 15%, 7.5%, 3.75%, 1.875% and 0.9375%.
Four additional beakers for 7.5%, 3.75%, 1.875% and 0.9375%, each made by adding 20 cm³ of the previous concentration to 20 cm³ of W; 20 cm³ of each new concentration is available to use.
Background Concept
A serial dilution is a stepwise dilution in which the concentration is reduced by a fixed factor at every step. Here the factor is one-half, so each successive beaker is half the concentration of the previous one. The technique is used because (i) only a small volume of stock is needed to make a whole range of concentrations, (ii) the dilutions are made accurately using simple volumes, and (iii) the concentrations are evenly spread, which makes the results easy to interpret.
The mathematics is the dilution equation
where and are the concentration and volume of the solution being transferred, and and are the concentration and volume after adding the diluent (water, W).
Understanding the Question
You are told to make a serial dilution of 15% ethanol that halves between each step, with of each concentration available for the test-tubes. Fig. 1.1 has already drawn beaker 1 (40 cm³ of 15% ethanol) and the start of beaker 2; you complete the figure by adding the remaining beakers and labelling every volume and concentration. The mark scheme awards 1 mark for the four extra concentrations, 1 mark for showing 20 cm³ transferred between beakers and 1 mark for showing 20 cm³ of W added to each new beaker.
Approach
The cleanest method is to repeat the same pattern for every new beaker: 20 cm³ is transferred in from the previous beaker, 20 cm³ of W is added, the contents are mixed, and 20 cm³ is then carried forward to the next beaker. The other 20 cm³ remains in the beaker as the '20 cm³ of [concentration] to use'. Repeating this four more times after the existing 15% beaker gives the five working concentrations.
Step-by-Step Reasoning
- Beaker 1 (already shown) holds 40 cm³ of 15% ethanol. 20 cm³ is taken into beaker 2; 20 cm³ of 15% ethanol remains to use.
- Beaker 2: 20 cm³ of 15% from beaker 1 + 20 cm³ of W → 40 cm³ of 7.5% (concentration halves). 20 cm³ goes into beaker 3; 20 cm³ of 7.5% remains to use.
- Beaker 3: 20 cm³ of 7.5% from beaker 2 + 20 cm³ of W → 40 cm³ of 3.75%. 20 cm³ goes into beaker 4; 20 cm³ of 3.75% remains to use.
- Beaker 4: 20 cm³ of 3.75% from beaker 3 + 20 cm³ of W → 40 cm³ of 1.875%. 20 cm³ goes into beaker 5; 20 cm³ of 1.875% remains to use.
- Beaker 5: 20 cm³ of 1.875% from beaker 4 + 20 cm³ of W → 40 cm³ of 0.9375%. The dilution ends here; 20 cm³ of 0.9375% remains to use.
Key Takeaways
- Every new beaker is made by adding 20 cm³ of the previous concentration to 20 cm³ of water W.
- The dilution factor (½) means concentrations are 15 → 7.5 → 3.75 → 1.875 → 0.9375 %.
- Always state both the volume available to use (20 cm³) and the concentration below each beaker.
Common Mistakes
- Forgetting to halve at every step (e.g. writing 10% instead of 7.5%).
- Transferring 10 cm³ instead of 20 cm³ between beakers, which gives the wrong final volume to use.
- Omitting the % sign on the concentration labels.
- Forgetting the '20 cm³ of [concentration] to use' label below each new beaker.
Things to Be Careful About
- The CIE mark scheme requires concentrations in the same form as the question (e.g. 7.5 not 7.50; 0.9375 not ~0.94).
- The 20 cm³ transferred from the previous beaker must be clearly shown by an arrow with a label stating both volume and concentration.
- Do not write '½' or 'half' in place of a number; give the actual numerical concentration.
Read step 1 to step 16 before proceeding.
- Prepare the concentrations of ethanol as shown in Fig. 1.1.
Use a glass rod to mix the ethanol and water. - Label the test-tubes from beaker Y with the concentrations of ethanol prepared in step 1 and label one test-tube as U.
- Using the beakers labelled hot water and cold water set up a water-bath with water between and .
- Put of G into each of the labelled test-tubes, including U.
- Use a glass rod to mix the contents.
- Put the test-tubes into the water-bath (set up in step 3) for 5 minutes.
- Cut the Universal Indicator paper, P, into approximately lengths. You will need 2 pieces for each of the ethanol concentrations prepared in step 1 and 2 pieces for U.
- After 5 minutes (step 6) put of 15% ethanol into the test-tube labelled 15%. Shake gently to mix then return it to the water-bath.
- Repeat step 8 with the other concentrations of ethanol made in step 1 and with U.
- Start timing.
- Put pieces of P onto the white tile.
You will need to sample the mixtures in each of the test-tubes at 3 minutes and at 9 minutes.
- At 3 minutes, use the glass rod to remove a drop from the test-tube containing 15% ethanol and touch one piece of P with the end of the glass rod.
- Observe the colour of P and record the colour in (a)(ii).
- Compare the colour with the pH colour chart and record the pH in (a)(ii).
Note: if there are several colours on the paper (e.g. dark green and light green) record the pH as a range (e.g. pH 8–pH 7). - Wipe the end of the glass rod with a paper towel to clean it and repeat step 12 to step 15 with the other mixtures, including U.
- Repeat step 12 to step 15 at 9 minutes.
Record your results in an appropriate table, including:
- colour
- pH.
Answer
| percentage concentration of ethanol (%) | colour at 3 min | pH at 3 min | colour at 9 min | pH at 9 min |
|---|---|---|---|---|
| 15.0 | blue | 8 | green-blue | 7 |
| 7.5 | green | 7 | green | 6 |
| 3.75 | yellow-green | 6 | yellow | 5 |
| 1.875 | yellow | 5 | orange | 4 |
| 0.9375 | yellow-orange | 4 | orange | 3 |
(Values shown are representative — the candidate records their own observations, with pH as whole numbers or as a range if the indicator paper shows more than one colour.)
Representative table; pH ≈ 8 at 15% (3 min), falling to ≈ 3 at 0.9375% (9 min), with the greatest fall at the lowest concentrations.
Background Concept
Universal Indicator paper changes colour across the pH range 1–14, giving a quick but approximate estimate of pH. Each colour band on the supplied chart corresponds to a whole-number pH. When yeast is actively fermenting glucose it releases CO₂, which dissolves to form a weak carbonic acid; this lowers the pH. The lower the pH after a fixed time, the more active (alive) the yeast has been.
Understanding the Question
The candidate samples each of the five ethanol concentrations (and U) twice — at 3 min and at 9 min — by touching Universal Indicator paper to a drop of the mixture on a glass rod, and records both the colour and the matching pH in a single results table.
Approach
Plan the table before recording:
- Row headings (down the left): the five concentrations of ethanol plus U.
- Column headings (across the top): one column for concentration, then paired colour and pH columns for 3 min and 9 min.
- Use the pH colour chart to convert each colour to a whole number, or to a range (e.g. pH 8–7) if more than one colour is on the paper.
Step-by-Step Reasoning
- Decide on the table layout — a clear, grid-like table with no ambiguity about which column is which.
- Make the headings unambiguous, e.g. percentage concentration of ethanol (%), colour at 3 min, pH at 3 min, colour at 9 min, pH at 9 min.
- Sample each tube in the same order at 3 min, matching each colour to the chart and recording it.
- Repeat the sampling at 9 min and record the new colour and pH.
- At 15% ethanol, the yeast is heavily inhibited; pH stays relatively high (around 7–8). At lower concentrations the pH falls more, reaching around 3–4 at 0.9375% by 9 min — the expected trend.
Key Takeaways
- A good results table has a heading for every column with the appropriate unit and a clear separation of the independent variable (concentration) from the readings.
- Whole numbers are the appropriate precision for Universal Indicator paper.
- If a colour falls between two bands, record a range (e.g. pH 8–7), as instructed by the question.
Common Mistakes
- Missing a heading or omitting the unit on the concentration column.
- Using decimals for pH (e.g. 7.5) when the indicator only resolves whole pH units.
- Failing to record the 9 min reading, or recording only one row of data.
- Recording colours but forgetting to convert them to pH values.
Things to Be Careful About
- The column for percentage concentration of ethanol must have a unit, e.g. (%).
- The colour and pH sub-headings should sit cleanly under the 3 min and 9 min headings.
- Whole-number pH values are required; the only exception is the allowed range (e.g. pH 8–7) when the paper shows two colours.
State the colour and pH for U at 9 minutes.
colour = ______
pH = ______
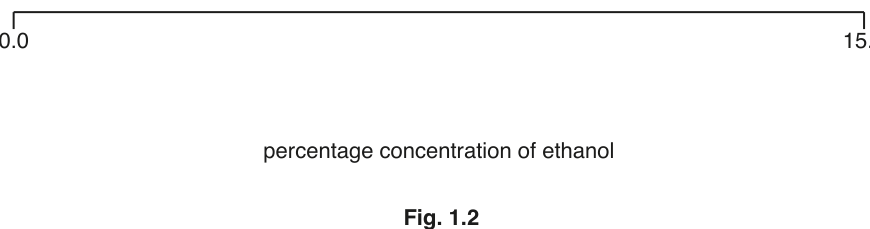
Complete Fig. 1.2 to show:
- the percentage concentrations of ethanol prepared in step 1
- the estimated percentage concentration of ethanol in U, using the letter U.
Answer
colour = (the candidate's recorded colour for U at 9 min — e.g. yellow)
pH = (the pH matching that colour — e.g. 5)
On Fig. 1.2, place the letter U on the scale at the concentration whose 9-min pH matches the 9-min pH of U. For example, if U has pH 5 at 9 min and the 3.75% concentration also has pH 5 at 9 min, mark U at 3.75 on the scale (a representative example).
U marked on Fig. 1.2 at the concentration whose 9-min pH matches that of U (representative: U ≈ 3.75% if U's pH = 5 at 9 min).
Background Concept
An unknown concentration can be estimated by comparing its behaviour with the behaviour of a series of known standards. Here the five prepared ethanol concentrations act as the standards, and the unknown U is matched to the standard whose 9-min pH (or colour) it most closely matches. This is the same logic used in colorimetric assays and in calibration curves.
Understanding the Question
You have already recorded the colour and pH for each of the five known concentrations and for U at 9 minutes in (a)(ii). You now place the letter U on the linear scale in Fig. 1.2 at the position of the concentration whose 9-min pH matches U's 9-min pH.
Approach
Read down the 9 min column of the results table to find the known concentration whose pH is the same as U's pH at 9 min. If U's pH falls between two of the standards, the estimate lies between the two concentrations.
Step-by-Step Reasoning
- Read U's pH at 9 min from (a)(ii) — for example, pH 5.
- In the 9-min pH column of the table, find the concentration with the same pH 5 — for example, 3.75%.
- Mark the letter U on Fig. 1.2 at the 3.75% position on the scale.
- If U's pH falls between two known concentrations (e.g. between pH 5 at 3.75% and pH 4 at 1.875%), interpolate — place U at a point on the scale between 3.75% and 1.875%.
Key Takeaways
- A calibration-style estimate uses the 9-min reading, when differences between concentrations are largest.
- The answer is a single letter U on the scale, not a separate statement.
Common Mistakes
- Using the 3-min pH (which is less differentiated between concentrations) instead of the 9-min pH.
- Marking U at the wrong end of the scale, or omitting the letter entirely.
Things to Be Careful About
- Place the letter U clearly on the line, not in the gap below it.
- The estimate should match the candidate's own recorded pH for U; there is no universal 'correct' concentration.
The student's hypothesis stated that:
Concentrations of ethanol below 15% will continue to cause the death of yeast cells.
State whether you support or you reject this hypothesis.
Explain how your results provide evidence for this decision.
support or reject = ______
explanation = ______
Answer
support or reject = reject (if your data show a continuing fall in pH below 15%)
explanation = Between 3 and 9 minutes the pH continued to fall (the mixture became more acidic) at ethanol concentrations below 15%, showing that the yeast cells were still respiring anaerobically and releasing CO₂. If lower concentrations were continuing to kill the yeast, the pH would have stayed the same or fallen less. The greatest fall in pH occurs at the lowest concentrations, so the data do not support the hypothesis. (If your data show little or no further fall in pH below 15%, the alternative decision is to support the hypothesis, with the explanation that the yeast cells had been killed and were no longer respiring.)
Reject (typical outcome); pH continued to fall between 3 and 9 min at ethanol concentrations below 15%, showing the yeast was still active.
Background Concept
A hypothesis is a testable prediction. To test it, you compare the prediction with the experimental data:
- If the data are consistent with the prediction, you support the hypothesis.
- If the data are inconsistent with the prediction, you reject the hypothesis.
In this experiment the hypothesis is that concentrations of ethanol below 15% will continue to kill the yeast. Active (alive) yeast ferments glucose, releasing CO₂ that lowers the pH. A larger fall in pH between 3 and 9 min means the yeast is still active; no fall (or only a small fall) means the yeast has been killed.
Understanding the Question
You must decide whether your own data support or reject the hypothesis, and explain your decision by referring to specific observations from the results table.
Approach
Compare the pH at 3 min with the pH at 9 min for the four concentrations below 15%:
- If the pH continued to fall noticeably, the yeast is still respiring → reject the hypothesis (the cells are not all being killed).
- If the pH barely changed, the yeast has stopped respiring → support the hypothesis.
Step-by-Step Reasoning
- Look at the 7.5%, 3.75%, 1.875% and 0.9375% rows in your table.
- In each case the 9-min pH is lower than the 3-min pH (e.g. pH 5 → 4 at 1.875%, pH 4 → 3 at 0.9375%).
- A lower pH means more CO₂ has been produced, which means the yeast is still respiring — the cells are not being killed by these lower concentrations.
- Therefore reject the hypothesis. The greatest fall in pH is at the lowest concentration, showing that the lower the ethanol concentration, the more active the yeast remains.
Key Takeaways
- Always state the decision (support or reject) and give a reason that references the data.
- The direction of pH change (down) tells you the direction of yeast activity (up) — they are inversely related because CO₂ is acidic.
Common Mistakes
- Stating 'support' or 'reject' without giving any data — the second mark is for referencing the data.
- Confusing the pH trend: a fall in pH means more activity, not less.
- Saying 'the yeast died' at low concentrations when the data show the pH continuing to fall.
Things to Be Careful About
- Use the candidate's own recorded values (e.g. 'pH fell from 6 to 5 at 3.75%') rather than generic statements.
- The hypothesis refers to concentrations below 15%, so the evidence must come from those four rows, not the 15% row itself.
- The mark scheme accepts either decision provided it is consistent with the candidate's own data — reject is the expected outcome if the experiment behaves normally.
Identify one significant source of error in this investigation.
Answer
The colour produced on the Universal Indicator paper is judged subjectively, and matching it to a specific pH on the colour chart is difficult; different observers could record different pH values for the same colour, especially when the paper shows more than one shade.
Difficulty in judging the colour of the Universal Indicator paper and matching it to a pH value.
Background Concept
A source of error is a specific, identifiable limitation in the method that affects the accuracy or precision of the results. Vague statements like 'human error' or 'not accurate' do not score; the answer must name the quantity affected and the reason it is unreliable.
In this experiment the dependent variable (pH) is estimated visually by comparing the colour on Universal Indicator paper with a colour chart.
Understanding the Question
You must name one significant source of error in the procedure described.
Approach
Think about which step involves a subjective judgement and which measured quantity that judgement affects. The obvious candidate is reading the colour of the Universal Indicator paper and converting it to a pH value.
Step-by-Step Reasoning
- The colour on the paper is interpreted by eye, and the matching pH value is read off a printed chart.
- Different people may record slightly different colours (or different pH values) for the same paper.
- The same person may also record different values at different times if their eye is fatigued or the lighting changes.
- This introduces error into the pH values in the results table and therefore into the conclusion drawn from them.
Key Takeaways
- State what is uncertain and why it is uncertain.
- Be specific — name the quantity affected and the reason.
Common Mistakes
- Vague answers such as 'human error', 'not accurate enough' or 'mistakes were made' — these do not score.
- Naming a problem with no link to the result (e.g. 'the ethanol is flammable' is a safety issue, not a source of error in the pH measurement).
- Naming an issue that does not actually apply (e.g. the temperature is standardised by the water-bath, so 'temperature variation' is not the main source of error here).
Things to Be Careful About
- The mark scheme accepts: difficulty in judgement of colour and matching to pH.
- Equivalent wording is acceptable; the key idea is that the colour → pH step is subjective.
A student investigated the activity of a yeast cell suspension and glucose by measuring the release of carbon dioxide given off over a period of 11 minutes.
The carbon dioxide was measured by recording the volume of gas collected in a graduated test-tube.
The temperature was kept constant at . All other variables were standardised.
The results are shown in Table 1.2.
Table 1.2
| time / minutes | volume of / arbitrary units (au) |
|---|---|
| 0 | 0.18 |
| 3 | 0.23 |
| 6 | 0.38 |
| 8 | 0.55 |
| 11 | 0.84 |
Plot a graph of the data in Table 1.2 on the grid in Fig. 1.3.
Use a sharp pencil for drawing graphs.

Answer
- Label the x-axis 'time / minutes' and the y-axis 'volume of CO₂ / arbitrary units (au)'.
- Use a scale of 2 minutes = 2 cm on the x-axis (so the x-axis runs from 0 to 12 minutes).
- Use a scale of 0.2 au = 2 cm on the y-axis (so the y-axis runs from 0.0 to 1.0 au).
- Plot the five points as small crosses or dots in circles: (0, 0.18), (3, 0.23), (6, 0.38), (8, 0.55), (11, 0.84).
- Join the points with sharp straight lines, point to point (not a smooth curve).
Line graph of volume of CO₂ (au) against time (min); points (0, 0.18), (3, 0.23), (6, 0.38), (8, 0.55), (11, 0.84) joined point to point with sharp straight lines.
Background Concept
A line graph is the right choice when both the independent variable (time) and the dependent variable (volume of CO₂) are continuous numerical variables and the experiment has measured values at specific times. The graph lets us see the trend and read off intermediate values, e.g. for a rate calculation.
Conventions for an A-level biology graph:
- Both axes labelled with the quantity and its unit.
- Scales that use at least half the grid and are easy to read (e.g. 1, 2, 5, 10 per large square, not 3, 7, 13).
- Points plotted accurately with a small cross or a dot in a circle.
- A line of best fit (sharp straight lines for individual measurements, smooth curve only for a continuous trace).
Understanding the Question
The data in Table 1.2 are five paired values of time and volume of CO₂. They must be plotted on the printed grid in Fig. 1.3.
Approach
Choose convenient scales that use the full grid:
- x-axis: 2 minutes = 2 cm (large square) — runs 0 → 12 minutes.
- y-axis: 0.2 au = 2 cm — runs 0.0 → 1.0 au.
Then plot each pair as a small cross or dot in a circle, and join point to point.
Step-by-Step Reasoning
- x-axis: 0 min at the origin, 2 min at 2 cm, 4 min at 4 cm, …, 12 min at 12 cm.
- y-axis: 0.0 au at the origin, 0.2 au at 2 cm, 0.4 au at 4 cm, …, 1.0 au at 10 cm.
- Plot the points:
- (0, 0.18) → 0 cm, 1.8 cm
- (3, 0.23) → 3 cm, 2.3 cm
- (6, 0.38) → 6 cm, 3.8 cm
- (8, 0.55) → 8 cm, 5.5 cm
- (11, 0.84) → 11 cm, 8.4 cm
- Join the points with sharp straight lines using a ruler; do not draw a smooth curve because the data are individual measurements, not a continuous trace.
Key Takeaways
- The line is point to point (straight ruled lines), not a smooth curve — these are experimental data points, not a theoretical trace.
- Scales must be labelled at every 2 cm (every large square).
- The independent variable goes on the x-axis; the dependent variable on the y-axis.
Common Mistakes
- Plotting a smooth curve through the points (rejected — mark scheme requires point-to-point lines).
- Using awkward scales (e.g. 3 minutes = 2 cm), or scales that do not use at least half the grid.
- Omitting the unit on an axis label (e.g. just 'time' instead of 'time / minutes').
- Using a bar chart — incorrect because the independent variable is continuous, not categorical.
Things to Be Careful About
- The mark scheme says 'sharp and joined point to point' — use a sharp pencil and a ruler.
- Each plotted point should be a small cross or dot in a circle, not a large blob.
- Label the scales every 2 cm (i.e. at 2, 4, 6, 8, 10 cm on each axis).
Use your graph to calculate the rate of carbon dioxide given off between 7 minutes and 10 minutes.
Show all the steps in your working and use appropriate units.
rate = ______
Working
Read the volume of CO₂ from the graph at 7 minutes and at 10 minutes.
At 7 min: (interpolated between (6, 0.38) and (8, 0.55))
At 10 min: (interpolated between (8, 0.55) and (11, 0.84))
The rate of CO₂ release between 7 and 10 minutes:
Answer
rate = 0.09 au min⁻¹ (representative value; the candidate's own graph reading will give a similar value, e.g. 0.09–0.10 au min⁻¹)
≈ 0.09 au min⁻¹
Background Concept
A rate is the change in a quantity per unit time. On a graph of volume against time, the rate between two time points is the gradient of the line between them:
The data in Table 1.2 are only recorded at five times, but a straight line drawn through them allows values to be read off at any intermediate time.
Understanding the Question
You are asked to use the graph to find the rate of CO₂ release between 7 and 10 minutes. The table does not contain values at 7 or 10 minutes, so the values must be read from the graph (or interpolated between adjacent data points).
Approach
- Read the volume at 7 min from the graph.
- Read the volume at 10 min from the graph.
- Subtract to find the change in volume; divide by the time interval (3 min).
Step-by-Step Reasoning
- At 7 min: this is halfway between 6 min (0.38 au) and 8 min (0.55 au) on the line, so .
- At 10 min: this is two-thirds of the way between 8 min (0.55 au) and 11 min (0.84 au), so .
- Change in volume: .
- Time interval: .
- Rate: .
Key Takeaways
- Read values from the graph (or interpolate) when the question asks for a value between recorded data points.
- Always include the unit in the final answer ().
- The mark scheme awards 1 mark for the two correct graph readings and 1 mark for the division by 3.
Common Mistakes
- Using the data points (0.38 at 6 min, 0.55 at 8 min) instead of the values at 7 and 10 min.
- Forgetting to divide by 3 (the time interval) — common when the calculation is just a subtraction.
- Omitting the unit, or writing it incorrectly (e.g. 'au/min' without the space, or 'min⁻¹' as '1/min').
Things to Be Careful About
- The mark scheme accepts the candidate's own graph reading, so any answer in the range 0.08–0.10 au min⁻¹ is reasonable.
- Quote the rate to 2 significant figures (e.g. 0.090) — Universal Indicator-style precision is not required, but the answer should reflect the graph's resolution.
- Use the equation format rate = Δy/Δx, not the other way round.
The student investigated the release of carbon dioxide from a yeast cell suspension using the apparatus shown in Fig. 1.4.
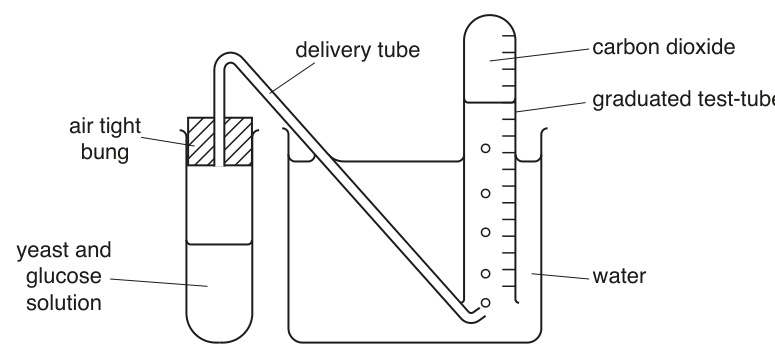
Describe how you would modify this investigation to determine the effect of temperature on the release of carbon dioxide from a yeast cell suspension.
Answer
- Place the yeast-and-glucose test-tube in a thermostatically controlled water-bath so the temperature can be set and held constant at each chosen value (e.g. 15, 20, 25, 30, 35 °C).
- Repeat the investigation at at least 5 different temperatures spanning a biologically relevant range for yeast activity.
- Keep the mass (or volume) of yeast and the concentration of glucose the same in every test-tube, and keep all other variables (e.g. total volume, time of measurement) the same as in the original investigation.
Use a thermostatically controlled water-bath; test at least 5 temperatures; keep the mass/volume of yeast and the glucose concentration the same in every tube.
Background Concept
To investigate the effect of an independent variable on a dependent variable, all other variables must be standardised (kept constant). The independent variable is the one we deliberately change; the dependent variable is the one we measure; controlled variables are everything else that could affect the result.
- Independent variable: temperature.
- Dependent variable: volume of CO₂ released (or rate of release).
- Controlled variables: mass/volume of yeast, concentration of glucose, time of measurement, total volume of solution, apparatus used.
Understanding the Question
The original investigation collected CO₂ from a yeast-and-glucose mixture at 25 °C. To test the effect of temperature, the same procedure must be repeated at several different temperatures while keeping every other variable the same.
Approach
- Vary the temperature using a device that holds the temperature constant at each chosen value (a thermostatically controlled water-bath is the standard answer).
- Choose a sensible range of temperatures, with at least 5 values so a trend can be seen.
- Identify and control the variables that could otherwise vary from one test to the next.
Step-by-Step Reasoning
- Independent variable — temperature. The temperature of the yeast-and-glucose mixture must be set and held constant. A thermostatically controlled water-bath does this most reliably; a beaker of water heated on a tripod is too variable.
- Range — at least 5 temperatures, e.g. 15, 20, 25, 30, 35 °C, spanning the range in which yeast is active.
- Control of variables:
- Same mass (or volume) of yeast in every test-tube.
- Same concentration and volume of glucose solution in every test-tube.
- Same total volume of mixture.
- Same delivery tube, same graduated test-tube, same time of measurement.
Key Takeaways
- The independent variable is changed systematically; the dependent variable is measured; everything else is held constant.
- A thermostatically controlled water-bath is the standard way to control temperature in a biology practical.
- 'At least 5 temperatures' is the minimum to identify a trend; 5 is acceptable, more is better.
Common Mistakes
- Vague 'control the temperature' with no mention of a thermostat — loses the 'thermostatically controlled' wording.
- Only 2 or 3 temperatures — too few to show a trend.
- Forgetting to control the yeast/glucose — if these vary, the temperature effect is confounded.
- Saying 'repeat at different temperatures' without specifying the number, the range, or the apparatus.
Things to Be Careful About
- The mark scheme awards 1 mark for the thermostatically controlled water-bath, 1 mark for at least 5 temperatures, and 1 mark for either 'same mass/volume of yeast' or 'same concentration of glucose'. Both are good practice; one is enough for the mark.
- A water-bath at 25 °C is a single condition; to study the effect of temperature you must change the temperature.
The rest of this paper
1 more questions- Q2Use of the Light Microscope19M