Biology 9700/32 — May/June 2018
Cambridge AS Level · Advanced Practical Skills · worked solutions for every part, with the mark scheme
Topics Presentation of Data and Observations · Manipulation, Measurement and Observation · Analysis, Conclusions and Evaluation
Before you proceed, read carefully through the whole of Question 1 and Question 2.
Plan the use of the two hours to make sure that you finish all the work that you would like to do.
If you have enough time, think about how you can improve the confidence in your results, for example by obtaining and recording one or more additional measurements.
You will gain marks for recording your results according to the instructions.
You are required to investigate the effect of concentration of hydrochloric acid (independent variable) on the rate of diffusion.
The investigation involves placing agar cubes containing an indicator into dilute hydrochloric acid. As the acid diffuses into the agar cubes the indicator changes colour.
You are provided with the materials shown in Table 1.1.
Table 1.1
| labelled | contents | hazard | volume/ |
|---|---|---|---|
| H | hydrochloric acid | irritant | 100 |
| A | agar | none | — |
| W | distilled water | none | 60 |
It is recommended that you wear suitable eye protection.
If H comes into contact with your skin, wash it off immediately under cold water.
You must not touch the agar with your hands. Use the blunt forceps and paper towel to handle the agar.
You will need to carry out a trial test (step 1 to step 4) before you start your investigation.
Read step 1 to step 4 before proceeding.
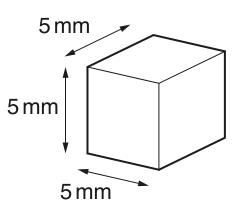
- Cut 3 cubes from the agar, A, as shown in Fig. 1.1. Each cube should be approximately but they must all have the same dimensions. Cut the cubes from A on the white tile provided.
-
Put of hydrochloric acid, H, into a beaker.
-
Put the 3 cubes you cut in step 1 into the beaker containing H, using blunt forceps. Start timing.
As the acid diffuses into the agar cubes they change colour. The end-point is reached when the blue-green colour disappears and the whole cube has changed colour from blue-green to pink.
Putting the beaker on the white card provided may help you to see the colour changes more clearly.
- Measure the time taken for each cube to reach the end-point and record the times in (a)(i). If any cube remains blue-green after 3 minutes record as 'more than 180'.
Record your results in an appropriate table.
Calculate the mean time taken for the cubes to reach the end-point.
mean time = ______
A student carried out this trial experiment and recorded three results which were not consistent.
Identify one error in this trial procedure that could have caused repeated results to be inconsistent.
The student investigated the effect of concentration of hydrochloric acid on the rate of diffusion and suggested the hypothesis:
Lowering the concentration of hydrochloric acid below will have no effect on the rate of diffusion of acid into the agar cubes.
You will need to investigate this hypothesis by:
- diluting H to provide four further concentrations of hydrochloric acid
- putting agar cubes into each of these concentrations of hydrochloric acid
- measuring the rate at which the hydrochloric acid diffuses into the agar cubes.
State two variables that you will need to standardise during your investigation.
1 ______
2 ______
You will need to use simple (proportional) dilution of the hydrochloric acid, H, to prepare four further concentrations of hydrochloric acid.
You need to prepare of each concentration.
Complete Table 1.2 to show how you will prepare these concentrations.
Table 1.2
| volume of hydrochloric acid / | volume of distilled water, W / | final concentration of hydrochloric acid / |
|---|---|---|
| 10 | 0 | 1.0 |
| 0.8 | ||
| 0.6 | ||
| 0.4 | ||
| 0.2 |
Read step 5 to step 10 before proceeding.
-
Prepare the concentrations of hydrochloric acid, as shown in Table 1.2, in the beakers provided.
-
Cut three cubes, each approximately , from A. Cut the cubes on the white tile provided.
-
Put the 3 cubes into the beaker containing hydrochloric acid, H, and immediately start timing. Do not stir.
-
Measure the time taken for each cube to reach the end-point and record the times in (a)(vi). If any cube remains blue-green after 3 minutes record as 'more than 180'.
-
Repeat step 6 to step 8 for each of the other concentrations of hydrochloric acid you have prepared.
-
Calculate the mean time taken for each concentration and record the mean times in (a)(vi).
Record your results and mean times in an appropriate table.
Using your mean times, calculate the rate of diffusion when the concentration of hydrochloric acid is and in the lowest concentration of hydrochloric acid you have investigated.
rate in hydrochloric acid = ______
rate in the lowest concentration = ______
The student's hypothesis stated that:
Lowering the concentration of hydrochloric acid below will have no effect on the rate of diffusion of acid into the agar cubes.
State whether you support or reject this hypothesis. Explain how your results provide evidence for this decision.
support or reject ______
explanation ______
This procedure investigated the effect of the concentration of hydrochloric acid on the rate of diffusion.
To modify this procedure for investigating a different variable, the concentration of hydrochloric acid would need to be standardised.
Suggest the concentration of hydrochloric acid that should be used. Give a reason for your answer.
concentration ______
reason ______
Think about how you could modify this procedure to investigate the effect of surface area to volume ratio on the rate of diffusion.
Describe the modifications needed to investigate the effect of surface area to volume ratio.
A scientist carried out an experiment to investigate whether a chemical, C, extracted from the flowers of a plant, was able to inhibit the reproduction of pathogenic bacteria.
The scientist prepared 5 Petri dishes containing agar (agar plates) which had each been inoculated with a different type of pathogenic bacterium.
A filter paper disc, soaked in chemical C, was put onto each agar plate. Chemical C diffused from the filter paper disc into the agar. The agar plates were incubated at to allow the bacteria in the agar to reproduce.
A clear zone, called a zone of inhibition, is observed around the filter paper disc if the chemical is effective at preventing bacteria from reproducing, as shown in Fig. 1.2.
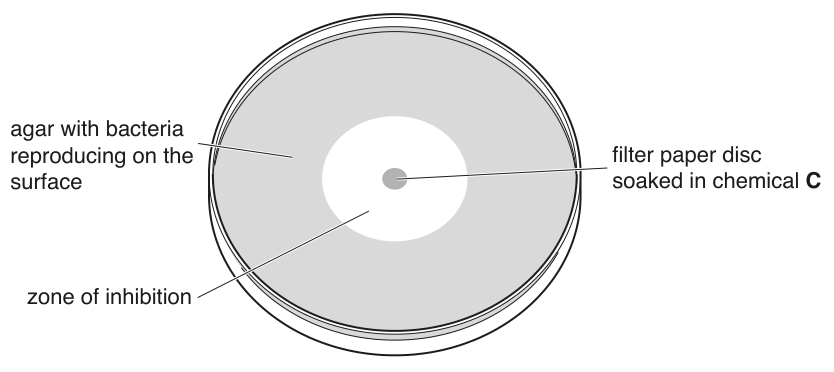
The scientist measured the diameter of the zone of inhibition produced in the agar for each of the 5 different types of pathogenic bacterium.
The results are shown in Table 1.3.
Table 1.3
| type of pathogenic bacterium | diameter of zone of inhibition / mm |
|---|---|
| P | 7.0 |
| Q | 24.0 |
| R | 18.0 |
| S | 15.5 |
| T | 19.0 |
Draw a bar chart of the data in Table 1.3 on the grid in Fig. 1.3. Each bar should be separated for each type of pathogenic bacterium.
Use a sharp pencil for drawing bar charts.

A scientist studied the results in Table 1.3 and noticed that one type was most affected by chemical C.
The scientist decided to carry out further experiments to learn more about the effects of chemical C on this type of bacterium.
State which type of bacterium in Table 1.3 the scientist should use for further experiments. Give a reason for your answer.
type of bacterium ______
reason ______
The rest of this paper
1 more questions- Q2—18M