Biology 9700/31 — May/June 2018
Cambridge AS Level · Advanced Practical Skills · worked solutions for every part, with the mark scheme
Topics Manipulation, Measurement and Observation · Presentation of Data and Observations · Analysis, Conclusions and Evaluation · Use of the Light Microscope
Milk contains proteins which are used to make cheese.
During cheese making, bacteria are added to the milk. The bacteria change the pH of the milk to acidic, causing the proteins to coagulate (clot) forming curds. The curds are then used to make the cheese.

Estimating the protein concentration in milk is important when making cheese.
You will need to:
- make simple (proportional) dilutions of the proteins in the milk, M
- carry out the biuret test on each concentration, to provide a measure of the concentration of proteins present in the milk
- carry out the biuret test on milk with an unknown concentration of protein, U
- estimate the concentration of milk protein in U.
You are provided with the materials shown in Table 1.1.
Table 1.1
| labelled | contents | hazard | volume / |
|---|---|---|---|
| M | 1.0% milk | none | 40 |
| U | milk with an unknown concentration of protein | none | 20 |
| K | 5% potassium hydroxide solution | harmful irritant | 20 |
| C | 0.15% copper sulfate solution | none | 20 |
| W | distilled water | none | 100 |
It is recommended that you wear suitable eye protection.
If K comes into contact with your skin, wash it off immediately under cold water.
You are required to make simple (proportional) dilutions of the proteins in the milk, M (1.0%).
Reduce the concentration by 0.2% between each successive dilution.
You will also make a 0.1% concentration.
You will need to prepare of each concentration.
Table 1.2 shows how to make up two of the concentrations you will use, 1.0% and 0.1%.
Decide which other concentrations of milk to prepare using simple (proportional) dilutions of M.
Complete Table 1.2 to show how you will prepare the other concentrations.
Table 1.2
| volume of M / | volume of distilled water, W / | percentage concentration of milk |
|---|---|---|
| 10.0 | 0.0 | 1.0 |
| 1.0 | 9.0 | 0.1 |
Answer
| volume of M / cm³ | volume of distilled water, W / cm³ | percentage concentration of milk |
|---|---|---|
| 10.0 | 0.0 | 1.0 |
| 8.0 | 2.0 | 0.8 |
| 6.0 | 4.0 | 0.6 |
| 4.0 | 6.0 | 0.4 |
| 2.0 | 8.0 | 0.2 |
| 1.0 | 9.0 | 0.1 |
0.8% (8.0 cm³ M + 2.0 cm³ W), 0.6% (6.0 cm³ M + 4.0 cm³ W), 0.4% (4.0 cm³ M + 6.0 cm³ W), 0.2% (2.0 cm³ M + 8.0 cm³ W); each made up to a total volume of 10 cm³.
Background Concept
A simple (proportional) dilution reduces the concentration of a stock solution by mixing a measured volume of the stock with a calculated volume of diluent (here distilled water, W). The total volume of the diluted sample equals the volume of stock used plus the volume of diluent. Because the same quantity of solute (milk protein) is now dissolved in a larger total volume, the concentration is reduced in proportion to the dilution factor.
For example, taking 2 cm³ of a 1.0% solution and making it up to 10 cm³ with water gives a 1:5 dilution, so the new concentration is . Taking 4 cm³ and making it up to 10 cm³ gives 0.4%, and so on. The rule is .
The biuret test is the colorimetric test being calibrated by these dilutions. In strongly alkaline solution (provided by K, potassium hydroxide), Cu²⁺ ions from C (copper sulfate) form a violet coordination complex with the nitrogen atoms of peptide bonds. The more peptide bonds present (i.e. the higher the protein concentration), the more intense the violet colour. A negative biuret (no protein) leaves the solution the pale blue of the unreacted CuSO₄.
Understanding the Question
The question requires a series of simple (proportional) dilutions of milk M (1.0%), reducing by 0.2% between each successive dilution, with 10 cm³ of each concentration required. Two rows are already supplied: 1.0% (10.0 cm³ M + 0.0 cm³ W) and 0.1% (1.0 cm³ M + 9.0 cm³ W). The candidate must fill in the four intermediate concentrations: 0.8%, 0.6%, 0.4% and 0.2%.
Each dilution is simple (made directly from the original 1.0% stock M, not a serial transfer from the previous tube) and proportional (the new concentration is a simple fraction of 1.0%).
Approach
Apply the dilution rule for each target concentration, then subtract from 10 cm³ to find the volume of water. Check that each row sums to exactly 10 cm³.
Step-by-Step Reasoning
- For 0.8%: cm³ of M. Water needed: cm³.
- For 0.6%: cm³ of M. Water needed: cm³.
- For 0.4%: cm³ of M. Water needed: cm³.
- For 0.2%: cm³ of M. Water needed: cm³.
- The 0.1% row is already given: 1.0 cm³ of M + 9.0 cm³ of W (a 1:10 dilution of the 1.0% stock — also a simple proportional dilution, not a serial transfer from the 0.2% tube).
In every row, volume of M + volume of W = 10.0 cm³, as required.
Key Takeaways
- In a simple proportional dilution, the new concentration is the volume of stock divided by the total volume, multiplied by the stock concentration.
- Calibration series for colorimetric tests need a regular, evenly spaced set of concentrations spanning the expected range of the unknown.
- The volumes in a dilution table must be self-consistent: stock + diluent = the total volume stated in the question.
Common Mistakes
- Forgetting that the total volume of the diluted sample must be 10 cm³ (so the volumes of M and W in each row must sum correctly).
- Treating the dilutions as a serial series (each tube made from the previous one, e.g. 0.2% made by diluting the 0.4% tube). The question asks for simple dilutions, all prepared directly from the 1.0% stock M.
- Putting the dilutions in the wrong order (e.g. 0.6% above 0.8% in the table) — the table must run monotonically from 1.0% down to 0.1%.
Things to Be Careful About
- The mark scheme awards one mark for the correct set of concentrations (0.8, 0.6, 0.4, 0.2) and one mark for the volumes being correct AND summing to 10 cm³ in every row.
- The 0.1% row is a 1:10 dilution of the 1.0% stock and so is also a simple proportional dilution (not serial). It is given in the question; the candidate is not required to alter it.
- Always check the arithmetic: the volumes of M and W in each row must add to 10.0 cm³.
Read step 1 to step 9 before proceeding.
- Prepare all the concentrations of milk as shown in Table 1.2 in the test-tubes provided.
- Put the bung into one of the test-tubes and invert it to mix well. Repeat with each of the test-tubes.
- Label the spotting tile with the concentrations of milk prepared in step 1.
- Use a pipette to put 2 drops of 1.0% milk into the labelled cavity on the tile.
Any milk remaining in the pipette should be put back into the test-tube so that as little of the milk as possible is removed from the test-tube. You will need this milk for step 13. - Repeat step 4 with each of the concentrations of milk.
- Put 1 or 2 drops of K into each of the concentrations of milk on the tile and mix.
- Put of C into each mixture on the tile, using the syringe labelled C.
- Leave for 2 minutes for the colour to change.
- Compare the colour with the standard colours in Fig. 1.1. Record the colour of the mixture in (a)(ii).

Record your results in an appropriate table for the known concentrations of milk, using only the standard colours shown in Fig. 1.1.
Answer
| percentage concentration of milk (%) | colour (using Fig. 1.1) |
|---|---|
| 1.0 | violet |
| 0.8 | violet |
| 0.6 | pale violet |
| 0.4 | pale violet |
| 0.2 | blue |
| 0.1 | blue |
Higher concentrations (1.0% and 0.8%) → violet; intermediate concentrations (0.6% and 0.4%) → pale violet; low concentrations (0.2% and 0.1%) → blue.
Background Concept
The biuret test is a colorimetric test for proteins. In strongly alkaline solution, Cu²⁺ ions (from copper sulfate, C) form a violet coordination complex with the nitrogen atoms of peptide bonds. The more peptide bonds present (i.e. the higher the protein concentration), the more intense the violet colour. A negative biuret (essentially no protein) leaves the solution the pale blue colour of unreacted Cu²⁺.
The intensity is therefore a continuous gradient from blue (no protein) → pale violet (some protein) → violet (lots of protein). Fig. 1.1 reduces this continuous range to a discrete three-step reference key.
Understanding the Question
After running the biuret test on each of the six dilutions prepared in (a)(i), the candidate must record the colour observed for each one in a results table. The heading must name the quantity and unit of the independent variable (percentage concentration of milk). The colour recorded in each row must be one of the three reference words in Fig. 1.1 — no other descriptions are allowed.
Approach
Set up a results table with two columns: percentage concentration of milk (the independent variable) and colour (the dependent variable, recorded from Fig. 1.1). Compare each well of the spotting tile to the three reference colours in Fig. 1.1 and write the matching colour word in the second column.
Step-by-Step Reasoning
- The 1.0% and 0.8% tubes have the most protein (most peptide bonds available), so the Cu²⁺–peptide complex is fully formed, giving the most intense colour: violet.
- The 0.6% and 0.4% tubes have less protein: the violet complex is diluted by the blue colour of unreacted Cu²⁺, giving pale violet.
- The 0.2% and 0.1% tubes have so little protein that almost no Cu²⁺–peptide complex forms, and the blue colour of the copper sulfate dominates: blue.
- The colour in each row must be one of the three words in Fig. 1.1 (blue, pale violet, violet); do not invent intermediate descriptions like 'purple', 'mauve' or 'lavender'.
Key Takeaways
- Results tables for colorimetric tests need a clear heading that names the quantity AND the unit.
- Use the reference key provided (Fig. 1.1) to assign colours; do not describe the colour in your own words.
- The expected pattern is monotonic: as concentration increases, colour intensity increases (from blue → pale violet → violet).
Common Mistakes
- Forgetting to include the unit (%) in the column heading.
- Using a colour not in the Fig. 1.1 key (e.g. 'purple', 'mauve', 'dark blue') — these are rejected by the mark scheme.
- Reversing the trend (e.g. 1.0% blue and 0.1% violet), which would suggest the biuret test has been performed incorrectly or the colours have been misread against the key.
Things to Be Careful About
- The mark scheme requires only the three colours from Fig. 1.1 (blue, pale violet, violet) — no others are credited.
- The expected pattern must follow the monotonic trend described; one mark is lost for the 'expected pattern' point if the results are inconsistent with the chemistry of the biuret test.
- Write the colour names exactly as in Fig. 1.1 — 'pale violet' is two words, not 'paleviolet' or 'pale-purple'.
You are now required to estimate the concentration of milk in sample U. This provides a measure of the proteins in the milk.
- Put 2 drops of U onto the spotting tile.
- Repeat step 6 to step 9 with U. Record the colour in (a)(iii).
State the colour for sample U.
colour = ______
Answer
colour = violet
violet
Background Concept
Sample U is a milk sample with an unknown protein concentration. The biuret test (Cu²⁺ in alkaline KOH) is performed on U in exactly the same way as for the calibration standards, and the resulting colour is compared to the three reference colours in Fig. 1.1 to obtain a qualitative estimate of its protein concentration.
Understanding the Question
After applying the biuret test to U (steps 10–11 of the procedure), the candidate records the observed colour in the answer space. The colour recorded must be one of the three reference words in Fig. 1.1 (blue, pale violet, violet).
Approach
Place 2 drops of U on the spotting tile, add the same volume of K as used for the standards, add 0.5 cm³ of C from the syringe, leave for 2 minutes, then compare the resulting colour to the three circles in Fig. 1.1. Write the matching colour word in the answer space.
Step-by-Step Reasoning
- The unknown U is expected to give a strong biuret-positive (violet) reaction, because unknown milk samples in this style of question are typically formulated to fall in the upper end of the calibration range (similar to the 1.0% / 0.8% standards).
- With the expected result of violet, the candidate writes 'violet' in the answer space.
- If the candidate actually observes pale violet or blue, they should record that instead — the mark scheme awards the mark for whatever colour they observed, not for a 'correct' textbook value.
Key Takeaways
- A single qualitative observation is recorded as one of the words from the reference key, not paraphrased.
- The candidate's own observation, not the textbook expected value, is what earns the mark.
Common Mistakes
- Writing 'purple' or 'mauve' instead of the reference word 'violet' — these are not in Fig. 1.1 and are not credited.
- Adding extra descriptive words ('light violet', 'dark violet') — only the three exact colour names in the key are accepted.
Things to Be Careful About
- The mark is for the single colour word; do not write a sentence or list multiple options.
- Compare carefully to the key in good, even lighting, since the biuret colours can be subtle and the difference between 'pale violet' and 'blue' in particular is easy to misjudge.
Fig. 1.1 has only three colours. In (a)(ii) more than one of the known concentrations may match U. This means that an estimate of the concentration of milk protein in U may not be accurate.
Using the result in (a)(iii), state the known concentrations of milk protein where the colour result for U is the same.
Answer
U is violet (from (a)(iii)), which matches the colours recorded for the 1.0% and 0.8% concentrations in (a)(ii).
Known concentrations matching U: 1.0% and 0.8%
1.0% and 0.8%
Background Concept
A calibration series (here, six known concentrations of milk) allows an unknown to be estimated by comparing its response (here, biuret colour) to the responses of the standards. If the unknown gives the same response as one of the standards, its concentration is equal to that standard's concentration.
When the reference is a discrete key (only three colour words for six concentrations), several standards can fall into the same colour bin. The unknown can then only be localised to a range, not to a single value. This is a fundamental limitation of using a coarse qualitative reference, and it is the issue the question is leading the candidate to recognise.
Understanding the Question
Given the colours recorded in (a)(ii) for the six known concentrations and the colour of U from (a)(iii), the candidate must state which known concentrations have the same colour as U. This gives the range within which U's protein concentration is estimated to lie.
Approach
Read down the colour column in the (a)(ii) table, and pick out the concentrations whose colour matches the colour of U in (a)(iii).
Step-by-Step Reasoning
- From (a)(ii): 1.0% → violet, 0.8% → violet, 0.6% → pale violet, 0.4% → pale violet, 0.2% → blue, 0.1% → blue.
- From (a)(iii): U → violet.
- The concentrations whose colour matches U (violet) are 1.0% and 0.8%.
- U's protein concentration is therefore estimated to be in the range 0.8%–1.0%, but cannot be pinpointed more accurately because the three-colour key lumps these two standards into the same 'violet' bin.
Key Takeaways
- The accuracy of an estimate from a calibration series is limited by the resolution of the reference key.
- When a discrete key is used, several standards fall in the same 'bin' and the unknown can only be localised to that bin.
- A continuous reference (e.g. a colorimeter reading) would resolve concentrations within the bin.
Common Mistakes
- Listing only one concentration (e.g. just 1.0%) when two match — the question asks for all the matching concentrations.
- Listing concentrations whose colour does not match U (e.g. including 0.6% by mistake).
- Failing to use the candidate's own (a)(ii) result if it differs from the expected pattern — the mark scheme says the answer should be 'according to results in (a)(ii) and (a)(iii)'.
Things to Be Careful About
- If the candidate's (a)(ii) results are anomalous (e.g. an inversion), the matching list should follow their own recorded data, not the expected pattern.
- The 'estimate' of U's concentration is only as good as the resolution of the three-colour key — this limitation is what motivates the improved procedure in part (b), which uses a six-level coagulation key instead of a three-level colour key.
A significant source of error in this procedure is the difficulty of matching the colour to Fig. 1.1.
Complete Table 1.3 to suggest:
- an improvement to this procedure of matching the colour (dependent variable)
- one other significant source of error in this procedure
- an improvement to reduce this error.
Table 1.3
| significant source of error | improvement |
|---|---|
| matching the colour may be inconsistent | |
| another significant source of error ___________________________ |
Answer
| significant source of error | improvement |
|---|---|
| matching the colour may be inconsistent (subjective, depends on observer) | use a colorimeter to measure absorbance quantitatively, OR prepare more colour standards to compare against |
| another significant source of error: drop size of milk or K varies (drops from a pipette are not precise) | use a small syringe or graduated pipette to measure the volume of milk and K accurately |
Colour matching: use a colorimeter or prepare more colour standards. Variable drop size: use a small syringe or graduated pipette to measure volumes.
Background Concept
In any colorimetric comparison, the largest source of error is usually the subjective comparison of colour by eye. Different observers (or the same observer at different times) will match the test colour to slightly different points in the reference key, and the lighting conditions affect the perceived colour. A second common error in spotting-tile work is the use of 'drops' from a Pasteur or dropping pipette, which deliver variable volumes depending on the angle of the pipette, the surface tension of the liquid, and how the pipette is held.
Each error must be paired with a specific improvement that addresses it. The improvement must be practical (something that can actually be done in the lab) and specific (naming the apparatus or procedure).
Understanding the Question
The question has already filled in the first error ('matching the colour may be inconsistent') and left its improvement blank. The candidate must:
- Suggest an improvement to the colour-matching step.
- State one other significant source of error in the procedure.
- Suggest an improvement to that other error.
The mark scheme awards one mark for each of these three elements.
Approach
For (1), the obvious improvement to a colour-comparison step is to replace the eye with an instrument (colorimeter) or to increase the resolution of the reference (more standard colours).
For (2), look at every step in the procedure and ask: where is precision lost? The volume of milk and of K is added as 'drops' from a pipette — drops vary in size. The volume of C is added from a syringe, which is more accurate. The 2-minute wait is fixed, so timing is OK. The spotting tile is white, so background is OK. The biggest remaining uncontrolled factor is the drop size.
For (3), the improvement is to use a measuring device that delivers a known volume, such as a small syringe or a graduated pipette.
Step-by-Step Reasoning
-
Error 1 (already given): matching the colour is subjective, and the reference key only has three colour words, so two different concentrations can give the same colour word.
- Improvement: use a colorimeter to measure the absorbance of the test solution at 540 nm (the wavelength of maximum absorbance of the Cu²⁺–peptide complex). The absorbance is a continuous numerical readout, not a three-word label, so different concentrations can be distinguished. Alternatively, prepare a larger number of standard colours (e.g. 6 or 8) by varying the protein concentration in smaller steps, so each colour bin is narrower.
-
Error 2 (the candidate must supply): the volume of milk and of K added in steps 4–6 is described as '2 drops' or '1 or 2 drops'. Drops from a pipette vary in size, typically 0.02–0.05 cm³, so the actual volume of milk in each well is uncontrolled. The volume of K is similarly variable.
- Improvement: use a small syringe (e.g. 1 cm³) or a graduated pipette to deliver a measured, reproducible volume of milk and of K to each well.
-
The mark scheme requires the errors and improvements to be paired — an error in the left column is only credited if the improvement in the right column actually addresses it.
Key Takeaways
- Sources of error must be specific (naming the exact step or quantity affected), not vague ('human error', 'not accurate enough').
- Improvements must address the named error — do not write a generic 'be more careful'.
- In colorimetric work, the subjectivity of colour matching is the biggest source of error; a colorimeter converts it to a continuous numerical measurement.
- Quantitative volumes (from a syringe or graduated pipette) are more reproducible than 'drops' from a dropping pipette.
Common Mistakes
- Naming a vague error such as 'human error' or 'inaccuracy' — these are too general to be credited.
- Suggesting an improvement that does not address the named error (e.g. suggesting 'use a colorimeter' for the drop-size error).
- Naming the 2-minute wait as an error — this is a fixed protocol step, not a source of error.
- Suggesting 'repeat the experiment' as the improvement for a single error — repeats address random error across the whole experiment, not a specific source.
Things to Be Careful About
- The first row's error is given ('matching the colour may be inconsistent'); the candidate only supplies the improvement for that row.
- The second row's error AND improvement must both be supplied by the candidate.
- The mark scheme accepts 'colorimeter' OR 'more colour standards' for the colour-matching improvement, and 'small syringe' OR 'graduated pipette' (or other valid volume-measuring device) for the drop-volume improvement.
A student suggested that another procedure to estimate the concentration of protein in milk could be to compare how much coagulation was produced in acidic conditions.
The student added acid to known concentrations of milk protein and observed a range of coagulation. The concentration of milk protein in an unknown sample could then be estimated more accurately.
You are provided with hydrochloric acid, labelled A.
It is recommended that you wear suitable eye protection.
If A comes into contact with your skin, wash it off immediately under cold water.
Read step 12 to step 16 before proceeding.
- Put of U into a test-tube.
In step 13, you will be adding A to the milk in the test-tubes, do not stir or mix A with the milk. - Put of A into each of the test-tubes containing the known concentrations of milk protein (from step 4) and U.
- Observe the changes in the milk in all of the test-tubes for up to 1 minute.
- If coagulation is not visible after 1 minute, you may need to carefully tilt each test-tube to move the milk and then observe the coagulation.
- Using the observations from step 14 and step 15 and the key in Fig. 1.2, record the results in (b)(i).
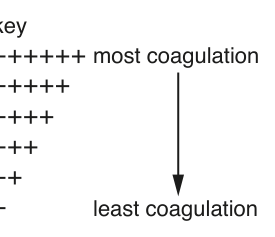
Prepare the space below and record the results for the known concentrations of milk protein using Fig. 1.2.
Answer
| percentage concentration of milk (%) | coagulation (using key in Fig. 1.2) |
|---|---|
| 1.0 | +++++ |
| 0.8 | ++++ |
| 0.6 | +++ |
| 0.4 | ++ |
| 0.2 | + |
| 0.1 | − |
Coagulation increases with concentration: 1.0% +++++, 0.8% ++++, 0.6% +++, 0.4% ++, 0.2% +, 0.1% −.
Background Concept
Milk proteins (mainly caseins) are soluble at the natural pH of milk (~6.6) because the casein micelles are stabilised by their negative surface charge and by κ-casein 'hairs' that protrude from the micelle surface. When the pH is lowered towards the isoelectric point of casein (pH ~4.6), the net charge on the proteins falls towards zero, electrostatic repulsion between micelles is lost, and they aggregate — visibly, the milk coagulates into curds. The lower the pH, and the more protein present, the more extensive the coagulation.
In this experiment, a fixed volume of 1.0 mol dm⁻³ HCl (A) is added to each of six known concentrations of milk protein. The HCl lowers the pH below the isoelectric point of casein and triggers coagulation. The amount of curd formed depends on the amount of protein available: more protein → more curd → more coagulation.
Understanding the Question
Step 14 asks the candidate to observe the changes in each test-tube over 1 minute. The amount of coagulation in each tube is then scored against the key in Fig. 1.2, which runs from − (least coagulation) through +, ++, +++, ++++, to +++++ (most coagulation). The results must be recorded in a table prepared by the candidate, with a heading for the coagulation column and using only the symbols in the Fig. 1.2 key.
Approach
Set up a results table with two columns: percentage concentration of milk (the independent variable) and coagulation (the dependent variable, scored using Fig. 1.2 symbols). For each tube, judge the volume of curd and assign the matching symbol from the key.
Step-by-Step Reasoning
- The 1.0% tube has the most protein: the most extensive coagulation, scored as +++++ (most coagulation).
- The 0.1% tube has the least protein: little or no visible coagulation, scored as − (least coagulation).
- In between, the coagulation follows the concentration monotonically:
- 0.8% → ++++
- 0.6% → +++
- 0.4% → ++
- 0.2% → +
- The heading of the second column should be 'coagulation' (or 'coagulation (using key in Fig. 1.2)'); the symbols must come from the Fig. 1.2 key only (no invented symbols or words like 'lots' or 'none').
Key Takeaways
- Results tables for qualitative observations need a heading AND must use the symbols/words from the provided key.
- The expected pattern is monotonic: as concentration increases, the extent of coagulation increases.
- A discrete key with 6 levels gives finer resolution than the 3-colour biuret key, so the coagulation method can estimate U more precisely — this is the point of the comparison the question is leading the candidate towards, and is mentioned in the question stem.
Common Mistakes
- Using a word instead of a symbol ('lots', 'none') — Fig. 1.2 gives a symbol scale, so symbols are expected.
- Reversing the trend (e.g. 1.0% as − and 0.1% as +++++), which would suggest the procedure was done in the wrong order or the labels were misread.
- Skipping a level (e.g. 1.0% as ++++, 0.8% as ++) — the scale has six levels for six concentrations, so a level per concentration is the expected pattern.
Things to Be Careful About
- The mark scheme requires the heading (1 mark) and the correct pattern using the key symbols (1 mark). Both must be present.
- The key in Fig. 1.2 has six levels (−, +, ++, +++, ++++, +++++); use only these symbols.
Using the key in Fig. 1.2, record the result for U.
Answer
U → ++++ (or +++++)
++++ (or +++++)
Background Concept
Sample U is added to HCl in step 13 and observed for up to 1 minute. The amount of curd formed is then scored against the key in Fig. 1.2. The mark scheme accepts four OR five crosses because the exact amount of curd is a judgment call between adjacent levels of the key.
Understanding the Question
The candidate must record, for U, the symbol from the Fig. 1.2 key that best describes the amount of coagulation they observe. The result is then used in (b)(iii) to plot U on the concentration scale.
Approach
Look at the U tube after the 1-minute wait, compare the amount of curd to the standards (or to the descriptions in the key), and write the matching symbol.
Step-by-Step Reasoning
- U is expected to give a high level of coagulation (++++ or +++++), consistent with it being similar in protein concentration to 1.0% / 0.8% milk (as also indicated by the violet biuret result in (a)(iii)).
- Either ++++ or +++++ is accepted; the choice depends on the candidate's judgment of how the U tube compares to the 0.8% and 1.0% standards.
- The result is then used in (b)(iii) to place U on the concentration scale at the appropriate position.
Key Takeaways
- Single qualitative observations are recorded using the symbol from the provided key, not paraphrased.
- The mark scheme allows a margin of one level either side of the 'true' value for a judgment-based scale, so both ++++ and +++++ are accepted.
Common Mistakes
- Writing a word instead of the symbol (e.g. 'lots of coagulation' instead of '+++++').
- Recording a symbol that is not in the key (e.g. '++++++' — only six levels exist).
- Recording fewer than four crosses (which would suggest U had a much lower protein concentration than 1.0% milk, inconsistent with the (a)(iii) violet observation).
Things to Be Careful About
- The mark is for the symbol alone, not for an explanation; the candidate should not write '++++ (similar to 1.0%)' — just the symbol.
Complete Fig. 1.3 to show the position on the line of each of the percentage concentrations of milk decided in Table 1.2.
Put the label U on Fig. 1.3 to show an estimate of the concentration of milk which provides a measure of the proteins in U, using the result in (b)(ii).

Answer
A horizontal scale bar (0.0% at the left, 1.0% at the right) is completed with tick marks at 0.0, 0.2, 0.4, 0.6, 0.8 and 1.0%. The label 'U' is placed above the scale at the position corresponding to its observed coagulation: for ++++ or +++++ (as in (b)(ii)), U is placed at approximately 0.8% (between 0.6% and 1.0%, closer to 0.8%).
Tick marks at 0.0, 0.2, 0.4, 0.6, 0.8 and 1.0% on the scale; U placed at the position matching the (b)(ii) coagulation result (≈ 0.8% for ++++ or +++++).
Background Concept
A linear scale bar is a way of representing a continuous variable (here, percentage concentration of milk protein) on a line of fixed length. The position of a point on the line is proportional to the value it represents. Once a calibration scale has been constructed (here, by marking the known concentrations from Table 1.2 at their correct positions), an unknown value can be estimated by finding the position on the line that matches its observed response.
Understanding the Question
The candidate must:
- Mark the six percentage concentrations from Table 1.2 (0.0, 0.2, 0.4, 0.6, 0.8, 1.0) on the scale bar in Fig. 1.3.
- Mark the position of U on the same scale, using the result of (b)(ii) to choose where U belongs.
The scale bar in Fig. 1.3 is already drawn from 0.0% to 1.0% but has no intermediate tick marks; the candidate must add them.
Approach
Divide the scale bar into five equal intervals (0.0–0.2, 0.2–0.4, …, 0.8–1.0) and add a tick at each intermediate percentage. Then find the position on the scale that matches the coagulation level observed for U in (b)(ii).
Step-by-Step Reasoning
- The scale bar runs from 0.0% to 1.0% and is divided into five equal intervals. Mark the ticks at 0.2, 0.4, 0.6 and 0.8 (in addition to the 0.0 and 1.0 already shown).
- The known concentrations and their coagulation levels (from (b)(i)) are:
- 0.0% → −
- 0.2% → +
- 0.4% → ++
- 0.6% → +++
- 0.8% → ++++
- 1.0% → +++++
- For U, the observed coagulation in (b)(ii) is ++++ or +++++. The most consistent interpretation is ++++, matching the 0.8% standard. The candidate should mark 'U' on the scale at the 0.8% tick (or between 0.6% and 1.0%, closer to 0.8%, if ++++ is observed).
- The mark scheme awards 1 mark for the tick marks at the correct positions and 1 mark for placing U at a position consistent with the (b)(ii) result.
Key Takeaways
- A scale bar must be divided into equal intervals matching the spacing of the calibration values.
- The unknown's position is read off the scale by matching its response to the responses of the standards.
- A 6-level qualitative key gives better resolution than the 3-colour biuret key, so the coagulation method produces a more precise estimate of U's concentration (this is the point of the comparison the question is leading the candidate towards).
Common Mistakes
- Marking the ticks unevenly (e.g. putting 0.5% in the middle, rather than at the correct proportional position) — the ticks must be at 0.2, 0.4, 0.6, 0.8.
- Placing U at the wrong end of the scale (e.g. at 0.2% if U was ++++). The candidate must use their own (b)(ii) result to place U.
- Placing U outside the 0.0–1.0% range — the scale only covers this range, and U is known to be in it from the biuret test.
Things to Be Careful About
- The marks are awarded for (a) the six correct tick positions and (b) U in a position consistent with the (b)(ii) result. If the candidate's (b)(ii) result is anomalous, the U position should still be consistent with it.
- 'U' should be written above the scale at the correct position, with a short vertical line or arrow linking it to the scale if the position is between ticks.
Milk proteins can also be coagulated using the enzyme rennet.
A student investigated the effect of temperature on the activity of rennet, shown by the percentage coagulation of the milk.
The results are shown in Table 1.4.
Table 1.4
| temperature / °C | percentage coagulation of the milk |
|---|---|
| 8.5 | 7 |
| 28.0 | 63 |
| 35.5 | 84 |
| 41.0 | 92 |
| 50.0 | 39 |
Plot a graph of the data in Table 1.4 on the grid in Fig. 1.4.
Use a sharp pencil for drawing graphs.

Answer
A line graph with:
- x-axis labelled 'temperature / °C', range 0 to 50, scale 10 °C per 2 cm (each major gridline = 10 °C)
- y-axis labelled 'percentage coagulation of the milk', range 0 to 100, scale 20% per 2 cm (each major gridline = 20%)
- Five points plotted as small crosses or dots in circles: (8.5, 7), (28.0, 63), (35.5, 84), (41.0, 92), (50.0, 39)
- A sharp, ruled line joining the points in sequence, point to point (not a smooth curve of best fit)
Line graph plotted with x-axis 'temperature / °C' (0–50, 10 °C per 2 cm) and y-axis 'percentage coagulation of the milk' (0–100, 20% per 2 cm); five points plotted; sharp point-to-point line.
Background Concept
A line graph is the correct choice when both variables are continuous (here, temperature and percentage coagulation). A line graph shows the trend of the dependent variable (y) as the independent variable (x) changes. The mark scheme for this question specifies that the line should be point to point, not a smooth curve of best fit — this is the convention for plot-and-join data where the candidate is expected to show the actual observations rather than a smoothed trend.
Conventions for graph plotting in CIE Biology:
- The independent variable goes on the x-axis, the dependent variable on the y-axis.
- Each axis must be labelled with the quantity and unit (e.g. 'temperature / °C').
- The scale must be linear, use at least half the grid, and not have an awkward break.
- Each plotted point is a small, clear cross or a dot in a circle.
- The line is sharp (ruled with a pencil) and either a best-fit line (where the trend is monotonic) or point-to-point (where the data are discrete observations at different temperatures, and a curve would distort the true shape).
Understanding the Question
The candidate is given five (x, y) pairs in Table 1.4 and must plot them on the printed grid in Fig. 1.4. The four marks are for:
- Correct axis labels (x and y).
- Correct scales (10 to 2 cm on x, 20 to 2 cm on y, with each 2 cm labelled).
- Correct plotting of the five points.
- Sharp line joined point to point.
Approach
Choose the axes (x = temperature, y = percentage coagulation), choose scales that fit the data on the grid, plot each point carefully, then join them in order with a sharp line.
Step-by-Step Reasoning
-
Axis labels (1 mark):
- x-axis: 'temperature / °C'
- y-axis: 'percentage coagulation of the milk'
The unit must be included in the label (here °C on x; percentage coagulation has no separate unit because it is already a percentage).
-
Scales (1 mark):
- x-axis: 0 to 50 °C (the data range is 8.5–50). Scale: 10 °C per 2 cm, so major gridlines at 0, 10, 20, 30, 40, 50. The scale must use at least half the grid.
- y-axis: 0 to 100% (the data range is 7–92, but 0–100 is conventional for percentage data). Scale: 20% per 2 cm, so major gridlines at 0, 20, 40, 60, 80, 100.
- Scales must be linear (each 2 cm represents the same number of units) and labelled at every 2 cm.
-
Plotting (1 mark):
- (8.5, 7) — x = 8.5 → just to the left of the 10 tick. y = 7 → just above the 0 line.
- (28.0, 63) — x = 28 → between 20 and 30, closer to 30. y = 63 → between 60 and 80, just above 60.
- (35.5, 84) — x = 35.5 → halfway between 30 and 40, slightly to the left. y = 84 → between 80 and 100, just above 80.
- (41.0, 92) — x = 41 → just past 40. y = 92 → between 80 and 100, just below 100.
- (50.0, 39) — x = 50 → at the right edge. y = 39 → just below 40.
- Each point is a small, clear cross or a dot in a circle. Large blobs that obscure the gridlines lose the mark.
-
Line (1 mark):
- A sharp, ruled line is drawn through the five points in order (left to right, in the order of the data).
- The line is point to point (straight segments between consecutive points), not a smooth curve of best fit. The data show a clear rise to a peak at 41 °C then a fall, so a curve of best fit would either distort the peak or smooth over the data.
Key Takeaways
- Axes must be labelled with quantity and unit.
- Scales must be linear and use at least half the grid.
- Points are plotted as small, clear crosses or dots in circles — large blobs are penalised.
- The choice of line style (point to point vs smooth curve vs best fit) depends on the data and the mark scheme instruction; here it is point to point.
Common Mistakes
- Omitting the unit on the x-axis (e.g. writing 'temperature' instead of 'temperature / °C').
- Using an awkward scale (e.g. each small square = 1 °C, which would make the numbers unreadable and the data points would not fit on the grid).
- Plotting points as large blobs that obscure the gridlines.
- Drawing a smooth curve of best fit instead of joining point to point — this would lose the 'line sharp and joined point to point' mark.
- Drawing a single straight line through the rise and ignoring the fall (or vice versa) — the candidate must join ALL five points in order.
Things to Be Careful About
- The data show a non-monotonic trend (rise to 41 °C, then fall to 50 °C). The point-to-point line will therefore have a peak at 41 °C; the candidate must not 'smooth' this peak away.
- The y-axis maximum is conventionally 100 (for percentage data), even though the highest data point is 92; this leaves space at the top of the graph and follows CIE convention.
- Each plot point is a small cross or a dot in a circle. The mark scheme for CIE Paper 3 graphs specifies this; large dots or large crosses lose the mark.
Suggest explanations for the results between 35°C and 45°C.
Answer
- From 35 °C up to 41 °C, the percentage coagulation increases (84% → 92%) because the enzyme (rennet) and substrate (milk protein) molecules have more kinetic energy, so they collide more frequently and with greater energy, forming more enzyme–substrate complexes (ESCs) per unit time.
- Above 41 °C, the percentage coagulation decreases sharply (92% → 39% at 50 °C) because the enzyme begins to denature — the increase in thermal energy disrupts the hydrogen bonds and other weak interactions that maintain the tertiary structure of the active site, so the active site loses its specific shape, fewer ESCs form, and the rate of coagulation falls.
35–41 °C: more kinetic energy → more ESCs → faster coagulation. Above 41 °C: enzyme denatures → active site changes shape → fewer ESCs → slower coagulation.
Background Concept
Enzymes are globular proteins whose catalytic activity depends on the precise 3-D shape of their active site. The active site is held in shape by relatively weak interactions (hydrogen bonds, hydrophobic interactions, ionic bonds) that can be disrupted by heat.
Two competing effects determine the rate of an enzyme-catalysed reaction as temperature rises:
- Kinetic effect (Q10 ≈ 2): as temperature rises, molecules move faster, collide more often, and a higher fraction of collisions have enough energy to overcome the activation energy. More enzyme–substrate complexes (ESCs) form per unit time, so the rate increases. This effect continues up to the optimum temperature.
- Denaturation effect: above the optimum, the thermal energy is enough to break the weak interactions that maintain the tertiary structure. The active site loses its specific shape, the substrate can no longer bind effectively, and the rate of reaction falls. Denaturation is usually irreversible.
The optimum temperature of an enzyme is the temperature at which these two effects balance to give the maximum rate. For rennet (a protease from the stomach of calves, used in cheese-making), the optimum is around 40–42 °C, which matches the peak in the data in Table 1.4.
Understanding the Question
The question asks the candidate to suggest explanations for the results between 35 °C and 45 °C. Looking at the data:
- 35.5 °C: 84% coagulation
- 41.0 °C: 92% coagulation (peak)
- 50.0 °C: 39% coagulation (just outside the range, but the trend continues into the range)
The question covers the region around the optimum, so the answer must address both the rise (kinetic effect, 35 → 41 °C) and the start of the fall (denaturation, just above 41 °C).
Approach
Split the 35–45 °C range into two parts:
- 35–41 °C: rate is still rising → kinetic effect dominates.
- 41–45 °C: rate is starting to fall → denaturation begins to dominate.
Step-by-Step Reasoning
-
From 35 °C to 41 °C (rise):
- As temperature increases, the rennet molecules and the casein substrate molecules have more kinetic energy.
- They move faster, collide more frequently, and a higher proportion of collisions have energy ≥ activation energy.
- More enzyme–substrate complexes form per unit time.
- The rate of coagulation increases (from 84% at 35.5 °C to 92% at 41 °C).
-
Above 41 °C (fall):
- The increase in thermal energy begins to disrupt the weak interactions (hydrogen bonds, etc.) that hold the active site of rennet in its specific shape.
- The active site denatures — its 3-D shape is lost.
- The substrate (casein) can no longer bind effectively, so fewer enzyme–substrate complexes form.
- The rate of coagulation falls (from 92% at 41 °C down to 39% at 50 °C).
-
The optimum (41 °C):
- At 41 °C the kinetic effect and the denaturation effect are balanced to give the maximum rate.
- Above 41 °C the denaturation effect accelerates rapidly, so the rate falls sharply.
-
The mark scheme awards two marks for any two of:
- With increasing temperature, the enzyme and substrate have more kinetic energy.
- More ESCs are formed as temperature increases to 41 °C.
- Above 41 °C, the enzyme / rennet denatures.
- Above 41 °C, fewer ESCs are formed.
Key Takeaways
- The temperature–activity curve of an enzyme is the result of two competing effects: kinetic (faster collisions) up to the optimum, and denaturation (loss of active site shape) above the optimum.
- The optimum temperature is enzyme-specific and is determined by the thermal stability of the protein.
- Denaturation is usually irreversible — cooling the enzyme back down does not restore the active site shape.
Common Mistakes
- Saying only that 'temperature affects enzyme activity' without explaining the mechanism (kinetic energy → more ESCs; denaturation → fewer ESCs).
- Saying the enzyme 'dies' or is 'killed' — enzymes are not alive; they denature.
- Confusing the denaturation of the enzyme with the denaturation of the substrate (casein). Both are proteins, but the rate-limiting effect here is on the enzyme (rennet), whose concentration is much lower than the substrate.
- Saying the reaction is fastest at 50 °C because 'heat speeds up reactions' — this ignores the denaturation effect.
- Saying the enzyme 'works best at body temperature' because rennet comes from a calf's stomach — true by coincidence, but the explanation should be in terms of the balance between kinetics and denaturation, not the source of the enzyme.
Things to Be Careful About
- The question is about 35–45 °C, which spans the optimum. The answer must address both the rise and the start of the fall, not just one side.
- 'ESCs' is the CIE abbreviation for enzyme–substrate complexes; the term can also be written in full.
- The mark scheme accepts four alternative points; any two earn the two marks. The two most common pairs are (kinetic energy → more ESCs) and (denaturation → fewer ESCs).
If a student wanted to investigate the independent variable, pH, a number of experiments would need to be set up.
State the pH values you would select and describe how you would change the pH.
pH values ______
description ______
Answer
pH values: 2, 4, 6, 8, 10 (five or more values covering a wide acidic-to-alkaline range).
description: use buffer solutions at each pH value to maintain the pH during the experiment.
pH 2, 4, 6, 8, 10; use buffer solutions to set and maintain each pH.
Background Concept
Enzyme activity is strongly affected by pH because the ionisation state of amino acid side chains in the active site (and of the substrate) depends on the H⁺ concentration. Each enzyme has an optimum pH at which the active site has the correct shape and charge for substrate binding. Above and below the optimum, the rate falls because the ionisation of the active site (or the substrate) changes, reducing the efficiency of binding.
To investigate the effect of pH on an enzyme, the candidate must:
- Choose a range of pH values that spans both acidic and alkaline conditions (typically pH 2 to pH 10 or wider) so the optimum can be located.
- Control the pH during the experiment. Because the reaction itself (or the substrate, or the products) can shift the pH, the pH must be held constant by a buffer solution at each chosen pH.
- Use a range of at least five values so the shape of the pH–activity curve can be seen, and the optimum can be located between two values if it does not coincide with one of the chosen values.
Understanding the Question
The question gives the candidate the freedom to choose the pH values AND to describe how to set the pH. The mark is awarded for both:
- Five or more pH values (a range that spans acidic and alkaline conditions).
- The use of buffer solutions to set and maintain the pH.
Approach
Choose pH values that span the biologically relevant range (pH 2 to pH 10, at intervals of 2 units, gives five values). State that buffer solutions are used because they hold the pH constant even as the reaction proceeds.
Step-by-Step Reasoning
-
Choice of pH range:
- A reasonable choice is pH 2, 4, 6, 8, 10 (five values at 2-unit intervals, covering acidic to alkaline).
- Other valid choices include 1, 3, 5, 7, 9, 11 or 2, 3, 4, 5, 6, 7, 8 — any five or more values across the range.
-
How to set the pH:
- Add a known volume of buffer solution at each pH to the reaction mixture (e.g. 1 cm³ of buffer to 9 cm³ of milk).
- Buffers resist changes in pH, so the pH stays close to the chosen value even as the reaction proceeds.
- The pH of each buffer must be checked with a pH meter (or pH indicator paper) before use, because commercial buffers can drift in pH over time.
-
Controls / standardisation:
- All other variables (temperature, concentration of rennet, concentration of milk, time) must be kept constant across the different pH tubes, so that pH is the only independent variable.
- The temperature should be controlled (e.g. water bath at the optimum temperature of rennet, ~40 °C) to remove temperature as a confounding factor.
-
The mark scheme awards 1 mark for both elements: five or more pHs + buffers.
Key Takeaways
- An enzyme investigation needs a range of values of the independent variable that spans the expected optimum (typically 5 or more).
- The independent variable must be set and held constant during the experiment; for pH, this is done with buffer solutions.
- All other variables (temperature, substrate concentration, enzyme concentration, time) must be kept constant across the different pH tubes, so that any difference in rate can be attributed to pH alone.
Common Mistakes
- Listing fewer than five pH values (e.g. just 'pH 4, 7, 10') — three values is not enough to define a curve.
- Choosing pH values that are too close together (e.g. pH 6.0, 6.5, 7.0, 7.5, 8.0) — these do not span a wide enough range to see the optimum, and a 0.5-unit resolution is finer than buffers can be relied upon to maintain.
- Describing the use of 'acid' or 'alkali' to change the pH — this changes the pH but does not hold it constant; buffers are required for the pH to be controlled throughout the reaction.
- Forgetting to state that other variables (especially temperature) are kept constant.
Things to Be Careful About
- The mark is for both the choice of pH values AND the use of buffers. Missing either loses the mark.
- The pH values should span both acidic and alkaline conditions, otherwise the optimum (which could be at either end) will not be located.
- The candidate does not need to know the optimum pH of rennet; the point of the investigation is to find it.
The rest of this paper
1 more questions- Q2Use of the Light Microscope18M