Biology 9700/33 — February/March 2018
Cambridge AS Level · Advanced Practical Skills · worked solutions for every part, with the mark scheme
Topics Presentation of Data and Observations · Analysis, Conclusions and Evaluation · Manipulation, Measurement and Observation · Use of the Light Microscope
Mung bean seeds contain an enzyme that is used to hydrolyse (break down) sucrose into reducing sugars. This enzyme is essential to provide the reducing sugars needed for the seeds to grow.
When mung bean seeds are soaked in sucrose solution, some of this enzyme diffuses into the surrounding solution and hydrolyses the sucrose.
The apparatus was set up as shown in Fig. 1.1.
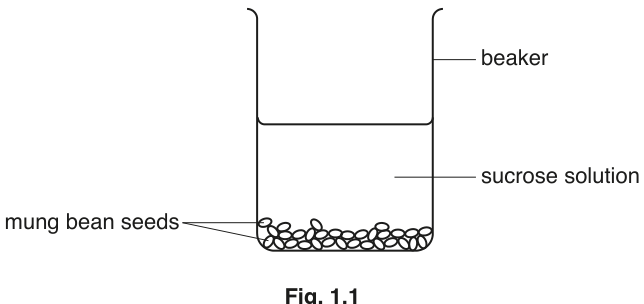
Samples of the sucrose solution were removed at 10 minutes (sample S1), at 15 minutes (sample S2) and at 30 minutes (sample S3) after adding the sucrose solution.
You are required to:
- make a serial dilution of 1.0% reducing sugar solution, R
- carry out the Benedict’s test on each concentration of reducing sugar
- carry out the Benedict’s test on S1, S2 and S3
- estimate the concentration of reducing sugar in S1, S2 and S3.
You are provided with the materials shown in Table 1.1.
Table 1.1
| labelled | contents | hazard | volume/ |
|---|---|---|---|
| R | 1.0% reducing sugar solution | none | 50 |
| S1 | sample removed after 10 minutes | none | 20 |
| S2 | sample removed after 15 minutes | none | 20 |
| S3 | sample removed after 30 minutes | none | 20 |
| W | distilled water | none | 100 |
| Benedict’s | Benedict’s solution | harmful | 40 |
It is recommended that you wear suitable eye protection. If Benedict’s comes into contact with your skin, wash it off immediately under cold water.
- Set up a water-bath and heat the water to a suitable temperature to test for reducing sugars using the Benedict’s test.
State the temperature you will need to maintain in the water-bath to carry out the Benedict’s test.
temperature = ______
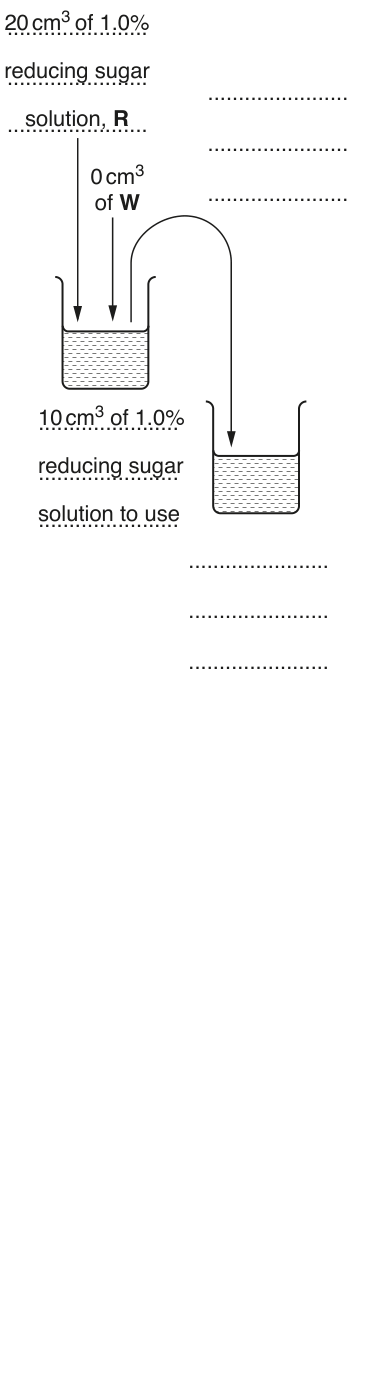
You are required to make a serial dilution of the 1.0% reducing sugar solution, R, which reduces the concentration by half between each successive dilution. This will provide you with a set of reducing sugar solutions of known concentrations.
After the serial dilution is completed, you will need to have of each concentration available for use.
Fig. 1.2 shows the first two beakers that you will use to make your serial dilution.
Complete Fig. 1.2 by drawing as many extra beakers and arrows as you need to show how you will carry out your serial dilution.
For each beaker:
- state, under the beaker, the volume and concentration of the reducing sugar solution in the beaker that will be available for use in the investigation, after the serial dilution has been completed
- use one arrow, with a label above the beaker, to show the volume and concentration of reducing sugar solution added to prepare the concentration of the reducing sugar solution in the beaker
- use another arrow, with a label above the beaker, to show the volume of distilled water, W, added to prepare the concentration of reducing sugar solution in the beaker.
The first part of Fig. 1.2 has been labelled for you.
Read step 2 to step 4 before proceeding.
- Prepare all the concentrations of reducing sugar solution shown in Fig. 1.2, in the beakers provided.
You will need to carry out a Benedict’s test on each of the different concentrations of reducing sugar solution and on of each of S1, S2 and S3.
You will be recording the time taken for the first appearance of a colour change.
State the volume of Benedict’s solution and the volume of each of the concentrations of reducing sugar solution you will use for each test.
volume of Benedict’s solution = ______
volume of each concentration of reducing sugar solution = ______
- Using the volumes you decided in (a)(iii), carry out the Benedict’s test on the reducing sugar solutions of different concentrations shown in Fig. 1.2.
Test one solution at a time, using the syringe labelled B for the Benedict’s solution.
Record, in (a)(iv), the time taken for the first appearance of a colour change.
If there is no colour change after 120 seconds, record as ‘more than 120’.
Record your results in an appropriate table.
You are required to estimate the concentration of reducing sugars in S1, S2 and S3.
- Carry out the Benedict’s test on of each of S1, S2 and S3 and record the time taken for the appearance of the first colour change.
State the time taken for the appearance of the first colour change for S1, S2 and S3.
S1 ______ S2 ______ S3 ______
Complete Fig. 1.3 by:
- labelling the position on the line of each of the percentage concentrations of reducing sugar solution shown in Fig. 1.2
- putting the labels S1, S2 and S3 on Fig. 1.3 to show an estimate of the concentrations of reducing sugar in S1, S2 and S3.

Sample S1 was removed from the sucrose solution 10 minutes after seeds had been added. Sample S2 was removed 15 minutes after the seeds had been added.
Suggest an explanation for the difference in results for S1 and S2.
If the mung bean seeds are soaked in the sucrose solution for more than 30 minutes, the concentration of reducing sugar remains the same as S3.
Use your knowledge of enzymes to explain this observation.
A student set up the apparatus shown in Fig. 1.4 to investigate whether a different type of seed also releases an enzyme that hydrolyses sucrose.
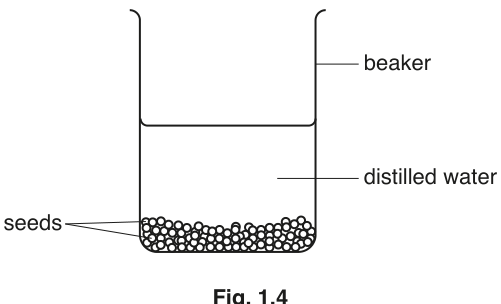
After 30 minutes, the student tested the water for protein. This test showed that protein was present in the water.
State the name of the test for protein.
The student suggested the hypothesis:
the protein in the water is an enzyme that hydrolyses sucrose.
The student mixed of the water containing the protein with of 1% sucrose solution. After 30 minutes, reducing sugars were present.
Describe how the student could have set up a suitable control for this experiment to provide evidence that hydrolysis of sucrose was due to an enzyme.
Another student tested the concentration of this enzyme that had been released from the seeds of several different species using a standard method.
The results are shown in Table 1.2.
Table 1.2
| species of plant | concentration of enzyme / arbitrary units |
|---|---|
| F | 9.5 |
| G | 15.0 |
| H | 17.0 |
| J | 20.5 |
| K | 39.5 |
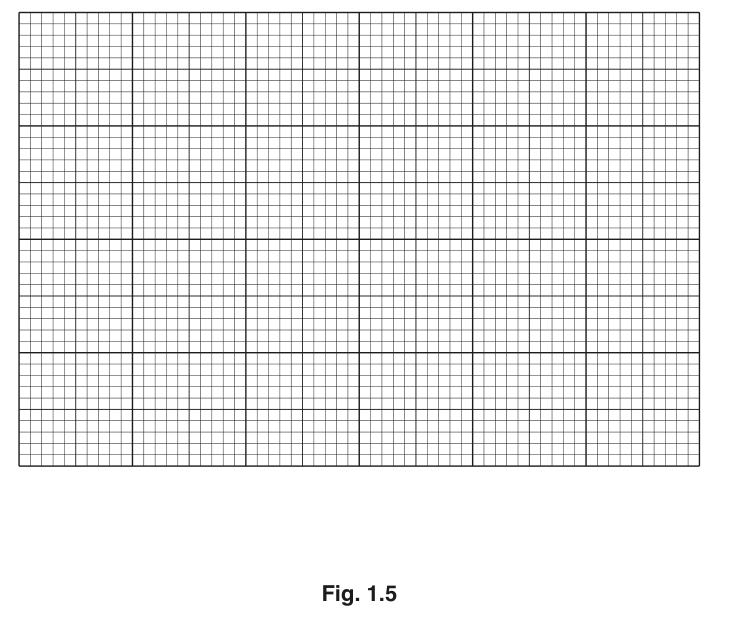
Draw a bar chart of the data in Table 1.2 on the grid in Fig. 1.5.
Each bar should be separated for each species of plant.
Use a sharp pencil for drawing bar charts.
The rest of this paper
1 more questions- Q2Use of the Light Microscope · Presentation of Data and Observations · Analysis, Conclusions and Evaluation19M