Biology 9700/36 — October/November 2017
Cambridge AS Level · Advanced Practical Skills · worked solutions for every part, with the mark scheme
Topics Manipulation, Measurement and Observation · Analysis, Conclusions and Evaluation · Presentation of Data and Observations
You are provided with a solution, labelled E, containing an enzyme which coagulates (clots) milk. Enzyme E hydrolyses (breaks) peptide bonds between certain amino acids in a protein found in milk and this results in the coagulation of the milk. Calcium ions are required for this coagulation.
You are required to:
- carry out a trial test to think about sources of error
- investigate the effect of substrate concentration on this enzyme-catalysed coagulation.
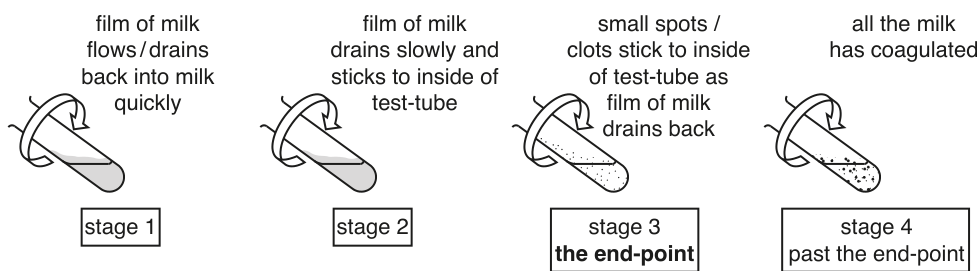
When a mixture of milk, calcium chloride solution and E is gently rotated in a test-tube the coagulation goes through the stages shown in Fig. 1.1.
Stage 3 is the end-point of the enzyme-catalysed coagulation.
You are provided with:
| labelled | contents | hazard | volume / |
|---|---|---|---|
| C | 10% calcium chloride solution | harmful irritant | 20 |
| W | distilled water | none | 100 |
| M | milk | none | 100 |
| E | 1% enzyme solution | harmful irritant | 20 |
If C or E comes into contact with your skin, wash off immediately under cold water. It is recommended that you wear suitable eye protection.
You are required to carry out a trial test (step 1 to step 16) before you start your investigation.
Read step 1 to step 16 before proceeding.
Proceed as follows:
-
You are provided with a beaker labelled water-bath. Use the hot and cold water to set up a water-bath in this beaker. The starting temperature of the water-bath should be between and .
You will not need to maintain this temperature during steps 2 to 15.
-
Put of M into a test-tube.
-
Repeat step 2 so that you have three test-tubes containing M.
-
Put of C into each test-tube.
-
Gently shake each of the test-tubes to mix M and C.
-
Take the temperature of the water-bath and record this temperature in (a)(ii) on page 5.
-
Put the test-tubes into the water-bath and leave for at least 3 minutes.
Explain why the test-tubes are left in the water-bath for at least 3 minutes in step 7.
Answer
To allow the (milk + calcium chloride) mixture in each test-tube to reach the temperature of the water-bath, so that when E is added the enzyme-catalysed reaction begins at a known, standardised temperature.
So that the milk/calcium chloride mixture reaches the temperature of the water-bath before the enzyme is added.
Background Concept
Enzymes are biological catalysts and their activity is strongly temperature-dependent. Below the optimum, raising the temperature increases the kinetic energy of enzyme and substrate molecules, raising the frequency of productive collisions at the active site. Above the optimum, the tertiary structure of the enzyme is disrupted and activity falls sharply. A change of only a few degrees Celsius is therefore enough to change the rate of an enzyme-catalysed reaction measurably.
Understanding the Question
Step 7 puts three test-tubes, each containing milk and calcium chloride, into a water-bath set to – and leaves them for at least 3 minutes. The candidate is asked to explain why this waiting step is built into the procedure.
Approach
The 3-minute wait is an equilibration step. The contents of the test-tubes start at laboratory temperature (around ). The enzyme is not added until step 9, so the contents must be at the water-bath temperature before the reaction is triggered; otherwise the time recorded would include a period during which the mixture is still warming up, and the rate measured would not be the rate at the intended temperature.
Step-by-Step Reasoning
- The water-bath has been set to a known temperature between and .
- The milk + calcium chloride mixture in each test-tube is initially at room temperature, so it is colder than the water-bath.
- The 3-minute wait allows heat to conduct through the glass wall of the test-tube and into the liquid, so that the contents of the test-tube reach the same temperature as the water-bath.
- When enzyme E is added in step 9 the reaction therefore begins at a known, controlled temperature, and any later difference in time taken can be attributed to the variable being investigated (substrate concentration), not to a drifting temperature.
- Without this equilibration, three identical test-tubes could give three different times simply because they were at three different temperatures when the enzyme was added.
Key Takeaways
• Equilibration with a thermostatted water-bath is a routine preliminary step before any rate measurement on an enzyme.
• A reaction that begins before the contents are at the intended temperature gives a misleading rate and invalidates any comparison between trials.
• Controlling temperature is part of controlling variables; doing it for every trial, not just the first, is what makes the comparison valid.
Common Mistakes
• Saying the step is to 'activate the enzyme' – the enzyme is not yet in the tube, so this is irrelevant.
• Saying it is 'to mix the milk and calcium chloride' – mixing is already done in step 5.
• A vague 'to warm up' – the precise point is that the contents must reach the water-bath temperature, not just become a bit warmer.
Things to Be Careful About
The mark scheme rewards the specific idea that the contents of the test-tubes reach the temperature of the water-bath. Wording such as 'to warm up the milk' or 'to prepare the reaction' does not score.
-
Remove one of the test-tubes from the water-bath.
The process of coagulation will start when E is added to the test-tube.
-
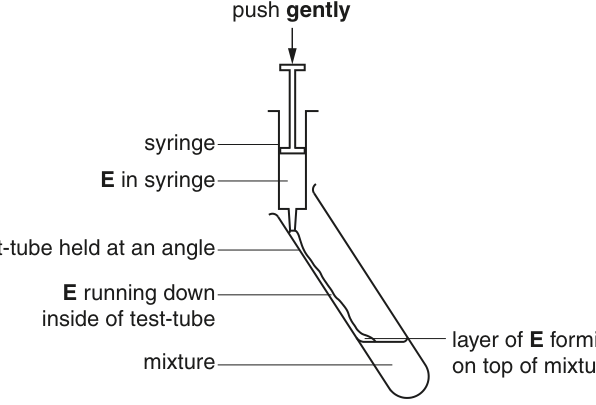
Put of E into the test-tube, so that it runs down the side of the test-tube and forms a layer on the surface of the mixture, as shown in Fig. 1.2.
- Gently shake the test-tube to mix the solutions and start timing.
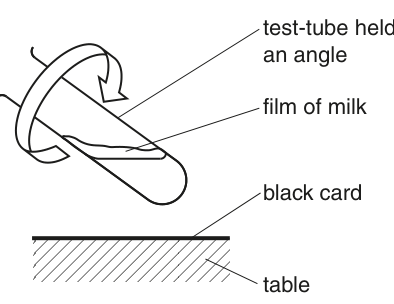
- Hold the test-tube over a piece of black card on the table as shown in Fig. 1.3.
- Gently rotate the test-tube to form a film of milk on the inside of the test-tube.
-
Observe the film until the end-point is reached (stage 3 in Fig. 1.1). Ignore any small bubbles on the inside of the test-tube. Stop timing.
-
Record in (a)(iii) the time taken to reach the end-point.
If the end-point has not been reached in 4 minutes, stop the experiment and record 'more than 240'.
-
Repeat step 8 to step 14 with each of the other two test-tubes in the water-bath.
-
Take the temperature of the water-bath when the final test-tube has been removed and record this in (a)(ii).
Temperature may be a source of error in this investigation.
State the temperatures of the water-bath.
temperature of water-bath taken in step 6 = ______
temperature of water-bath taken in step 16 = ______
Explain whether the temperature of the water-bath is a significant source of error in this investigation.
Answer
Step 6: ; Step 16:
The temperature of the water-bath fell by during the trial. Because the rate of the enzyme-catalysed reaction is temperature-dependent, a change of this size would alter the rate of coagulation, so the temperature of the water-bath is a significant source of error in this investigation.
Step 6 = 38 °C, Step 16 = 36 °C; the 2 °C fall is a significant source of error because enzyme activity is temperature-dependent.
Background Concept
The rate of an enzyme-catalysed reaction increases with temperature up to the optimum, mainly because more molecules have kinetic energy greater than the activation energy and collide more often with the correct orientation at the active site. The (temperature coefficient) for an enzyme reaction is typically around 2, meaning that for every rise the rate roughly doubles; conversely, a fall of a few degrees measurably slows the reaction.
Understanding the Question
Step 6 asks the candidate to record the water-bath temperature before any test-tube is removed for testing; step 16 asks the candidate to record the water-bath temperature when the final test-tube has been removed. The candidate must record both values and then comment on whether the change between the two readings makes temperature a significant source of error in the trial.
Approach
The two temperature readings are student-dependent, but the candidate's job is to make a clear statement that (a) references the actual difference between the two readings and (b) judges whether that difference is large enough to have meaningfully altered the rate of the enzyme-catalysed reaction. Whether the answer is 'significant' or 'not significant' is less important than the explicit reference to the actual difference.
Step-by-Step Reasoning
- A water-bath between and is set up. The initial reading (step 6) is taken before the trial.
- By step 16 the bath has cooled to some lower temperature, because no attempt is made to maintain the temperature (the rubric explicitly says the bath does not need to be maintained).
- The candidate records both readings. Representative values are at step 6 and at step 16, a fall of .
- The candidate then judges the significance of this fall. Because enzyme E hydrolyses peptide bonds, and the rate of any enzyme-catalysed reaction is temperature-sensitive, a change is large enough to alter the rate measurably, so the temperature change is a significant source of error.
- The same logic would apply in reverse: if the two readings were within , the candidate could legitimately say temperature is not a significant source of error in this trial. The mark scheme rewards a statement that explicitly references the difference.
Key Takeaways
• In any rate experiment, the controlled variable (here, temperature) must be monitored at the start and the end so that any drift can be quantified.
• The significance of a drift depends on the sensitivity of the reaction to that variable, not just on the size of the drift.
• A small temperature change (a few °C) can be significant for an enzyme-catalysed reaction because of the effect.
Common Mistakes
• Writing only 'temperature affects enzyme activity' without quoting the two readings – the mark scheme requires reference to the difference between the readings.
• Stating the temperatures but offering no judgement on whether the change is significant.
• Saying the temperature 'should have been controlled' – this is a criticism of method, not an evaluation of the actual drift observed.
Things to Be Careful About
The temperatures are the candidate's own readings, so the precise values cannot be predicted. The mark scheme awards the mark for an appropriate statement that explicitly references the actual difference observed. A clearly stated difference (e.g. 'fell by ') plus a clear judgement ('significant' or 'not significant') is what scores.
Record your results in an appropriate table.
Answer
| trial | time to reach end-point / |
|---|---|
| 1 | 52 |
| 2 | 48 |
| 3 | 50 |
Table of three trial times to the nearest whole second, with a heading.
Background Concept
In Paper 3 a results table must (i) carry a heading that makes clear what each column contains, (ii) include the units in the column heading (not in the body of the table), (iii) show all the data the candidate has collected, and (iv) use a consistent number of significant figures within each column.
Understanding the Question
The candidate has just carried out the trial test (steps 8–15) on three test-tubes of milk + calcium chloride with the same concentration, and has timed each one to the end-point. The candidate must now record those three times in a table. Because this is the trial test, the times are the candidate's own readings and so are student-dependent, but the table conventions are what earn the marks.
Approach
Produce a small table with one column for the trial number and one column for the time. Put the unit (s or seconds) in the heading, not the body. Use a sensible whole-second precision throughout.
Step-by-Step Reasoning
- Identify the two pieces of information per row: which trial the reading came from, and the time taken to the end-point.
- Write a heading row with two columns: 'trial' and 'time to reach end-point / s' (or 'time / s'). Units belong in the heading.
- Enter the three recorded times. Representative values: 52 s, 48 s and 50 s – the mean is 50 s, consistent with the candidate having reached the end-point in around 50 s on the first attempt.
- Use whole seconds (the mark scheme explicitly requires this), so no decimal places.
- The table should be ruled and the columns clearly separated.
Key Takeaways
• Always put the unit in the column heading, not in the data cells.
• In a Paper 3 table of repeated measurements, one column should identify the repeat (trial 1, trial 2, …) so a mean can be calculated later.
• The same precision is used in every row of a column.
Common Mistakes
• Omitting the unit in the heading, or putting 'seconds' or 's' in the body cells.
• Missing one of the three trial times.
• Mixing units (e.g. one row in seconds, another in minutes).
• Putting the trial numbers in a separate column from the times and not labelling the trial column.
Things to Be Careful About
The mark scheme awards 1 mark for the table and its heading and 1 mark for the three times recorded. Both must be present. The trial column is the easiest way to satisfy the 'heading' requirement and to allow a mean to be calculated later.
A significant source of error for this investigation is deciding when the end-point is reached.
Suggest one advantage of carrying out this trial test before investigating the effect of substrate concentration on this enzyme-catalysed reaction.
Answer
It allows the candidate to practise identifying the end-point (stage 3 in Fig. 1.1) so that, during the main investigation, the end-point can be judged more accurately and consistently, reducing the error in the recorded times.
It allows the candidate to practise recognising the end-point so it can be judged more accurately in the main investigation.
Background Concept
A trial (or preliminary) run is a complete dry execution of an experiment at a single set of conditions, performed before the main investigation. Its purpose is to expose practical difficulties, reveal the size of the readings, and let the experimenter practise the steps that involve judgement.
Understanding the Question
The question has just noted that deciding when the end-point is reached is a significant source of error, and asks the candidate to suggest one advantage of doing the trial test before starting the investigation of substrate concentration. The question is open-ended and one good advantage is enough.
Approach
Pick the most useful and specific advantage. 'Learn to identify the end-point' is the mark-scheme-credited answer because it directly tackles the very source of error just identified. Other valid advantages include: confirming the procedure works, identifying unexpected practical problems, and giving a rough idea of the time taken so the main experiment can be planned with appropriate repetition.
Step-by-Step Reasoning
- The end-point (stage 3, with small spots/clots sticking to the inside of the test-tube) is a subjective visual judgement. Two different observers, or the same observer on two different occasions, can disagree on the exact moment of stage 3.
- By performing the trial three times (step 15), the candidate has practised judging the end-point three times and has become consistent in their own personal criterion.
- As a result, in the main investigation the candidate is more likely to stop the stopwatch at the same point each time, reducing the random error in the recorded times and making the comparison between substrate concentrations more reliable.
Key Takeaways
• A trial run is essential whenever an experiment contains a subjective judgement (colour change, clotting, exact end-point, counting).
• Repeated practice narrows the variability in the observer's personal criterion, which reduces the random error in the main readings.
• Trials can also reveal whether the experiment works at all and give a sense of the timing involved.
Common Mistakes
• Vague answers like 'to check the method' or 'to reduce error' – the mark scheme wants the specific benefit (learning the end-point).
• 'To make the results more accurate' – this is a restatement of the problem, not the specific advantage.
• 'To get more results' – the trial is not used in the main analysis, so its results are not part of the data set.
Things to Be Careful About
The question asks for ONE advantage, and the mark scheme credits answers that focus on practising the judgement of the end-point. Answers that simply rephrase the problem ('to see if there are any errors') do not score because they do not name the specific benefit.
You are required to investigate the effect of substrate concentration on this enzyme-catalysed coagulation.
Identify the dependent variable in this investigation.
Answer
Time taken to reach the end-point (of coagulation).
Time taken to reach the end-point.
Background Concept
In any experiment, the independent variable is the one the experimenter deliberately changes; the dependent variable is the one that is measured to see the effect of that change. Everything else must be kept constant (controlled variables). In a rate-of-reaction experiment the dependent variable is usually a time, a volume, a mass, or a colour change, because these can all be measured quantitatively.
Understanding the Question
The investigation is to be the effect of substrate concentration on the enzyme-catalysed coagulation. The candidate must identify what is being measured, i.e. what changes in response to the changing substrate concentration. The independent variable is clearly the concentration of milk; the dependent variable is the measurement that responds to it.
Approach
Look at the trial procedure (steps 8–14): the experimenter adds the enzyme and times how long the test-tube takes to reach stage 3 of Fig. 1.1. That time is the only measurement taken, and it is what will change as the substrate concentration is varied.
Step-by-Step Reasoning
- The independent variable is the concentration of milk (varied in (a)(vi) and (a)(vii)).
- The procedure records only one quantitative value per trial: the time from adding enzyme to reaching stage 3 of Fig. 1.1.
- That time is the dependent variable, because it is the response being measured to see how the rate of coagulation depends on substrate concentration.
- The rate could equally be reported as , but the mark scheme wants the actual quantity measured, not its reciprocal, so the answer is 'time taken to reach the end-point'.
Key Takeaways
• The dependent variable is the one that is measured, not the one that is varied.
• In rate experiments the dependent variable is often a time; the rate is the reciprocal of the time.
• Naming the dependent variable precisely (e.g. 'time to reach the end-point' rather than 'time') shows understanding of what the experiment actually measures.
Common Mistakes
• Saying 'the rate of reaction' – the rate is not directly measured, it is derived from the time. The mark scheme wants the measured quantity.
• Saying 'the concentration of milk' – this is the independent variable, not the dependent variable.
• Saying 'coagulation' on its own – this is the process, not a measurable variable.
Things to Be Careful About
The mark scheme requires the exact phrase 'time taken to reach end-point' (or a clear equivalent). 'Time' alone is too vague because it does not specify which event the time is measured to.
You are required to prepare different concentrations of milk, using M.
M is undiluted milk and is to be referred to as 100% milk.
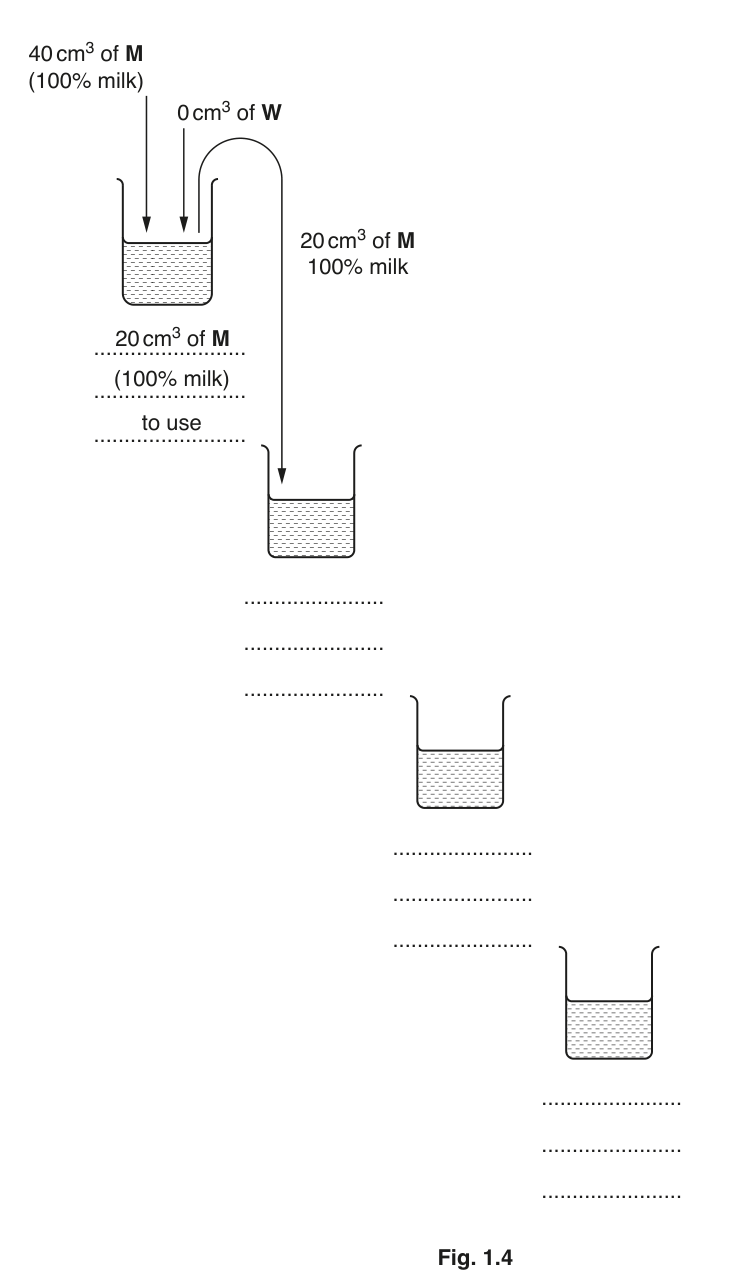
You are required to make a serial dilution of M, which reduces the concentration of M by half between each successive dilution. You will need to prepare 3 further concentrations of milk.
You will need to prepare of each concentration.
Complete Fig. 1.4 to show how you will dilute M by:
- stating, under each beaker, the volume and concentration of the milk available for use in the investigation
- using one arrow, with a label above the beaker, to show the volume and concentration of milk added to prepare the concentration
- using another arrow, with a label above the beaker, to show the volume of distilled water, W, added to prepare the concentration.
Answer
The completed serial dilution is shown below.
100% → 50% → 25% → 12.5% by transferring 20 cm³ and adding 20 cm³ of water at each step; 20 cm³ of each is available for use.
Background Concept
A serial dilution is a stepwise dilution in which the same dilution factor is applied at each step. If the factor is 1/2 (a 'half' dilution), the concentration halves at every step, so 100% → 50% → 25% → 12.5% → … . To produce each new concentration, a fixed volume of the previous concentration is mixed with an equal volume of diluent (water), and the same volume of the new concentration is then available for the next step.
The total volume needed at each step is the volume transferred in + the volume of diluent. To have of each concentration available for use in the investigation, must be transferred to the next beaker and kept in the current one. Each beaker therefore needs of milk + of water = of mixture, of which is transferred on and is used.
Understanding the Question
The candidate is given a printed diagram (Fig. 1.4) of four beakers arranged diagonally. The first beaker already contains of M (100% milk) with of W, and a label showing that of 100% milk is to be used from it. The candidate must complete the diagram so that the same serial dilution procedure produces three further concentrations (50%, 25% and 12.5%), with of each available for use.
Approach
For each step, the same recipe applies: take of the previous concentration, add of water, mix, take forward to the next beaker, and keep for use. Apply this recipe three times to the three further beakers, and label each beaker with the volume and concentration of milk available for use.
Step-by-Step Reasoning
- Beaker 1 (already given): of M (100%), of W → of 100% milk available for use.
- Step 1 → 2: Transfer of 100% milk from beaker 1 to beaker 2; add of W to beaker 2. Concentration in beaker 2 = . Total volume = . Take for use; transfer the other to beaker 3.
- Step 2 → 3: Transfer of 50% milk from beaker 2 to beaker 3; add of W to beaker 3. Concentration in beaker 3 = . Total volume = . Take for use; transfer the other to beaker 4.
- Step 3 → 4: Transfer of 25% milk from beaker 3 to beaker 4; add of W to beaker 4. Concentration in beaker 4 = . Total volume = . Take for use (no further transfer).
- Each beaker is labelled with the volume () and concentration (100% / 50% / 25% / 12.5%) of milk available for use, and each arrow between beakers is labelled with both the milk volume and concentration transferred and the water volume added.
Key Takeaways
• A serial dilution that halves at each step needs equal volumes of the previous concentration and diluent.
• The volume needed at each step is determined by the volume that will be used downstream plus the volume that will be transferred to the next beaker.
• Always state both the volume AND the concentration in the labels on the figure.
Common Mistakes
• Adding the wrong volume of water (e.g. ) – the recipe is fixed by the requirement of for use plus to transfer on.
• Miscalculating the concentration (e.g. 50% → 12.5% instead of 50% → 25% → 12.5%).
• Forgetting the % sign on the concentration – the mark scheme explicitly requires the '%' symbol.
• Labelling only the volume on the 'milk added' arrow, not the concentration.
Things to Be Careful About
Each arrow carries TWO labels: one for the milk transferred (volume and concentration) and one for the water added (volume). The 'available for use' label under each beaker must also include both volume and concentration. The % sign is required.
-
Prepare the concentrations of milk as decided in (a)(vi) and in Fig. 1.4.
-
Adjust the temperature of the water-bath so that it is between and . You will not need to maintain this temperature during step 19 to step 24.
-
Put of the lowest concentration of milk into a test-tube.
-
Repeat step 19 with each of the other concentrations of milk that you have prepared and with 100% milk.
-
Put of C into each test-tube.
-
Gently shake each of the test-tubes to mix the milk and C.
-
Put the test-tubes into the water-bath and leave for at least 3 minutes.
While you are waiting read step 8 to step 13.
-
After 3 minutes remove one of the test-tubes from the water-bath. Add of E as in step 9, then repeat step 10 to step 13 and record in (a)(vii) the time taken to reach the end-point.
-
Repeat step 24 with each of the other test-tubes.
Record your results in an appropriate table.
Answer
| concentration of milk / % | time to reach the end-point / |
|---|---|
| 12.5 | 198 |
| 25 | 122 |
| 50 | 78 |
| 100 | 45 |
Table with concentration of milk (%) and time to reach end-point (s), showing the fastest time at 100% milk and whole-second precision.
Background Concept
In Paper 3 the results table for an experiment must (i) carry a heading that makes clear what each column contains, (ii) include the units in the heading, (iii) record all the data the candidate has collected, and (iv) use a consistent precision within each column. A table of repeated measurements should also have either a separate column for each repeat (and a mean column) or a row for each repeat within a single time column.
Understanding the Question
The candidate has just carried out the main investigation of substrate concentration (steps 17–25): four concentrations of milk (12.5%, 25%, 50% and 100%) plus, in the procedure, the option of repeats. The candidate must record the times in an appropriate table. The values are student-dependent, but the format, the units, the number of concentrations and the trend are what earn the marks.
Approach
Produce a table with one column for the concentration of milk (the independent variable) and one column for the time to the end-point (the dependent variable). Put the unit (% and s) in each column heading. Use a whole-second precision throughout. Ensure that the smallest time corresponds to the highest concentration, because at higher substrate concentration the active sites of the enzyme are saturated more quickly, so coagulation is reached faster.
Step-by-Step Reasoning
- The independent variable is concentration of milk; the dependent variable is time to the end-point. The two are the natural columns.
- The concentrations used are those prepared in (a)(vi): 12.5%, 25%, 50% and 100%.
- The times will reflect the kinetics: as substrate concentration rises, the rate of the enzyme-catalysed reaction rises (more substrate is available, more enzyme–substrate complexes form per unit time), so the end-point is reached more quickly. The fastest time must therefore be at 100% milk.
- Representative times that show this trend: 198 s at 12.5%, 122 s at 25%, 78 s at 50%, 45 s at 100%. The fastest is 45 s at 100%.
- Whole-second precision is required (the mark scheme explicitly demands it).
- The heading row must include units: 'concentration of milk / %' and 'time to reach the end-point / s'.
Key Takeaways
• The mark scheme requires (a) a table with a heading, (b) at least three times for at least three different concentrations, (c) the fastest time at the highest concentration, and (d) whole-second precision.
• Putting the unit in the heading (not the body) is a Paper 3 convention.
• The trend (faster coagulation at higher substrate concentration) is a kinetic prediction that any correct enzyme-rate experiment should show.
Common Mistakes
• Recording decimal places (e.g. 45.2 s) – the mark scheme demands whole seconds.
• Forgetting the unit in the heading.
• Reversing the trend (showing faster coagulation at lower substrate) – this is biologically wrong.
• Recording only two or three concentrations when the procedure used four (100% plus the three dilutions).
• Putting 'replicate 1, replicate 2, replicate 3' in the table instead of the independent variable.
Things to Be Careful About
The mark scheme awards 1 mark for the table and headings, 1 mark for at least three times at three concentrations, 1 mark for the fastest time at the highest concentration, and 1 mark for whole-second precision. All four must be present to earn full marks.
Describe a control that could be carried out as part of your investigation.
Answer
Replace the milk (or replace enzyme E) with the same volume of distilled water in one of the test-tubes and carry out the procedure as normal. No coagulation should occur, showing that the reaction requires both the protein substrate in milk and the active enzyme.
Replace the milk (or the enzyme) with the same volume of distilled water; no coagulation should occur.
Background Concept
A control is a parallel experiment in which the variable under test is removed or neutralised, so that any difference between the control and the test can be attributed to that variable. In an enzyme experiment, two standard controls are (a) replacing the substrate with water (so any reaction observed cannot be due to the substrate being present) and (b) replacing the active enzyme with water or with boiled (denatured) enzyme (so any reaction observed cannot be due to active enzyme).
Understanding the Question
The candidate is asked to describe a control that could be carried out as part of the investigation of substrate concentration on the enzyme-catalysed coagulation. The control must isolate the effect of the variable under test by removing one of the essential components of the reaction.
Approach
Pick the simplest control that the existing procedure can accommodate. Two acceptable answers are: (a) replace the milk with the same volume of water, or (b) replace enzyme E with the same volume of water, or (c) use enzyme that has been boiled and cooled (denatured) in place of fresh E.
Step-by-Step Reasoning
- The reaction requires three things: the protein substrate in milk, calcium ions, and active enzyme E.
- A control should remove or neutralise one of these so that the effect of removing it can be observed.
- The simplest control is to substitute distilled water for the milk in one of the test-tubes (still adding the usual of C and of E). With no substrate, no hydrolysis of peptide bonds can occur and so no coagulation is seen. This demonstrates that the coagulation observed in the test tubes is due to the enzyme acting on the protein in milk.
- An equally valid alternative is to substitute distilled water for enzyme E in one test-tube (still adding milk and C). With no active enzyme present, no peptide bonds are broken and no coagulation is seen.
- A third alternative is to use enzyme that has been boiled and cooled – the high temperature denatures the enzyme so it can no longer bind substrate, and again no coagulation is seen.
Key Takeaways
• A control tests whether the observed effect depends on the variable that has been removed or neutralised.
• In an enzyme experiment, controls usually involve omitting the substrate, omitting the enzyme, or denaturing the enzyme.
• The control should be described precisely: the same volumes, the same temperature, the same procedure – only the one component is changed.
Common Mistakes
• Vague answers like 'do the experiment without the variable' – the mark scheme wants the specific reagent that is replaced.
• 'Use a different enzyme' – this is not a control; it is a different experiment.
• 'Repeat the experiment' – repeating is replication, not a control.
• 'Don't add calcium chloride' – this would test the role of Ca²⁺, which is interesting but is not a control for the variable under test (substrate concentration).
Things to Be Careful About
The mark scheme credits any of three equivalent controls: replace milk with water, replace enzyme with water, or use boiled and cooled enzyme. The answer must be specific (name the reagent replaced) and must include the expected result to count as a proper control.
This procedure investigated the effect of substrate concentration on the activity of enzyme E, using the time taken to reach the end-point.
To modify this procedure for investigating another variable, the substrate concentration would need to be standardised.
Describe how the substrate concentration could be standardised.
Think about how you could modify this procedure to investigate the effect of temperature on the time taken to reach the end-point.
Describe the modifications needed to investigate the effect of temperature.
Answer
• Use a single (constant) concentration of milk (e.g. 100% milk) for every test-tube, so that substrate concentration is no longer the variable.
• Use at least five different temperatures, e.g. , , , and , across the range expected to include the optimum.
• Place each test-tube in a thermostatically controlled water-bath set to the chosen temperature, so that the temperature is held constant throughout the reaction (in the original procedure the bath was allowed to cool, which is acceptable for a single trial but not when temperature is the variable being investigated).
Use one milk concentration; use at least five temperatures; hold each temperature with a thermostatically controlled water-bath.
Background Concept
To change the independent variable in an experiment, two things must happen at once: the new variable must be varied systematically across the trials, and the previous independent variable must now be held constant. In addition, the new variable must itself be controlled (kept at a known, stable value) during each trial – otherwise the rate cannot be attributed to the intended temperature.
Understanding the Question
The original procedure investigated the effect of substrate (milk) concentration on the time to the end-point, with temperature held approximately constant by the water-bath. The candidate is asked to describe how to modify the procedure to investigate the effect of temperature instead. The mark scheme rewards three things: a single concentration of milk, at least five temperatures, and a thermostatically controlled water-bath.
Approach
Identify what must change (temperature) and what must be standardised (substrate concentration). For each chosen temperature the water-bath must actually hold that temperature, which means a thermostatically controlled bath rather than the unmaintained bath of the original procedure.
Step-by-Step Reasoning
- Standardise the substrate concentration: pick one concentration of milk (e.g. 100%) and use it for every test-tube. This removes milk concentration as a variable and so any difference in time can be attributed to temperature rather than to substrate availability.
- Vary the temperature: choose at least five temperatures spread across a sensible range, for example , , , and . Five is the minimum that allows a peak (the optimum) to be located.
- Control the temperature during each trial: in the original procedure the water-bath was allowed to cool between the start and end of the trial, which would have confounded any comparison between temperatures. When temperature is the variable under test, each water-bath must be thermostatically controlled so that it holds the set temperature throughout the reaction. The candidate must therefore specify the use of a thermostatically controlled water-bath.
- Everything else (volumes of milk, calcium chloride and enzyme, mixing procedure, rotation, judgement of the end-point) is kept the same as in the original procedure.
Key Takeaways
• To swap the independent variable, keep the old independent variable constant and introduce systematic variation in the new one.
• The new variable itself must be controlled (held at a known value) during each trial.
• When investigating temperature, the unmaintained water-bath used in the original trial is not adequate – a thermostatically controlled bath is required.
• A range of at least five temperatures is needed to locate the optimum of an enzyme-catalysed reaction.
Common Mistakes
• Varying both temperature and milk concentration – the experiment is then under-determined.
• Using only two or three temperatures – too few to see a trend or locate the optimum.
• 'Use a different water-bath' – this is too vague; the mark scheme wants the word 'thermostatically controlled'.
• 'Maintain the temperature' – this is what was done (or not done) in the trial; the mark scheme specifically requires a thermostatically controlled water-bath.
Things to Be Careful About
The mark scheme awards 1 mark for the substrate-concentration standardisation, 1 mark for at least five temperatures, and 1 mark for the thermostatically controlled water-bath. All three marks are independent and must each be earned.
A scientist investigated the percentage mass of protein in milk produced by different animals.
The results are shown in Table 1.1.
Table 1.1
| source of milk | percentage mass of protein in milk |
|---|---|
| cow (co) | 3.5 |
| elephant (el) | 4.0 |
| sheep (sh) | 5.4 |
| seal (se) | 10.2 |
| mouse (mo) | 9.0 |
Use a sharp pencil for drawing charts.
Draw a chart of the data shown in Table 1.1.

Answer
Bar chart with source of milk on the x-axis and percentage mass of protein on the y-axis; five separate thin-lined bars in the order cow, elephant, sheep, seal, mouse with heights 3.5, 4.0, 5.4, 10.2, 9.0.
Background Concept
A bar chart is used to display discontinuous (categorical) data, where the x-axis lists named categories (e.g. species) rather than a continuous numerical scale. The y-axis carries the numerical quantity. CIE conventions for a bar chart in Paper 3 are:
• x-axis labelled with the name of the categorical variable; the bars are equally spaced and of equal width.
• y-axis labelled with the quantity AND the unit; the scale uses at least half the available grid and the intervals are easy to read (e.g. 1, 2 or 5 per 2 cm, never an awkward number like 3 or 7).
• Each bar is drawn as a separate rectangle (a small gap between bars) with a thin, ruled outline and no shading.
• The bars are plotted in the order of the data table, not re-ordered by size.
Understanding the Question
The candidate is given a small data table of the percentage mass of protein in milk from five different animals and an empty grid (Fig. 1.5) and is asked to draw a chart of the data. Because the categories (species) are discrete, a bar chart is the appropriate display.
Approach
Decide the axes first, then the scale, then plot the five bars in the table order. Use the scale 2.0 per 2 cm on the y-axis (the mark-scheme-credited scale) so that the y-axis runs from 0 to 10.2 (or 12.0 if extended). With , the seal bar at 10.2% will be 10.2 cm tall – this comfortably uses more than half the grid.
Step-by-Step Reasoning
- x-axis: label 'source of milk'. The five categories (in the order of Table 1.1) are: cow, elephant, sheep, seal, mouse. They are evenly spaced along the axis and each bar has the same width with a small gap between bars.
- y-axis: label 'percentage mass of protein in milk'. The scale runs from 0 at the origin to 10.2 (or 12) at the top, with major gridlines every 2 cm labelled at least every 2 cm – e.g. 0, 2, 4, 6, 8, 10. With 2.0 per 2 cm, the numerical value 2.0 lies on the second major gridline, 4.0 on the fourth, and so on.
- Heights of the bars (in cm, where ):
• cow: →
• elephant: →
• sheep: →
• seal: →
• mouse: → - Plot the bars in the table order (cow, elephant, sheep, seal, mouse) – not in size order. This is important because the mark scheme credits 'bars in order of table'.
- Each bar is drawn as a separate rectangle with a thin, ruled outline and no shading. A small, consistent gap separates the bars.
Key Takeaways
• A bar chart is used for categorical data; a histogram is for continuous data and would not be appropriate here.
• The y-axis scale must be easy to read, use at least half the grid, and have a clear unit in the heading.
• Bars are plotted in the order of the data table, not re-ordered by size, because the categorical variable has no inherent order.
• Thin lines and ruled outlines are CIE conventions for Paper 3.
Common Mistakes
• Using a scale that does not use at least half the grid (e.g. 0 to 20 when the largest value is 10.2) – the largest bar would be only about half the grid tall.
• Re-ordering the bars by size – this loses the categorical nature of the data and is not what the mark scheme credits.
• Drawing the bars with shading or thick freehand edges instead of a thin, ruled outline.
• Forgetting the unit in the y-axis heading.
• Omitting the gap between bars (drawing them touching) – the mark scheme requires five separate bars.
Things to Be Careful About
The mark scheme awards 1 mark for the correct axes and labels, 1 mark for the even bar widths and the y-axis scale (2.0 to 2 cm, labelled at least every 2 cm), 1 mark for the correct plotting of all five bars in table order, and 1 mark for the five separate bars drawn with thin lines. All four must be present for full marks.
A scientist investigated enzyme-catalysed coagulation of milk using enzyme E. This enzyme hydrolyses (breaks) peptide bonds between certain amino acids in a protein found in milk and this results in the coagulation of the milk.
The scientist recorded the time taken to reach the end-point with each of the types of milk shown in Table 1.1. The shortest time to reach the end-point was recorded when seal milk was investigated.
Use your knowledge of enzymes and the data in Table 1.1 to suggest an explanation for this result.
Answer
Seal milk has the highest percentage mass of protein (10.2%) of the milks tested, so there is a higher concentration of substrate (the protein that enzyme E hydrolyses). More substrate molecules are therefore available to bind to the active sites of the enzyme, so more enzyme–substrate complexes form per unit time and the reaction proceeds faster; the end-point of coagulation is reached in the shortest time with seal milk.
Seal milk has the most protein, so more enzyme–substrate complexes form per unit time and the reaction is fastest.
Background Concept
The rate of an enzyme-catalysed reaction depends on the concentration of substrate, up to a point. At low substrate concentrations the active sites of the enzyme molecules are not fully occupied and the rate is limited by substrate availability; as substrate concentration rises, more active sites are occupied at any moment, more enzyme–substrate (ES) complexes form per unit time, and the rate rises. This continues until the enzyme is saturated (all active sites permanently occupied) and the rate reaches a maximum (). The hypothesis is therefore that a higher substrate concentration → more ES complexes per unit time → faster reaction.
In the experiment in part (a), the substrate is the protein in milk, and enzyme E hydrolyses peptide bonds in that protein. So milks with a higher protein content present more substrate molecules per unit volume to the enzyme.
Understanding the Question
The data in Table 1.1 shows that seal milk has the highest percentage mass of protein (10.2%) of the five milks tested, followed by mouse (9.0%), sheep (5.4%), elephant (4.0%) and cow (3.5%). The scientist then measured the time to the end-point of coagulation with enzyme E and found that seal milk gave the shortest time. The candidate must use the data and knowledge of enzymes to explain this result.
Approach
The observation is that seal milk coagulated fastest. The data show that seal milk also has the highest protein content. The link between these two facts is the substrate concentration: more protein in the milk means a higher concentration of the substrate that enzyme E acts on, which means more ES complexes per unit time and a faster reaction.
Step-by-Step Reasoning
- The data in Table 1.1 show that seal milk contains protein, the highest of the five milks tested.
- The protein in milk is the substrate for enzyme E, which hydrolyses the peptide bonds between specific amino acids in that protein.
- A higher concentration of substrate (more protein per unit volume of milk) means that, at any given concentration of enzyme, more substrate molecules are available to bind to the active sites of the enzyme.
- More successful collisions between enzyme and substrate produce more enzyme–substrate complexes per unit time, and the rate of the reaction (hydrolysis of peptide bonds, leading to coagulation) is therefore higher.
- A higher rate of reaction corresponds to a shorter time to reach the end-point of coagulation, which is exactly what was observed for seal milk.
Key Takeaways
• When interpreting a rate experiment, look first for the variable that differs most between the conditions – here, the protein content.
• The enzyme–substrate model predicts a direct link between substrate concentration and reaction rate (at subsaturating substrate concentrations).
• A higher rate means a shorter time to a fixed end-point – rate and time are reciprocals.
Common Mistakes
• Saying seal milk 'has more enzymes' – it is the substrate, not the enzyme, that differs between milks. The enzyme is added in the same concentration in every trial.
• Saying seal milk 'is thicker' or 'is fattier' – fat content is not what is being measured; protein is.
• Saying the reaction is faster because seal milk 'contains more nutrients' – too vague; the mark scheme wants the specific link via substrate concentration and ES complex formation.
• Confusing rate and time – the answer must say the rate is higher, not just the time is shorter.
Things to Be Careful About
The mark scheme awards 1 mark for stating that seal milk has the highest concentration of protein (linked to the data in Table 1.1) and 1 mark for the mechanistic explanation in terms of more enzyme–substrate complexes forming (or more substrates binding to active sites). Both marks are required.
The rest of this paper
1 more questions- Q2—17M