Biology 9700/35 — October/November 2017
Cambridge AS Level · Advanced Practical Skills · worked solutions for every part, with the mark scheme
Topics Presentation of Data and Observations · Analysis, Conclusions and Evaluation · Use of the Light Microscope · Manipulation, Measurement and Observation
In humans, the kidneys are the organs that remove waste products from the blood and produce urine. Small, useful molecules such as glucose are also removed from the blood in the kidney. Glucose must be reabsorbed into the blood so that very little is lost in the urine.
The concentration of glucose in urine can be estimated in order to check that the kidneys are working.
You will not be testing real urine. You will be testing solutions that represent urine and will be referred to as ‘mock urine’.
You are required to test each of three samples of mock urine for the presence of glucose. These represent samples taken at different times from the same person.
You are provided with:
| labelled | contents | hazard | volume / |
|---|---|---|---|
| U1 | mock urine | none | 20 |
| U2 | mock urine | none | 20 |
| U3 | mock urine | none | 20 |
| Benedict’s | Benedict’s solution | none | 20 |
| G | 2% glucose solution | none | 20 |
| W | distilled water | none | 20 |
If Benedict’s comes into contact with your skin, wash off immediately under cold water.
It is recommended that you wear suitable eye protection.
Read step 1 to step 7 before proceeding.
Proceed as follows:
- Set up a water-bath and heat to boiling for use in step 6.
- Put of U1 into a test-tube.
- Put of Benedict’s solution into the same test-tube.
- Shake the test-tube gently to mix the contents.
- Repeat step 2 to step 4 for U2 and U3.
- Put all three test-tubes into the water-bath you prepared in step 1 and immediately start timing.
- Record in (a)(i) the time taken to the first colour change and record the final colour at . After , remove each of the test-tubes from the water-bath.
If there has been no colour change during the , record the time to the first colour change as ‘more than 90’. You should still record the final colour at .
Record your results in an appropriate table.
Answer
| mock urine sample | time to first colour change / | final colour at |
|---|---|---|
| U1 | ||
| U2 | ||
| U3 |
Representative example (times depend on the candidate's own observations):
| mock urine sample | time to first colour change / | final colour at |
|---|---|---|
| U1 | 30 | orange / brick-red |
| U2 | more than 90 | blue |
| U3 | 15 | brick-red |
- Head the independent variable (sample) as a column heading.
- Include units in the time heading: or .
- Record all times as whole numbers; record 'more than 90' for tubes that do not change colour within .
- Record the final colour at for each tube (e.g. blue, green, yellow, orange, brick-red).
See table — three rows for U1, U2, U3 with time (s) and final colour at 90 s.
Background Concept
Benedict's reagent is a copper(II) citrate complex in alkaline solution. When heated with a reducing sugar such as glucose, the Cu²⁺ ions are reduced to Cu⁺, which precipitate as red copper(I) oxide. The colour of the precipitate, and how quickly it forms, depends on how much glucose is present: high concentrations give a brick-red precipitate within seconds, while trace amounts may take minutes or never appear within the time limit. Because the time to the first appearance of colour and the final colour both vary systematically with glucose concentration, either (or both) can be used to rank samples by sugar content.
Understanding the Question
The candidate carries out the Benedict's test on three mock urine samples (U1, U2, U3) under standardised conditions and records two observations per tube: (i) the time at which the first colour change is seen (in whole seconds), and (ii) the final colour of the tube after exactly in the boiling water-bath. The question asks for these observations to be recorded in a clear table with correct headings and units.
Approach
The mark scheme rewards four conventions of a Paper 3 results table: (1) the independent variable heading on the left or top, (2) the dependent variable with units, (3) the recorded data values, and (4) consistency of numerical precision (whole seconds only). A typical layout has the sample as the left-hand column and the two recorded observations as further columns.
Step-by-Step Reasoning
- Identify the independent variable: this is the mock urine sample (U1, U2, U3). It goes as the leftmost column.
- Identify the dependent variables: time to first colour change (in seconds) and final colour at . Each becomes its own column with units in the heading.
- Record times as whole numbers: stop the timer as soon as any colour change is visible against a white background; round to the nearest whole second. If no change is observed by , write 'more than 90' rather than leaving the cell blank.
- Record the final colour: after note the predominant colour. The common colour sequence as glucose concentration rises is blue → green → yellow → orange → brick-red.
- Fill in the three rows: one row per sample. The values depend on what the candidate actually observes, so a representative table is given in the Solution.
Key Takeaways
- The independent variable is on the left; the dependent variable(s) and their units go across the top.
- Times to first colour change in a Benedict's test are quoted in whole seconds.
- 'No change within the time limit' must be recorded explicitly (e.g. 'more than 90'), not left blank.
- Final colour at a fixed end-point (here ) provides a complementary qualitative observation.
Common Mistakes
- Leaving the time cell blank when no colour change occurs (loses the mark — must write 'more than 90').
- Recording times to the nearest 0.5 or 0.1 s (mark scheme requires whole numbers).
- Forgetting the unit in the column heading.
- Putting the sample names across the top and the dependent variable down the side (this can still score, but the convention in this mark scheme is the leftmost column for the independent variable).
Things to Be Careful About
- Use a white background and look down the length of the tube to spot the first colour change.
- All three tubes are heated simultaneously in the same bath, so the clock is started once for all three. The first colour change is recorded when seen; the final colour is recorded at exactly .
Use your results in (a)(i) to state which of U1, U2, and U3 do not contain glucose.
.............................................................
Answer
U2 — the tube that remained blue at (or recorded 'more than 90' for first colour change) contains no glucose.
The candidate should insert the letter of the sample that did not change colour: U2 in the representative example.
U2 (the sample with 'more than 90' s and a blue final colour).
Background Concept
Benedict's reagent is blue. A reducing sugar such as glucose reduces the Cu²⁺ in the reagent to Cu⁺, which precipitates as brick-red copper(I) oxide. If the tube remains blue throughout the heating period, no detectable reducing sugar is present.
Understanding the Question
From the table completed in (a)(i), the candidate must identify which of U1, U2 or U3 does NOT contain glucose.
Approach
Look down the 'final colour at 90 s' column (and cross-check with the 'time to first colour change' column). Any sample whose tube is still blue at the end of the heating period contains no detectable glucose.
Step-by-Step Reasoning
- In the representative data, U1 turned orange within (glucose present) and U3 turned brick-red within (more glucose present).
- U2 showed no colour change in and was still blue at the end.
- No colour change means no Cu²⁺ has been reduced, so no glucose is present.
- Therefore U2 is the sample without glucose.
Key Takeaways
- 'No colour change' = 'no reducing sugar detected' in the Benedict's test.
- A blue final colour is the diagnostic outcome for a negative test.
Common Mistakes
- Confusing 'green' (a low-positive result, trace glucose) with 'blue' (a true negative).
- Saying 'U1 has no glucose' because its colour was 'only orange' — orange is still a positive result.
Things to Be Careful About
- Use the candidate's own results — the answer is determined by what was actually observed, not by a textbook expectation.
State how you will use your results in (a)(i) to identify which of U1, U2, and U3 has the highest concentration of glucose.
Answer
The mock urine sample with the shortest time to the first colour change has the highest concentration of glucose.
The sample with the shortest time to first colour change has the highest glucose concentration.
Background Concept
In a Benedict's test the rate of the redox reaction depends on how many glucose molecules are available to reduce Cu²⁺ ions. With more glucose molecules, more Cu²⁺ is reduced per second, the red precipitate appears sooner, and the first colour change is seen earlier. Time to first colour change is therefore inversely related to glucose concentration (provided temperature, volumes and reagent concentration are standardised).
Understanding the Question
The candidate must state, in words, how the table from (a)(i) can be used to rank the glucose concentrations of U1, U2 and U3.
Approach
Compare the entries in the 'time to first colour change' column. The smaller the time, the faster the reaction, the higher the glucose concentration.
Step-by-Step Reasoning
- All three tubes were heated under the same conditions.
- The first colour change is a visible marker of the reaction rate.
- A faster appearance of colour (smaller time) means more glucose per unit time is reducing Cu²⁺, i.e. a higher concentration of glucose.
- Therefore: shortest time → highest concentration.
Key Takeaways
- Time to first colour change is the kinetic measure of glucose concentration.
- Provided variables are standardised, time differences are meaningful for ranking.
Common Mistakes
- Saying 'the darkest colour has the most glucose' — colour darkness depends on both concentration and time, and is not as reliable as the time-to-first-change.
- Saying 'most glucose = longest time' (the relationship is inverted).
Things to Be Careful About
- This reasoning only holds because the same volume of Benedict's, the same volume of mock urine and the same temperature were used for every tube (see (a)(vi)).
State which of U1, U2, and U3 has the highest concentration of glucose. ...................
Answer
In the representative example the sample with the shortest time to first colour change is U3 (≈ ).
The answer must be whichever of U1, U2 or U3 the candidate's own data shows changed colour first.
U3 (the sample with the shortest time to first colour change) — confirmed from the candidate's own results.
Background Concept
This is a direct application of the rule stated in (a)(iii): the sample with the shortest time to first colour change has the highest glucose concentration.
Understanding the Question
The candidate looks at the time column from (a)(i) and names the sample that changed colour first.
Approach
Read the 'time to first colour change' column, identify the smallest number, and write down the corresponding sample.
Step-by-Step Reasoning
- From (a)(i) the times are (representative) U1 = , U2 = more than , U3 = .
- The smallest time is , belonging to U3.
- By the rule in (a)(iii), U3 has the highest glucose concentration.
Key Takeaways
- The answer depends entirely on the candidate's own observations; the mark scheme accepts whatever the data supports.
Common Mistakes
- Naming U1 by default because it is listed first.
- Naming the sample that turned darkest, rather than the one that turned fastest.
Things to Be Careful About
- If two samples have identical times, the answer cannot be distinguished and the candidate should record what they actually saw.
If the sample with the highest concentration of glucose is more than 0.5%, then this may mean that a kidney is not working.
You are required to estimate the concentration of glucose in the sample stated in (a)(iv) by:
- preparing of a 0.5% glucose solution
- carrying out a Benedict’s test on the 0.5% glucose solution
- using your results to estimate the concentration of glucose in the sample stated in (a)(iv).
You are provided with a 2% glucose solution, G.
Complete Table 1.1 to describe how G could be diluted to produce of a 0.5% glucose solution.
Table 1.1
| final percentage concentration of glucose | volume of 2% glucose solution / | volume of distilled water, W / |
|---|---|---|
| 0.5 |
Working
Use to find the volume of 2% glucose needed.
Volume of water required = total volume volume of stock
Answer
Table 1.1 completed:
| final percentage concentration of glucose | volume of 2% glucose solution / | volume of distilled water, W / |
|---|---|---|
| 0.5 | 2.5 | 7.5 |
Add of G to of W in the beaker provided, then mix.
2.5 cm³ of 2% glucose solution + 7.5 cm³ of distilled water
Background Concept
Diluting a solution of known concentration to a lower, known concentration is a routine laboratory calculation. Two principles are equivalent:
- Concentration conservation (): the mass of solute is unchanged by dilution, only the volume changes.
- Dilution factor: target concentration / stock concentration gives the fraction of stock required.
Either approach gives the same arithmetic; CIE candidates usually use because the equation is quoted on the formulae sheet.
Understanding the Question
The candidate is given of a 2% glucose stock (G) and asked to prepare exactly of a 0.5% glucose solution in the beaker. The two volumes (stock and water) must be entered in Table 1.1.
Approach
- Apply to find , the volume of 2% stock required.
- Subtract from the total volume to find the volume of water needed.
- Show all units so the mark scheme's two marking points are earned.
Step-by-Step Reasoning
- Choose values for C1, V1, C2, V2:
- (stock, G)
- (target)
- (final volume)
- = volume of 2% glucose required (unknown)
- Apply the equation:
- (mark point 1)
- Check the total volume: (mark point 2 — total volume quoted correctly).
- Calculate the water volume: .
The dilution factor is , so the stock makes up one quarter of the final volume () and water makes up the other three quarters () — a useful sanity check.
Key Takeaways
- Use (on the CIE formulae sheet).
- Always quote the total volume of solution as well as the stock volume.
- Verify by adding the two volumes: stock + water = total.
Common Mistakes
- Confusing (stock) with (final volume).
- Forgetting that the water is part of the final — adding of stock to of water would give of , not of .
- Recording stock + water (this would dilute to , not ).
Things to Be Careful About
- The final volume must be — the question specifies it explicitly. Don't make or any other total.
- Use a or graduated pipette for accurate measurement; a measuring cylinder is acceptable but less precise.
State one variable that must be standardised when carrying out the Benedict’s test, to allow you to make a valid comparison between the results collected in (a)(i) and the result you will collect for the 0.5% glucose solution you have prepared.
Answer
Any one of the following (mark scheme accepts any single creditable answer):
- Volume of Benedict's solution (must be the same in every tube).
- Volume of the sample being tested (must be the same in every tube).
- Temperature of the water-bath (the bath must be at boiling throughout the test).
- Size / thickness of the test-tubes (so that heating rate is comparable).
The most commonly credited answer is the volume of Benedict's solution added.
Volume of Benedict's solution (or volume of sample / temperature of water-bath).
Background Concept
For a comparison of reaction rates to be valid, every variable that could affect the rate — except the one being investigated (here, glucose concentration) — must be kept the same. In a Benedict's test the rate depends on:
- the volume / concentration of Benedict's reagent,
- the volume of sample,
- the temperature (the bath must be at boiling for the reaction to proceed quickly),
- the dimensions of the test-tube (affect how fast heat reaches the contents).
If any of these varies between tubes, a difference in time-to-first-colour-change cannot be attributed solely to glucose concentration.
Understanding the Question
The candidate is asked to name a single variable that must be the same when comparing (i) the original three mock urine tubes and (ii) the new tube containing 0.5% glucose, so that the time comparison made in (a)(vii)/(viii) is fair.
Approach
Pick the variable that is easiest to keep constant and that has the clearest effect on the rate. The volume of Benedict's reagent added is the most commonly credited answer; volume of sample, water-bath temperature and tube size are equally acceptable.
Step-by-Step Reasoning
- The Benedict's reaction is a chemical rate process. Its rate depends on temperature, reagent concentration and reagent volume.
- To compare rates fairly, the only thing that should differ between tubes is the glucose concentration.
- Volume of Benedict's is the easiest variable to standardise: a syringe or graduated pipette delivers the same volume to every tube.
- Therefore 'volume of Benedict's solution' (or another rate-affecting variable) is the answer.
Key Takeaways
- Identify rate-determining factors before designing a comparison experiment.
- The variable you vary = independent variable; everything else that affects the rate = variables to standardise.
Common Mistakes
- Saying 'amount of Benedict's' without specifying volume — 'amount' can mean moles, mass or concentration; the precise term is 'volume' or 'concentration'.
- Saying 'human error' or 'timing' — these are not specific controlled variables.
Things to Be Careful About
- Only one variable is required. Do not list several; the mark is for any one correct, identifiable variable.
- Prepare the 0.5% glucose solution as shown in Table 1.1 in the beaker provided.
- Repeat the Benedict’s test with the 0.5% glucose solution and the sample stated in (a)(iv).
- Record in (a)(vii) the time taken to the first colour change. After , remove the test-tubes from the water-bath.
If there has been no colour change during the record the time to the first colour change as ‘more than 90’.
Record your results in an appropriate table.
Answer
| solution tested | time to first colour change / | final colour at |
|---|---|---|
| 0.5% glucose (from G) | ||
| mock urine sample stated in (a)(iv) (e.g. U3) |
Representative example:
| solution tested | time to first colour change / | final colour at |
|---|---|---|
| 0.5% glucose (from G) | 45 | orange |
| mock urine sample U3 | 15 | brick-red |
- Headings include units (seconds / s).
- Times recorded as whole numbers.
- The final colour at is recorded for each tube.
- 'more than 90' is written if there is no colour change.
Two-row table with the 0.5% glucose standard and the highest-concentration sample (e.g. U3), each with time to first colour change in seconds and final colour at 90 s.
Background Concept
The Benedict's test is now being applied to a glucose standard of known concentration (0.5%) alongside the unknown sample from (a)(iv). The two tubes are run under identical conditions so that the time-to-first-colour-change for the unknown can be compared with the time for the 0.5% standard, allowing the unknown to be classified as below, equal to, or above 0.5%.
Understanding the Question
The candidate runs the Benedict's test on the freshly prepared 0.5% glucose solution and on the sample identified in (a)(iv), starting both timers from when the tubes enter the boiling water-bath. The two results must be recorded in a clear table.
Approach
Apply the same recording conventions used in (a)(i):
- independent variable on the left,
- dependent variables (time, final colour) as additional columns,
- units in the headings,
- whole-number times,
- 'more than 90' for tubes that do not change within .
Step-by-Step Reasoning
- Make a table with two rows: '0.5% glucose' and the sample from (a)(iv) — for example, U3.
- Add a 'time to first colour change / s' column. Heat both tubes in the boiling bath, starting the clock at the moment of immersion.
- Note the time (in whole seconds) when the first colour change becomes visible in each tube.
- After , note the final colour of each tube.
- Compare the two times: if the unknown takes less time than the 0.5% standard, its concentration is above 0.5%; if more time, it is below 0.5%; if the same time, it is approximately 0.5%.
In the representative data, U3 changes colour in whereas 0.5% glucose takes . U3 is therefore above 0.5%, consistent with the brick-red final colour (the highest colour category for the Benedict's test).
Key Takeaways
- A standard of known concentration is run in parallel with the unknown.
- The unknown's time relative to the standard's time places the unknown in a concentration range.
- Use the same conventions for table headings and units as in (a)(i).
Common Mistakes
- Recording decimal times (the mark scheme requires whole seconds).
- Omitting units from the column heading.
- Forgetting to record the final colour at .
- Leaving the cell blank when no colour change occurs; the convention is 'more than 90'.
Things to Be Careful About
- Heat both tubes simultaneously in the same bath so that the timing is comparable.
- Use the same volume of Benedict's (2 cm³) and the same volume of solution (2 cm³) as in (a)(i).
Use your results from (a)(vii) to complete Table 1.2 by using one tick (✓) to show your estimate of the concentration of glucose in the sample stated in (a)(iv).
Table 1.2
| percentage concentration of glucose in mock urine sample | estimate tick (✓) |
|---|---|
| below 0.5 | |
| 0.5 | |
| above 0.5 |
Answer
Tick the row whose description matches the result obtained in (a)(vii):
| percentage concentration of glucose in mock urine sample | estimate tick (✓) |
|---|---|
| below 0.5 | |
| 0.5 | |
| above 0.5 | ✓ |
(In the representative example, the highest-concentration sample changed colour faster than the 0.5% standard, so the tick goes in the above 0.5 row.)
Tick (✓) 'above 0.5' if the unknown changed colour faster than the 0.5% standard; 'below 0.5' if it changed colour more slowly; '0.5' if the times were the same.
Background Concept
The Benedict's reaction is a rate process; at fixed temperature, reagent volume and sample volume, the rate depends on the concentration of reducing sugar. A standard of known concentration run in parallel therefore acts as a calibration point: any sample that reacts faster has a higher concentration, any that reacts slower has a lower concentration, and one that reacts at the same rate has the same concentration.
Understanding the Question
From the table in (a)(vii), the candidate decides whether the unknown's concentration is below, equal to, or above the 0.5% standard and places a single tick in Table 1.2.
Approach
Compare the time-to-first-colour-change of the unknown with that of the 0.5% standard:
- faster (smaller time) → higher concentration → tick above 0.5;
- slower (larger time, or 'more than 90') → lower concentration → tick below 0.5;
- same → tick 0.5.
Step-by-Step Reasoning
- In the representative example the unknown reacted in and the 0.5% standard reacted in .
- , so the unknown reacted faster, meaning it contained more glucose.
- The correct row is above 0.5, which receives the tick.
- If the times had been the other way round, the tick would go in below 0.5; if equal, in 0.5.
Key Takeaways
- A 'faster Benedict's reaction' corresponds to a higher glucose concentration when all other variables are controlled.
- A single standard is enough to place an unknown into a coarse concentration range (here, three categories).
Common Mistakes
- Confusing 'faster reaction' with 'less glucose' — the relationship is positive, not negative.
- Putting a tick in more than one row; the question requires exactly one tick.
Things to Be Careful About
- The decision must come from the candidate's own recorded times, not from a pre-conceived notion of what the answer should be.
This procedure enabled you to estimate the concentration of glucose in the mock urine sample.
Suggest how you would improve this procedure to find a more accurate estimate of this concentration.
Answer
Three improvements that together would give a more accurate estimate:
- Use more concentrations of glucose standard rather than a single 0.5% standard, so the unknown can be placed on a calibration curve.
- Prepare standards in a narrower range around the unknown, e.g. 0.5%, 1.0%, 1.5% (described by serial dilution of G with W: for example 5.0 cm³ of 2% + 5.0 cm³ of W = 1.0%; then dilute this 1.0% solution similarly to give 0.5%, and so on).
- Plot a graph of time to first colour change (y-axis) against glucose concentration (x-axis) and read off the concentration corresponding to the time obtained for the unknown sample.
Any three creditable suggestions covering these ideas are accepted.
Use a series of glucose standards in a narrow concentration range; plot a calibration graph of time vs concentration; read off the concentration of the unknown from the graph.
Background Concept
The current procedure uses a single standard (0.5%) to place the unknown into one of three coarse categories. This is a yes/no decision rather than an accurate measurement. To obtain a numerical estimate of concentration, the technique of choice is a calibration curve: a series of standards of known concentration are tested under identical conditions, the time-to-first-colour-change is plotted against concentration, and the time for the unknown is read off the line. The more standards there are, the more precisely the unknown can be estimated.
Understanding the Question
The candidate must suggest how the procedure could be improved so that the concentration of the unknown could be estimated more accurately, rather than merely classified as above or below 0.5%.
Approach
The mark scheme lists three expected improvements:
- Use more concentrations — the single 0.5% standard is too restrictive; a calibration needs at least four or five points to define a curve.
- Named concentrations in a narrower range — the standards should bracket the unknown. If the unknown is around 1%, standards at 0.5%, 0.75%, 1.0%, 1.25%, 1.5% are appropriate.
- Plot a graph and read off — converting times into concentrations requires a calibration curve.
Step-by-Step Reasoning
- More concentrations: instead of one standard, prepare several (e.g. five) by serial or proportional dilution of the 2% stock G with water W.
- Narrower range: choose concentrations close to the expected unknown concentration, so that the unknown's time lies within the time range spanned by the standards. A serial dilution from 2% down to 0.25% would give 2.0%, 1.0%, 0.5%, 0.25% in equal steps; a finer series (e.g. 1.4%, 1.2%, 1.0%, 0.8%, 0.6%) gives a denser calibration around the likely answer.
- Plot and read off: graph time to first colour change (y) against concentration (x), draw a smooth curve or line of best fit, and locate the unknown's time on the y-axis, then read horizontally to the curve and vertically down to the concentration axis.
Key Takeaways
- A single standard gives a coarse 'higher/lower' answer; a calibration curve gives a numerical estimate.
- Standards should bracket the unknown to minimise extrapolation error.
- A calibration curve is the standard analytical technique for converting a measured response (here, time) into a quantity (concentration).
Common Mistakes
- Suggesting vague improvements such as 'be more careful' or 'repeat more times' — these don't address the limited resolution of the single-standard method.
- Suggesting a colorimeter to measure absorbance — this is a different method (quantitative colorimetry), not an improvement of the Benedict's test as carried out here.
- Saying 'plot a graph' without explaining what is on each axis.
Things to Be Careful About
- The three mark-scheme points must all be addressed for full marks. The mark scheme does not accept a different set of three equivalent points unless each one is just as specific.
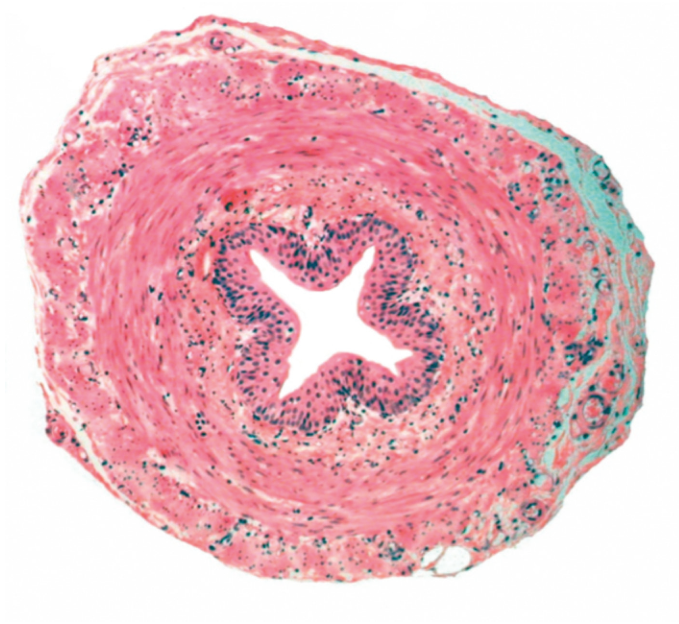
Fig. 1.1 is a photomicrograph of a stained transverse section through an animal organ. This organ is used to transport urine from the kidney to the bladder.
You are not expected to be familiar with this specimen.
Use a sharp pencil for drawing.
Draw a large plan diagram of half of the organ in Fig. 1.1, shown by the shaded area in Fig. 1.2.
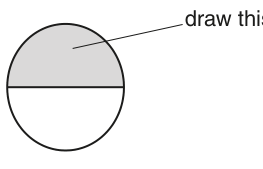
You are expected to draw the correct shape and proportions of the different tissues.
Answer
Plan diagram of the upper half of Fig. 1.1 (as shaded in Fig. 1.2):
Key conventions the mark scheme rewards:
- No shading, no individual cells drawn — only continuous lines representing tissue boundaries.
- Minimum size — the drawing must be at least half a page wide, showing the layered structure clearly.
- At least four tissue layers visible (drawn with at least five lines):
- outer adventitia (connective tissue),
- outer longitudinal smooth muscle,
- middle circular smooth muscle,
- inner longitudinal smooth muscle,
- lamina propria / sub-epithelial connective tissue.
- Inner epithelium drawn with two lines that follow the lobed (wavy) outline of the mucosa.
- Central lumen drawn as half a star shape — at least three points of the star are visible on the upper half.
- Correct proportions — the muscle layer is the thickest band; the lumen is much smaller than the wall thickness.
- Use a sharp pencil, continuous lines, no feathering or sketchy edges.
Plan diagram of half the ureter showing the lobed mucosa (two lines, wavy), the star-shaped lumen (at least three points on the upper half), the thick smooth-muscle layers, and the outer adventitia. No shading, no individual cells.
Background Concept
A plan diagram is a low-magnification outline drawing that shows the overall organisation of a specimen — the relative sizes, shapes and positions of tissues — without any cellular detail. It is drawn with a sharp pencil, using continuous clear lines (not feathery or sketchy), with no shading and no individual cells. Labels identify the tissues.
The ureter is the muscular tube that conveys urine from the renal pelvis of the kidney to the bladder. Its wall has the following layers, from inside (lumen) outwards:
- Transitional epithelium (urothelium): the inner lining, whose cells can stretch. It appears as a thin, often wavy ('lobed') boundary.
- Lamina propria / sub-mucosa: a thin layer of connective tissue beneath the epithelium.
- Smooth muscle: the bulk of the wall, organised into an inner longitudinal layer and a thicker outer circular layer (in some descriptions the outer longitudinal layer is also present).
- Adventitia: the outer connective-tissue coat that anchors the ureter to surrounding tissues.
In transverse section the lumen of the ureter is characteristically star-shaped because the mucosa is thrown into longitudinal folds when the muscle is relaxed. These features are visible in Fig. 1.1.
Understanding the Question
The candidate is given a photomicrograph of the ureter (Fig. 1.1) and a circle (Fig. 1.2) showing which half to draw (the upper shaded half). The candidate must produce a large plan diagram of that half, showing the correct shape and proportions of the tissues.
Approach
Follow the plan-diagram conventions:
- Plan the layout on the page — leave room for labels and a heading.
- Draw the outline of the wall using continuous lines, no shading, no cells.
- Reproduce the layers in correct relative thickness.
- Reproduce the shape of the inner epithelium (lobed) and the central lumen (star-shaped).
- Add clear label lines.
Step-by-Step Reasoning
- Size and shape: the section in Fig. 1.1 is roughly circular; the upper half should be drawn as a half-circle (or roughly half-oval), at least 10 cm across, occupying half a page or more. The mark scheme requires a minimum size.
- Inner boundary: draw the luminal surface as a wavy line (not a smooth arc) so that the lobed nature of the mucosa is visible. Use two lines (one for the epithelium and one for the underlying connective tissue) so the layer is recognisable.
- Star-shaped lumen: inside the wavy inner boundary, draw at least three of the star's points opening to the lumen (in the upper half, you should see the upper 'points' of the star and a small portion of the central opening). This is the diagnostic feature of the ureter in TS.
- Muscle layer: draw the smooth muscle as a thick continuous band — this is the thickest layer of the wall. It may be subdivided by faint lines into inner and outer muscle layers (and, in some sections, a third longitudinal layer at the outside of the muscle).
- Adventitia: a thin outer layer, separated from the muscle by a single line.
- No cells: do not draw individual cells or nuclei. Do not shade any layer.
- Labels: add label lines, written with a ruler, ending precisely on the layer they identify.
Key Takeaways
- A plan diagram shows tissue organisation only — never cells.
- Use continuous, sharp, single lines.
- Correct proportions matter: the muscle layer is much thicker than the epithelium or the adventitia.
- The star-shaped lumen is the diagnostic feature of the ureter in transverse section.
Common Mistakes
- Drawing individual cells (squiggles, dots, ovals) inside the muscle layer — this is a high-power drawing convention, not a plan diagram.
- Shading layers with pencil — the mark scheme rejects shaded drawings.
- Drawing a smooth, circular inner boundary instead of the lobed epithelium.
- Drawing the lumen as a simple slit or oval instead of a star.
- Making the muscle layer thinner than the lumen — the muscle must clearly be the thickest layer.
Things to Be Careful About
- The drawing must be of the upper shaded half as shown in Fig. 1.2 — drawing the whole section loses marks.
- Use a sharp pencil; lines must be clear and continuous.
- The mark scheme explicitly requires a minimum size, no shading, and no cells.
The rest of this paper
1 more questions- Q2Use of the Light Microscope · Presentation of Data and Observations · Analysis, Conclusions and Evaluation20M