Biology 9700/33 — October/November 2017
Cambridge AS Level · Advanced Practical Skills · worked solutions for every part, with the mark scheme
Topics Presentation of Data and Observations · Analysis, Conclusions and Evaluation · Manipulation, Measurement and Observation · Use of the Light Microscope
Plant cells contain enzymes that catalyse metabolic reactions. Some of these enzymes catalyse the release of oxygen from hydrogen peroxide.
A plant extract solution can be produced which will contain these enzymes.
When hydrogen peroxide and a plant extract solution are mixed oxygen is released. The oxygen forms bubbles that make a foam on the surface.
You are required to investigate the effect of pH on the progress of the enzyme-catalysed reactions by:
- changing the pH (independent variable) using buffers
- measuring the height of the foam (dependent variable) produced by the release of oxygen.
To follow the progress of this reaction you will need to measure the height of foam at different times for a total of 3 minutes.
Decide how often you will take these measurements including the final height of foam at 3 minutes.
State the times when you will measure the height of foam.
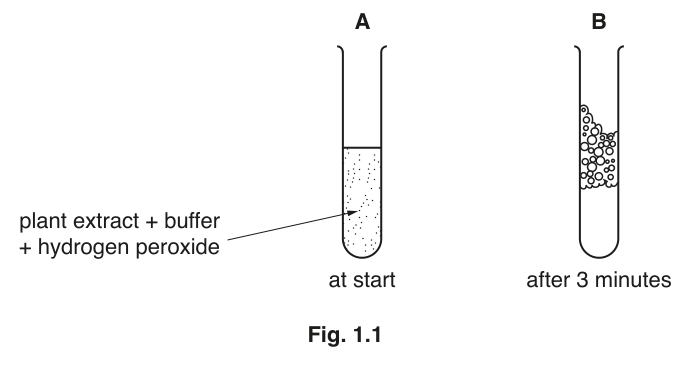
Fig. 1.1A shows how a test-tube will be set up at the start (0 minutes).
Fig. 1.1B shows the test-tube after 3 minutes.
The top of the foam may not form an even layer, so you will need to decide where to measure the layer of the foam.
Draw a double-headed arrow on Fig. 1.1B to show where you will measure this layer of foam.
You are provided with:
| labelled | contents | hazard | volume / |
|---|---|---|---|
| E | plant extract solution | harmful irritant | 40 |
| H | hydrogen peroxide solution | harmful irritant | 70 |
| B4 | buffer pH4 | none | 10 |
| B5 | buffer pH5 | none | 10 |
| B7 | buffer pH7 | none | 10 |
| B9 | buffer pH9 | none | 10 |
| B10 | buffer pH10 | none | 10 |
| U | unknown buffer | none | 10 |
| D | liquid detergent | none | 10 |
If any of these liquids come into contact with your skin, wash off immediately under cold water. It is recommended that you wear suitable eye protection.
Temperature affects the rate of an enzyme-catalysed reaction and may be a significant source of error.
You are required to measure the temperature of the room before the start of the investigation and when all the measurements have been recorded.
Proceed as follows:
Read step 1 to step 9.
- Measure the temperature of the room and record this measurement in (b)(iii) on page 5.
- Put of each buffer into separate test-tubes.
- Put of E into each test-tube. Gently shake to mix well.
- Put 1 drop of D into each test-tube. Do not mix.
The reaction will start as soon as H is added to the mixture of E and buffer.
- Put of H into one of the test-tubes.
- Immediately start timing.
- Using the strip of graph paper provided, measure the height of the foam as decided in (a)(ii), at each of your sampling times as stated in (a)(i), until you have recorded the final measurement at 3 minutes. Record your measurements in (b)(i).
If the foam flows over the top of the test-tube, stop timing. Record the measurement of the height of the foam to the top of the test-tube and add an asterisk (*) to show that the foam has flowed over.
- Repeat step 5 to step 7 with each of the other buffer solutions.
- Measure the temperature of the room now that all the measurements have been recorded. Record the temperature in (b)(iii).
Record your results for the height of foam (raw results) in an appropriate table.
Using your raw results for pH 5:
- State the highest height of foam ........................ mm.
- State the first time when this height was reached ........................ seconds.
Using these measurements, calculate the rate of production of oxygen, as millimetres per second ().
You may lose marks if you do not show your working.
rate of oxygen production = ______
State the temperature of the room before the start of the investigation.
______
State the temperature of the room after all the measurements have been recorded.
______
State the difference between this temperature and the temperature of the room at the start of the investigation.
difference = ______
Explain whether temperature is a significant source of error in this investigation.
You are provided with a sample U which contains a buffer.
You are now required to estimate the pH of the buffer in U using the same procedure.
- Repeat step 2 to step 7 using U and record your results in (b)(iv).
Record the maximum height of foam using U.
maximum height = ______
Using the result in (b)(iv) and the results in (b)(i) estimate the pH of U.
pH = ______
This procedure investigated the effect of pH on the activity of the enzymes in a plant extract solution.
To modify this procedure for investigating a different variable, the pH should be kept the same.
Think about how you could modify this procedure to investigate the effect of substrate concentration, using 6% hydrogen peroxide solution, on the activity of enzymes in the plant extract solution.
Describe how the independent variable, substrate concentration, would be changed in an investigation.
Describe how the dependent variable could be measured more accurately than measuring the height of foam. You may use a labelled diagram in the space provided.
space for diagram
A student investigated the effect of temperature on the rate of enzyme activity in a plant extract solution. All the other variables were standardised.
The results are shown in Table 1.1.
Table 1.1
| temperature / | rate of enzyme activity / arbitrary units (au) |
|---|---|
| 5 | 6.5 |
| 16 | 39.0 |
| 27 | 31.0 |
| 38 | 9.5 |
| 49 | 1.0 |
Use a sharp pencil for drawing graphs.
Plot a graph of the data shown in Table 1.1.

Use your knowledge of enzymes and the data to explain the effect of temperature on the enzyme activity in the plant extract solution.
The rest of this paper
1 more questions- Q2Use of the Light Microscope · Analysis, Conclusions and Evaluation · Presentation of Data and Observations18M