Biology 9700/31 — October/November 2017
Cambridge AS Level · Advanced Practical Skills · worked solutions for every part, with the mark scheme
Topics Presentation of Data and Observations · Analysis, Conclusions and Evaluation · Manipulation, Measurement and Observation · Use of the Light Microscope
You are required to estimate the water potential of potato tissue.
When a piece of potato is put into a sucrose solution, as shown in Fig. 1.1, water will move by osmosis into and out of the potato cells. The net direction of movement of water depends on the difference in water potential between the potato cells and the sucrose solution.
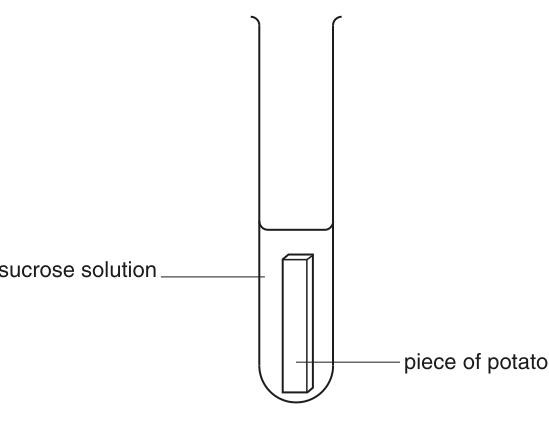
Fig. 1.1
Complete the sentences by using two of the following words.
If the potato cells ..................... water then the sucrose solution will become more dilute.
This will change the sucrose solution so that it becomes ..................... dense.
A piece of potato is left in a sucrose solution for 15 minutes, to allow time for osmosis to take place.
The concentration of the sucrose solution after 15 minutes may be different from the original concentration.
After 15 minutes a blue dye is added to the sucrose solution to make a blue solution. The blue dye does not affect the concentration of the sucrose solution.
A small volume of this blue solution is then released into a known concentration of sucrose solution as shown in Fig. 1.2.
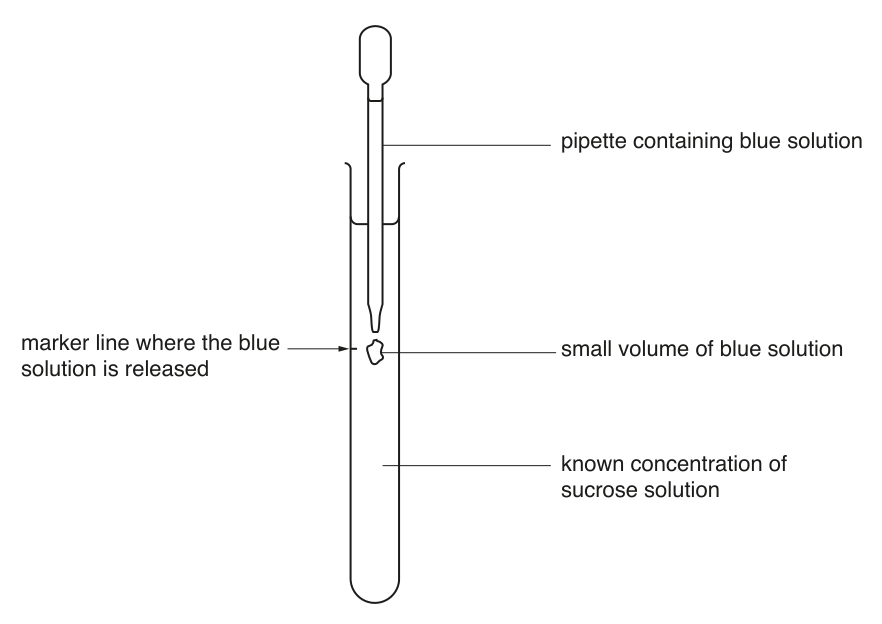
Fig. 1.2
The pipette is removed immediately after the blue solution is released.
The blue solution may move up, move down or remain at the same level depending on the difference in the concentration between the blue solution and the known concentration of sucrose solution.
Think about how the blue solution will move in the known concentration of sucrose in the test-tubes shown in Fig. 1.3.
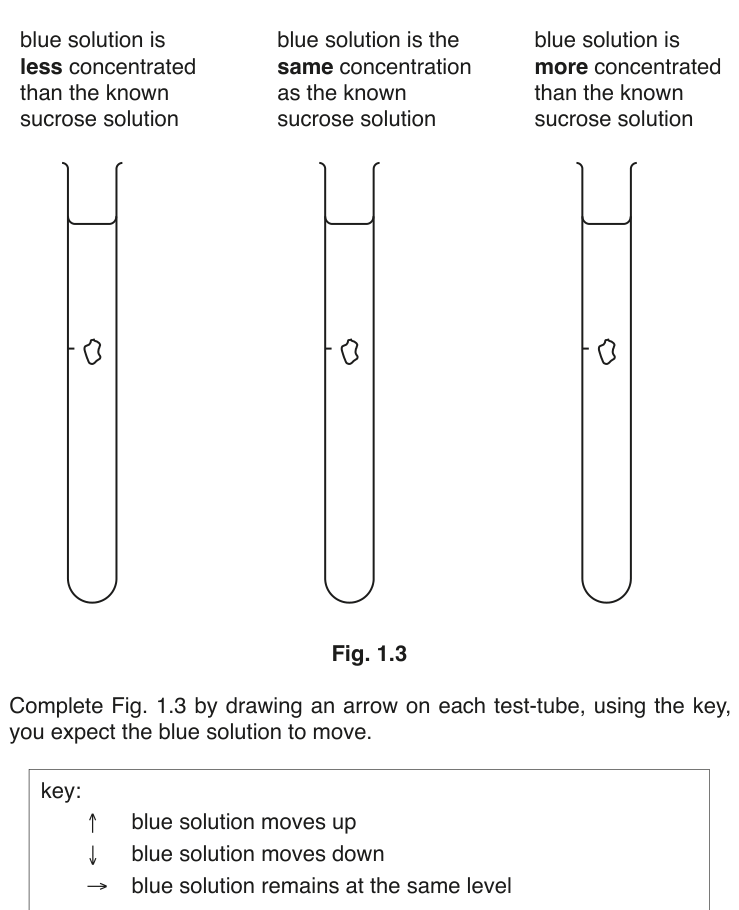
Fig. 1.3
Complete Fig. 1.3 by drawing an arrow on each test-tube, using the key, to show how you expect the blue solution to move.
key:
- blue solution moves up
- blue solution moves down
- blue solution remains at the same level
You are required to investigate osmosis in potato tissue so that you can estimate the water potential of the potato cells.
You are provided with:
| labelled | contents | hazard | volume / |
|---|---|---|---|
| S | sucrose solution | none | 200 |
| W | distilled water | none | 200 |
| labelled | details |
|---|---|
| P | 7 pieces of potato, cross sectional area of variable length |
You are required to make simple dilutions of the sucrose solution, S, which reduces the concentration between each dilution.
You will need to prepare of each concentration.
Decide which concentrations of sucrose solution to prepare using simple dilutions of S.
Complete Table 1.1 to show how you will prepare the other concentrations.
Table 1.1
| final concentration of sucrose solution / | volume of S / | volume of distilled water, W / |
|---|---|---|
| 1.00 | 40 | 0 |
Read step 1 to step 11 before proceeding.
Proceed as follows:
- Prepare all the concentrations of sucrose solution as shown in Table 1.1 in the beakers provided.
- Measure from the bottom of each large test-tube and put a mark, as shown in Fig. 1.4.
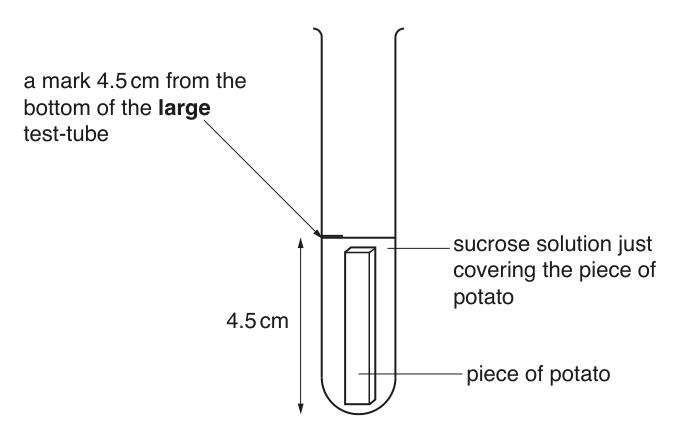
Fig. 1.4
Decide on the length of each piece of potato you will use, so that the volume of sucrose solution just covers the piece of potato, as shown in Fig. 1.4.
State the length of the pieces of potato you will use.
length = ______
- Cut enough pieces of potato to put into the sucrose concentrations that you prepared in step 1.
- Put the pieces of potato on a paper towel to remove any excess fluid.
- Put one piece of potato into each of the large test-tubes from step 2.
- Put sucrose solution, S, into a large test-tube up to the mark made in step 2.
- Repeat step 6 with each of the other concentrations of sucrose solution.
- Start timing and leave for 15 minutes.
While you are waiting for 15 minutes continue with step 9 to step 11 and continue with the other questions.
- Measure from the top of each of the small test-tubes and put a mark, as shown in Fig. 1.5.
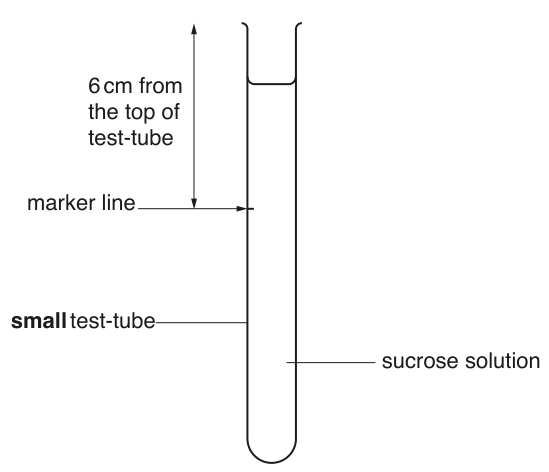
Fig. 1.5
- Put of sucrose solution, S, into one of the small test-tubes from step 9.
- Repeat step 10 with each of the other sucrose solutions that you prepared in step 1.
You are provided with:
| labelled | contents | hazard | volume / |
|---|---|---|---|
| M | methylene blue solution | none | 15 |
- After leaving the pieces of potato for 15 minutes, put a drop of M into the large test-tube containing sucrose solution, S, and a piece of potato.
- Gently shake the large test-tube to mix M with the sucrose solution.
- Repeat step 12 and step 13 with each of the other concentrations of sucrose solution.
Read step 15 to step 19 before proceeding.
- Use a pipette to remove a sample of the blue solution from the large test-tube containing sucrose solution, S.
You will now use the small test-tubes as in Fig. 1.5.
- Put the end of the pipette into the small test-tube containing concentration of sucrose solution, S. This should be level with the marker line on the test-tube as shown in Fig. 1.2 on page 3.
- Release a small volume of the blue solution, then immediately remove the pipette from the test-tube.
It is possible to repeat step 17 without having to replace this sucrose solution. - Immediately observe the direction and the speed of movement of the blue solution.
You are not required to measure the speed.
Record these observations in (b)(iii). - Repeat step 15 to step 18 using the other concentrations of sucrose solution.
Make sure that the small volume of the blue solution from the large test-tube is put into the small test-tube labelled with the same concentration.
Record your observations of direction and speed of movement in an appropriate table.
Using your results in (b)(iii) estimate the concentration of sucrose solution with a water potential equal to the water potential of the potato tissue.
Identify one significant source of error in this investigation.
Describe how you would use this procedure to produce a more accurate estimate of the concentration of sucrose solution with a water potential equal to the water potential of the potato tissue.
Describe the movement of water when the concentration of the sucrose solution surrounding the piece of potato has a water potential equal to the water potential in the potato tissue.
Using the same procedure a student observed that the blue solution stayed in the same position (did not move up or down) in a concentration of sucrose solution of .
Fig. 1.6 shows the relationship between the concentration of sucrose solution and the water potential of the sucrose solution.
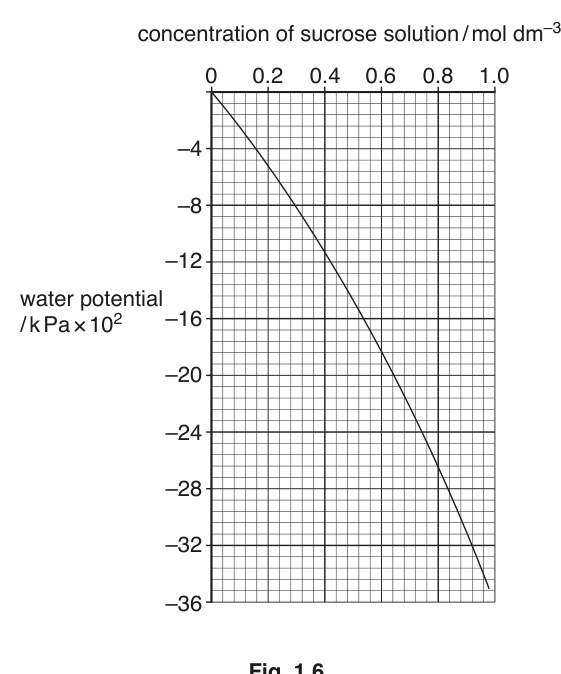
Fig. 1.6
Use the graph in Fig. 1.6 to estimate the water potential of a sucrose solution. Show on the graph how you estimated the water potential.
water potential = ______
The rest of this paper
1 more questions- Q2Use of the Light Microscope · Presentation of Data and Observations20M