Biology 9700/35 — May/June 2017
Cambridge AS Level · Advanced Practical Skills · worked solutions for every part, with the mark scheme
Topics Presentation of Data and Observations · Analysis, Conclusions and Evaluation · Manipulation, Measurement and Observation · Use of the Light Microscope
The enzyme amylase, E, hydrolyses (breaks down) starch, to a reducing sugar.
You are required to investigate how much reducing sugar diffuses from a mixture of starch and amylase through a partially permeable wall of Visking tubing.
You are provided with:
| labelled | contents | hazard | volume / |
|---|---|---|---|
| E | 2.0% amylase solution | irritant | 20 |
| S | 1.0% starch suspension | none | 20 |
| W | distilled water | none | 150 |
| labelled | contents | hazard | details | quantity |
|---|---|---|---|---|
| V | Visking tubing | none | 15 cm length in distilled water | 1 |
If E comes into contact with your skin, wash it off immediately under cold water.
It is recommended that you wear suitable eye protection.
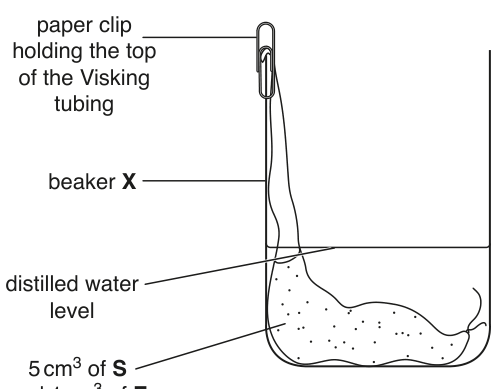
Fig. 1.1 shows the apparatus you will set up for this investigation.
Proceed as follows:
- Tie a knot in the Visking tubing as close as possible to one end, so that it seals the end.
- To open the other end, wet the Visking tubing and rub the tubing gently between your fingers.
- Put of S into the Visking tubing.
- Put of E into the Visking tubing.
- Rinse the outside of the Visking tubing by dipping it into the water in the container labelled V.
Look carefully at Fig. 1.1. This has been set up so that the volume of water is as small as possible to cover the Visking tubing. The part of the Visking tubing containing the mixture is on the bottom of the beaker.
- Put the Visking tubing into the beaker, labelled X, as shown in Fig. 1.1.
- Put W into the beaker up to the level shown on Fig. 1.1 using a syringe so that you can measure the volume of W.
State the volume of W needed to reach the water level as shown in Fig. 1.1.
volume of W = ______
- Leave the apparatus for 20 minutes.
While you are waiting, continue with Question 1.
- After 20 minutes, remove the Visking tubing and put it into the container labelled ‘For waste’.
You are required to:
- prepare a serial dilution of the 1.0% reducing sugar solution, R
- carry out the Benedict’s test for the known concentrations of reducing sugar and the water surrounding the Visking tubing
- use the results to estimate the concentration of reducing sugar in the water surrounding the Visking tubing.
You are provided with:
| labelled | contents | hazard | volume / |
|---|---|---|---|
| W | distilled water | none | 150 |
| R | 1.0% reducing sugar solution | none | 25 |
| Benedict’s | Benedict’s solution | irritant | 30 |
It is recommended that you wear suitable eye protection.
If Benedict’s comes into contact with your skin, wash it off immediately with cold water.
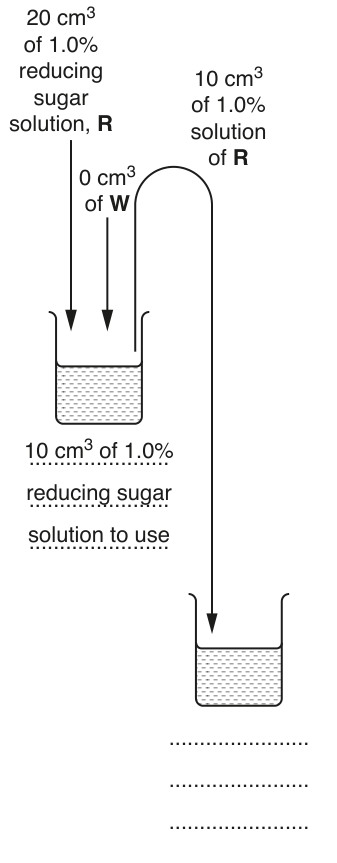
You are required to make a serial dilution of the 1.0% reducing sugar solution, R, which reduces the concentration of R by half between each successive dilution.
You will need to prepare of each concentration.
Fig. 1.2 shows the first two beakers you will use to make your serial dilution.
Complete Fig. 1.2 by drawing as many extra beakers as you need for your serial dilution.
For each beaker:
- state, under the beaker, the concentration and the volume of the solution available for use in this investigation
- use one arrow, with a label above the beaker, to show the concentration and volume of the reducing sugar solution added to prepare the concentration
- use another arrow, with a label above the beaker, to show the volume of W added to prepare the concentration.
- Set up a boiling water-bath ready for step 12.
- Prepare the concentrations of reducing sugar solution, as decided in (a)(ii), in the containers provided.
- Carry out the Benedict’s test on each of the concentrations of reducing sugar solution and record your results in (a)(iii).
You will need to use of each of the concentrations of reducing sugar solution with of Benedict’s solution.
- Test each solution separately and record in (a)(iii) the time taken for the first appearance of any colour change. If there is no colour change after 180 seconds record as ‘more than 180’.
Prepare the space below and record your results.
Describe one significant source of error when carrying out steps 12 and 13.
- Carry out the Benedict’s test on a sample taken from beaker X (sample X) and record the time taken for the first colour change to appear.
State the time taken for the first colour change for sample X.
time taken = ______
Complete Fig. 1.3 to show:
- the positions of each of the percentage concentrations of reducing sugar solution
- an estimate of the concentration of reducing sugar in the sample X, using a letter X.

Describe how you could use this procedure to produce a more accurate estimate of the concentration of reducing sugar in the sample X than the one given in (a)(vi).
Do not include the use of a colorimeter in your answer.
A scientist investigated the effect of temperature (independent variable) on the activity of the enzyme in the Visking tubing.
All other variables were kept constant.
The quantity of reducing sugar diffusing through the wall of the Visking tubing was measured by a dye in the surrounding solution. The dye reacted with the reducing sugar. The more reducing sugar present the more intense the colour.
A colorimeter was used to measure the absorbance of light by the coloured solution. The absorbance of light by pure water is 0.00 arbitrary units.
The results are shown in Table 1.1.
Table 1.1
| temperature / °C | absorbance of light by the coloured solution / arbitrary units |
|---|---|
| 30 | 0.90 |
| 41 | 1.46 |
| 49 | 1.58 |
| 59 | 1.10 |
| 70 | 0.65 |
Plot a graph of the data shown in Table 1.1.

Explain the difference in the absorbance of light between 49°C and 70°C.
The rest of this paper
1 more questions- Q2Use of the Light Microscope · Presentation of Data and Observations · Analysis, Conclusions and Evaluation17M