Biology 9700/34 — May/June 2017
Cambridge AS Level · Advanced Practical Skills · worked solutions for every part, with the mark scheme
Topics Presentation of Data and Observations · Analysis, Conclusions and Evaluation · Manipulation, Measurement and Observation · Use of the Light Microscope
Some plants contain types of molecules which can be useful, for example in an industrial process.
To find the best source of one of these molecules may require estimating the concentration of a useful molecule in plant extracts.
You are required to estimate the concentration of molecule M in a sample of plant extract, U.
Molecule M changes the colour of potassium manganate(VII) solution, K, from pink to colourless. The rate of the colour change depends on the concentration of molecule M in the sample. The greater the concentration of molecule M, the faster the end-point is reached.
You are required to:
- prepare a simple dilution of a 10% solution of molecule M, labelled 10M
- record the time taken for the pink colour of K to change to the end-point for each of the concentrations of molecule M.
You are provided with:
| labelled | contents | hazard | volume/ |
|---|---|---|---|
| 10M | 10% solution of molecule M | none | 100 |
| W | distilled water | none | 100 |
| U | unknown concentration of molecule M in a plant extract | none | 40 |
| A | sulfuric acid | harmful irritant | 20 |
| K | potassium manganate(VII) solution | none | 20 |
If A comes into contact with your skin, wash it off immediately under cold water. It is recommended that you wear suitable eye protection.
You are required to make simple dilutions of the 10M solution which reduce the concentration between each successive dilution.
You will need to prepare of each concentration.
Table 1.1 shows how to make up one of the concentrations of molecule M you will use.
Decide which concentrations of molecule M to prepare using simple dilutions of the 10M solution.
Complete Table 1.1 to show how you will prepare the other concentrations.
Table 1.1
| volume of 10M / | volume of distilled water, W / | percentage concentration of molecule M |
|---|---|---|
| 10 | 0 | 10 |
Proceed as follows:
- Prepare the concentrations of molecule M as shown in Table 1.1.
- Put of A into a test-tube.
- Put of K into the same test-tube and mix well.
- Put of 10M into the same test-tube and mix well. Start timing.
- Record the time taken to reach the end-point in (a)(ii).
If the end-point is not reached in 4 minutes (240 seconds) record ‘more than 240’ and record the colour of the solution. - Repeat step 2 to step 5 for each of the concentrations of molecule M prepared in step 1.
Prepare the space below and record your results for the known concentrations of molecule M.
You are now required to estimate the concentration of molecule M in a sample of plant extract, U.
- Repeat step 2 to step 4 with U. Record the time taken to reach the end-point in (a)(iii).
State the time taken to reach the end-point for sample U. ______
Use your results in (a)(ii) and (a)(iii) to estimate the concentration of molecule M in sample U.
concentration = ______
Describe how you could use this procedure to produce a more accurate estimate of the concentration of molecule M in the sample of plant extract U than the one given in (a)(iv).
A student suggested that molecule M might act as an antibiotic.
In order to test this suggestion the student carried out the following investigation:
- bacteria were spread over the surface of a strip of agar gel containing nutrients
- bacteria were allowed to grow, shown by the shaded area in Fig. 1.1
- small drops () of different concentrations of molecule M were put onto the surface of the agar gel strip
- after 24 hours, the inhibition area (where the bacteria were no longer observed) was measured for each concentration of molecule M.
Fig. 1.1 shows a diagram of the strip of agar gel after 24 hours. This is not to scale.
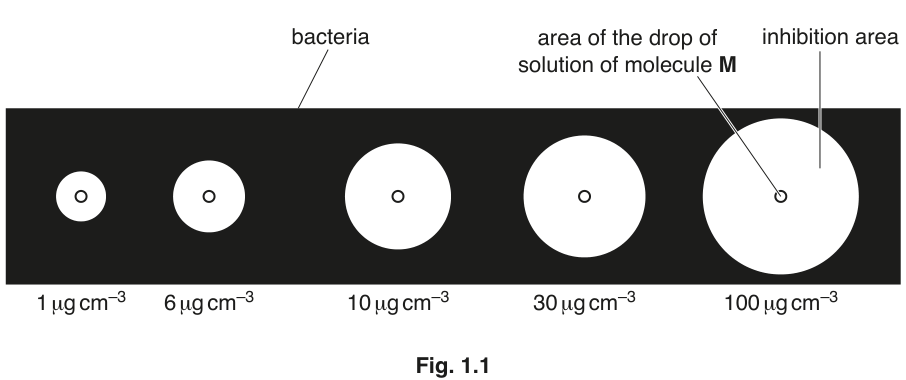
Fig. 1.1
The results are shown in Table 1.2.
Table 1.2
| concentration of solution of molecule M / | inhibition area / |
|---|---|
| 0 | 0 |
| 1 | 30 |
| 6 | 50 |
| 10 | 70 |
| 30 | 106 |
| 100 | 120 |
Use a sharp pencil for graphs.
Plot a graph of the data shown in Table 1.2.
Use your graph to estimate the inhibition area for a concentration of molecule M of .
inhibition area = ______
Explain how the data support the statement that molecule M might act as an antibiotic.
Suggest how molecule M may act as an antibiotic.
The rest of this paper
1 more questions- Q2Use of the Light Microscope · Presentation of Data and Observations · Analysis, Conclusions and Evaluation19M