Biology 9700/33 — May/June 2017
Cambridge AS Level · Advanced Practical Skills · worked solutions for every part, with the mark scheme
Topics Analysis, Conclusions and Evaluation · Manipulation, Measurement and Observation · Presentation of Data and Observations · Use of the Light Microscope
When a person eats food containing starch, the enzyme amylase is released to hydrolyse (break down) the starch into reducing sugar.
As the food passes from the mouth to the stomach and then to the small intestine, amylase is released in the mouth and in the small intestine but is not released in the stomach.
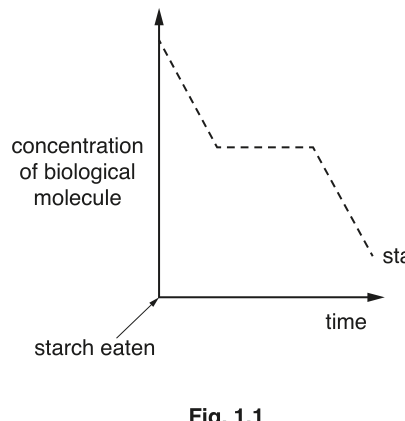
Fig. 1.1 shows a sketch of the changes in the concentration of the biological molecule, starch, as it enters the mouth and passes to the small intestine.
Sketch another line on the graph to show the changes in the concentration of reducing sugar as the starch enters the mouth and passes to the small intestine.
You are provided with four samples, S1, S2, S3 and S4.
One of these samples contains starch suspension which a person is about to eat.
The other three represent samples taken from:
- the mouth 2 minutes after being eaten
- the stomach 10 minutes after being eaten
- the small intestine 2 hours (120 minutes) after being eaten.
You are required to identify the samples S1, S2, S3 and S4 by testing the samples for starch and for reducing sugar, using only the apparatus and reagents provided.
You are provided with:
| labelled | contents | hazard | volume / |
|---|---|---|---|
| Benedict's | Benedict's solution | irritant | 50 |
| iodine | iodine solution | stains | 30 |
If Benedict's or iodine come into contact with your skin, wash off immediately under cold water.
It is recommended that you wear suitable eye protection.
You will need to think about how you will carry out the tests so that you can determine the relative concentrations of the starch and reducing sugar.
Decide how you will test each solution to show the relative concentration of starch present.
State the reagent you will use ______
Describe how you will carry out the test for starch.
State what you will record.
Describe how you will determine which solution has the highest concentration of starch present.
Decide how you will test each solution to show the relative concentration of reducing sugar present. You may measure the time taken to the first colour change.
State the reagent you will use ______
When testing for reducing sugar the volume of the reagent should be equal to or more than the volume of the sample.
Describe how you will carry out the test to measure the reducing sugar concentration.
State how you will determine which solution has the highest concentration of reducing sugar present.
Carry out the test for starch and the test for reducing sugar on each of the solutions, S1, S2, S3 and S4.
If the time taken to the first colour change for the reducing sugar test is longer than 180 seconds then record 'more than 180'.
Prepare the space below and record your results.
Using your results in (b)(iii) and using the information on page 2, complete Table 1.1 to show the identification of the samples, S1, S2, S3 and S4.
Table 1.1
| sample | identification of sample |
|---|---|
| contains starch suspension which a person is about to eat | |
| from the mouth 2 minutes after being eaten | |
| from the stomach 10 minutes after being eaten | |
| from the small intestine 2 hours (120 minutes) after being eaten |
Explain how you decided which sample was taken from the small intestine.
A student wanted to obtain a quantitative estimate of the reducing sugar concentration in a sample.
Describe how the student could obtain a quantitative estimate of the concentration of reducing sugar in a sample.
The rest of this paper
1 more questions- Q2Use of the Light Microscope · Manipulation, Measurement and Observation · Presentation of Data and Observations · Analysis, Conclusions and Evaluation22M