Biology 9700/33 — February/March 2017
Cambridge AS Level · Advanced Practical Skills · worked solutions for every part, with the mark scheme
Topics Presentation of Data and Observations · Analysis, Conclusions and Evaluation · Manipulation, Measurement and Observation · Use of the Light Microscope
Enzyme E hydrolyses (breaks down) starch to reducing sugar.
You are required to investigate the effect of temperature (independent variable) on the activity of E by recording the time taken for the starch to be hydrolysed (dependent variable).
You will investigate the hydrolysis of starch:
- at room temperature
- at other temperatures, starting at to a maximum of .
State the temperatures, other than room temperature, that you will investigate.
You are provided with:
| labelled | contents | hazard | volume / |
|---|---|---|---|
| E | 2.0% enzyme E solution | harmful | 20 |
| S | starch solution | none | 50 |
| iodine | iodine solution | none | 15 |
You are advised to wear suitable eye protection.
Iodine solution is a stain.
If E or iodine comes into contact with your skin, wash it off immediately under cold water.
The enzyme and starch solutions are mixed together and then a sample of the mixture is removed every 15 seconds and tested for starch.
The end-point of the hydrolysis of the starch is when a sample does not change the colour of iodine solution, showing that all of the starch has been hydrolysed.
Fig. 1.1 shows a spotting tile with drops of iodine solution that have been labelled with the time, in seconds, that they will be used to test a sample.
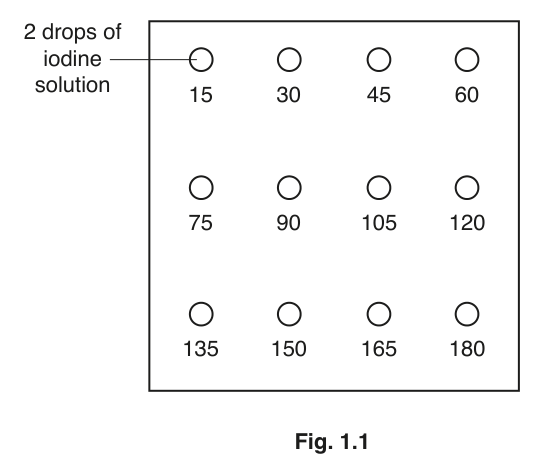
Proceed as follows:
- Set up a water-bath at room temperature.
- Set up a spotting tile, as shown in Fig. 1.1.
- Measure the temperature of the water-bath and record its temperature in Table 1.1, in (a)(ii).
- Label one test-tube E and label another test-tube S.
- Put of E into the test-tube labelled E.
- Put of S into the test-tube labelled S.
- Put both of these test-tubes into the water-bath. Leave for one minute.
- After one minute, remove both of the test-tubes and put them into a test-tube rack.
- Heat the water-bath to , which is the next temperature that you will test. Continue with step 10 while the water is heating.
Read step 10 to step 13 and (a)(ii) before proceeding.
Note: as soon as the starch is added to the enzyme the reaction will start.
-
Put the starch solution from test-tube S into the enzyme solution in test-tube E and mix. Start timing.
-
After 15 seconds, use the glass rod to remove a sample of the mixture and stir it into the iodine solution labelled '15' on the spotting tile, as shown in Fig. 1.1. Wipe the end of the glass rod with a paper towel.
Continue removing and testing samples every 15 seconds until the colour of the iodine solution does not change, up to a maximum of 180 seconds. Each time, use the next labelled iodine solution on the spotting tile and wipe the end of the glass rod clean between tests.
-
Record the colour of the iodine solution for each test in Table 1.1, in (a)(ii). These are the raw results.
-
Use a paper towel to wipe the spotting tile clean.
-
Repeat step 2 to step 13 for all of the temperatures you stated in (a)(i), each time heating the water-bath in step 9 to the next temperature that you are going to use.
Record your raw results by completing Table 1.1, using the letters stated below for the colours.
You will observe a range of colours depending on the concentration of starch in the sample.
You will see some of the following colours and should record the colours by using these letters.
BB blue/black
DP dark purple
P purple
PP pale purple
DB dark brown
B brown
PB pale brown
Y yellow/orange (colour of iodine solution at start)
Table 1.1
| colour of iodine solution | ||||||||||||
|---|---|---|---|---|---|---|---|---|---|---|---|---|
| time / s | 15 | 30 | 45 | 60 | 75 | 90 | 105 | 120 | 135 | 150 | 165 | 180 |
| temperature / |
Prepare the space below and, using your raw results from Table 1.1 in (a)(ii), record the time taken for enzyme E to hydrolyse all of the starch at each temperature.
Record 'more than 180' if there is still starch present at 180 seconds.
Describe two significant sources of error in this investigation.
A student using the same enzyme concluded that the source of enzyme E was not from humans.
Explain how your results support the student's conclusion.
This procedure investigated the effect of temperature on the activity of enzyme E, using the time taken to hydrolyse starch.
To modify this procedure for investigating another variable, temperature (the previous independent variable) would need to be standardised.
Describe how the temperature could be standardised.
Think about how you could modify this procedure to investigate the effect of enzyme concentration (the new independent variable) on the time taken to hydrolyse the starch.
Describe the modifications needed to investigate the effect of enzyme concentration.
A student investigated the effect of temperature on the activity of an enzyme extracted from an organism living in very low temperatures.
All the variables were standardised at each temperature.
The student's results are shown in Table 1.2.
Table 1.2
| temperature / | activity of enzyme / arbitrary units |
|---|---|
| 4.0 | 19.00 |
| 7.0 | 17.50 |
| 10.5 | 14.75 |
| 12.0 | 3.25 |
| 19.5 | 0.75 |
Plot a graph of the data shown in Table 1.2.

Describe the effect of temperature on the activity of this enzyme.
The rest of this paper
1 more questions- Q2Use of the Light Microscope · Presentation of Data and Observations · Analysis, Conclusions and Evaluation19M