Biology 9700/36 — October/November 2016
Cambridge AS Level · Advanced Practical Skills · worked solutions for every part, with the mark scheme
Topics Manipulation, Measurement and Observation · Presentation of Data and Observations · Analysis, Conclusions and Evaluation · Use of the Light Microscope
Before you proceed, read carefully through the whole of Question 1 and Question 2.
Plan the use of the two hours to make sure that you finish all the work that you would like to do.
If you have enough time, think about how you can improve the accuracy of your results, for example by obtaining and recording one or more additional measurements.
You will gain marks for recording your results according to the instructions.
Antibiotics are tested by observing how effective the antibiotics are at killing bacteria or preventing their growth.
Agar blocks can be used to set up a model for antibiotic testing.
In this model an acid represents the antibiotic solution and the blue stain in the agar block represents the bacteria.
You will investigate the effect of the antibiotic solution (independent variable) on ‘killing the bacteria’, shown by the blue colour changing to yellow as the end-point.
You are required to:
- prepare different concentrations of the antibiotic solution, A, using serial dilution
- record the time taken to reach the end-point (yellow) for each of the concentrations of A
- record the time taken to reach the end-point for an unknown concentration of antibiotic solution, U
- use the results to estimate the concentration of antibiotic in U.
You are provided with:
| labelled | contents | hazard | volume/ |
|---|---|---|---|
| A | 1% acid (antibiotic solution) | irritant | 50 |
| W | distilled water | none | 100 |
| U | unknown concentration of acid (antibiotic solution) | irritant | 30 |
| B | agar block containing a blue stain | none | — |
You are advised to wear suitable eye protection, especially when using the antibiotic solution, A. If A comes into contact with your skin, wash off with cold water.
When carrying out a practical procedure the hazards of using the solutions need to be considered. Then the level of risk needs to be assessed as low or medium or high.
State the hazard with the greatest level of risk when using the solutions then state the level of risk of the procedure: low or medium or high.
hazard = ______
level of risk = ______
You are required to make a serial dilution of the 1% antibiotic solution, A, which reduces the concentration by half between each successive dilution.
You will need to prepare of each concentration.
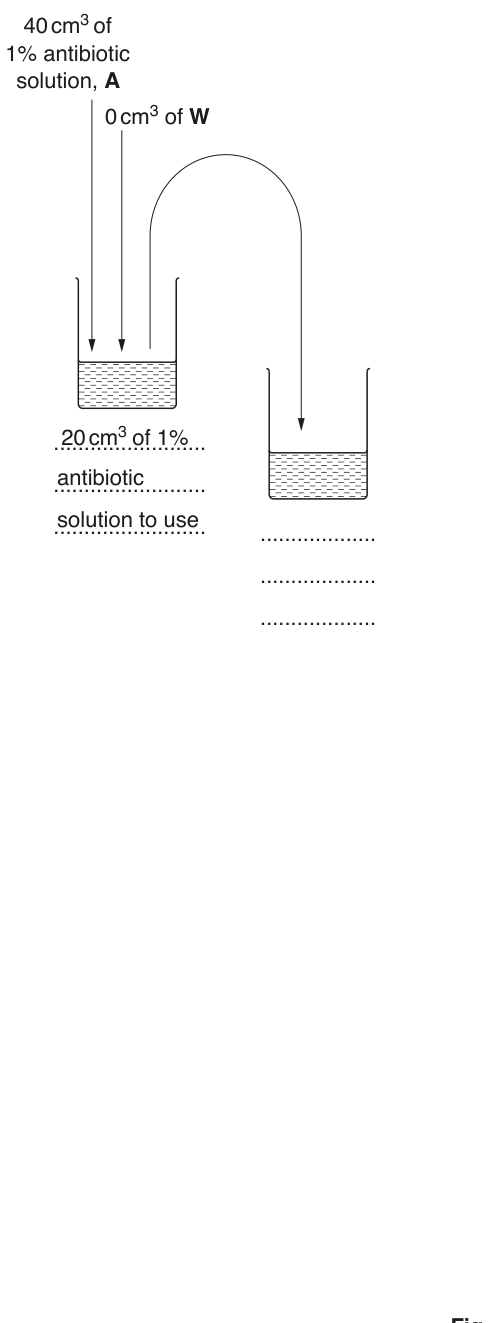
Fig. 1.1 shows the first two beakers you will use to make your serial dilution.
Complete Fig. 1.1 by drawing as many extra beakers as you need for your serial dilution.
For each beaker:
- state, under the beaker, the volume and concentration of the antibiotic solution available for use in the investigation
- use one arrow, with a label above the beaker, to show the volume and concentration of antibiotic solution added to prepare the concentration
- use another arrow, with a label above the beaker, to show the volume of W added to prepare the concentration.
Proceed as follows:
- Prepare the concentrations of antibiotic solution as decided in (b)(i) and as shown in Fig. 1.1.
- Adjust the volumes so that there is of antibiotic solution in each beaker.
- Label a beaker as U and put of U into this beaker.
You will need to cut the agar block, B, into smaller pieces as shown in Fig. 1.2.
To avoid staining your skin, try not to touch the agar. You may use the blunt forceps and paper towels to handle the agar.
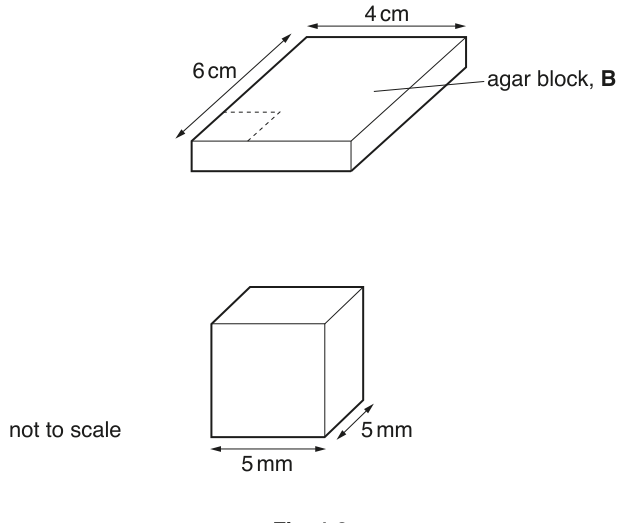
- Place the agar block, B, onto a white tile and cut into identical pieces, each as shown in Fig. 1.2. You do not need to adjust the depth.
- Put one piece of agar into each beaker containing the concentrations prepared in step 1 and start timing.
- Gently stir the contents of each beaker at intervals.
- Record in (b)(ii) the time taken for the pieces of agar to reach the end-point.
Note that the colour of the agar may change from blue to green and then to yellow.
If any piece of agar has not changed to yellow after , stop timing and record as ‘more than 240’.
Note that the same concentrations of antibiotic solution can be used again.
Prepare the space below and record your results for the known concentrations of antibiotic solution.
- Put one piece of agar into the beaker labelled U and start timing.
Record the time taken for the piece of agar in U to change to reach the end-point.
time taken = ______
Use your results in (b)(ii) and (b)(iii) to estimate the concentration of antibiotic solution in U.
Identify one significant source of error in this investigation.
This procedure investigated the effect of the concentration of the antibiotic solution (the independent variable) on its diffusion into stained agar blocks.
To modify this procedure for investigating the effect of another independent variable, the concentration of antibiotic solution would need to be standardised.
Describe how the concentration of antibiotic solution could be standardised.
Describe how you would modify this procedure to investigate the effect of the independent variable, temperature, on diffusion into stained agar blocks.
In your investigation the antibiotic solution entered the agar blocks by diffusion.
In animals, some substances cross cell surface membranes either by simple diffusion or by facilitated diffusion.
A student investigated the rate of glucose uptake into animal cells.
These animal cells were placed into different concentrations of glucose and the rate of glucose uptake into the cells was measured.
All the other variables were standardised.
The results are shown in Table 1.1.
Table 1.1
| external concentration of glucose / | rate of glucose uptake by cells / |
|---|---|
| 0 | 0 |
| 1 | 205 |
| 3 | 320 |
| 5 | 395 |
| 10 | 450 |
| 20 | 455 |
You are required to use a sharp pencil for graphs.
Plot a graph of the data shown in Table 1.1.

Use your graph to estimate the rate of glucose uptake by cells for an external concentration of glucose of .
Show on your graph how you estimated the rate of glucose uptake.
rate of glucose uptake = ______
Using the graph, explain how the results of the investigation support the idea that glucose enters cells by facilitated diffusion.
The rest of this paper
1 more questions- Q2Use of the Light Microscope · Manipulation, Measurement and Observation · Analysis, Conclusions and Evaluation · Presentation of Data and Observations18M