Biology 9700/35 — October/November 2016
Cambridge AS Level · Advanced Practical Skills · worked solutions for every part, with the mark scheme
Topics Presentation of Data and Observations · Analysis, Conclusions and Evaluation · Manipulation, Measurement and Observation · Use of the Light Microscope
When plant tissue is soaked in methylene blue solution, the stain enters the tissue and colours it blue.
When the stained plant tissue is placed into ethanol the stain moves out of the cells and is released.
You will investigate the effect of concentration of ethanol (independent variable) on the release of methylene blue solution from pieces of stained plant tissue.
You are required to:
- prepare different concentrations of ethanol, E, using simple dilution
- record the colours for the known concentrations of ethanol
- record the colour for an unknown concentration of ethanol, U
- use the results to estimate the concentration of ethanol in U.
You are provided with:
| labelled | contents | hazard | volume / |
|---|---|---|---|
| E | 1.0% ethanol | flammable | 40 |
| W | distilled water | none | 250 |
| U | unknown concentration of ethanol | flammable | 15 |
| labelled | contents | hazard | quantity |
|---|---|---|---|
| P | plant tissue stained with methylene blue | methylene blue solution will stain your skin | 3 pieces |
You should wear suitable eye protection especially when handling the ethanol.
If any methylene blue solution comes into contact with your skin wash off immediately with water.
You are required to make concentrations of ethanol using simple dilution of the 1.0% ethanol, E, which reduces the concentration by 0.25% between each successive dilution.
You will need to prepare of each concentration.
Table 1.1 shows how to make up two of the concentrations of ethanol you will use.
Complete Table 1.1 by showing as many extra concentrations as you need.
For each concentration state:
- the volume of 1.0% ethanol, E, you will use
- the volume of distilled water, W, you will use
- the resulting percentage concentration of ethanol.
Table 1.1
| volume of 1.0% ethanol, E / | volume of distilled water, W / | percentage concentration of ethanol |
|---|---|---|
| 10.0 | 0.0 | 1.00 |
| 0.0 | 10.0 | 0.00 |
Proceed as follows:
- Prepare the concentrations of ethanol as shown in Table 1.1 in the beakers provided.
- Label the test-tubes with the concentrations of ethanol.
- Put of each dilution of ethanol into the labelled test-tubes.
- Label one test-tube U and put of U into this test-tube.
Always use blunt forceps when handling the plant tissue to avoid contact with the methylene blue solution.
- Remove the pieces of plant tissue from the container labelled P and put them on the white tile. Cut the ends off each piece of plant tissue.
- Cut the plant tissue into equal lengths of approximately .
- Empty the coloured water from P into the container labelled For Waste.
- Put the pieces of plant tissue back into P and cover the pieces with tap water from the container labelled T.
- Change the tap water five times to remove excess methylene blue solution, either using a syringe or by pouring off the water into the container labelled For Waste.
Fig. 1.1 shows how you will set up the apparatus for each concentration of ethanol.
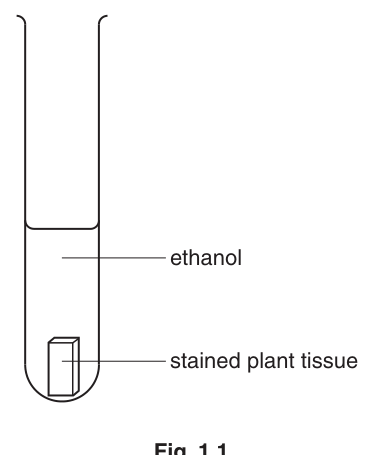
- Remove the pieces of plant tissue from P and put them on a paper towel.
- Put one piece of plant tissue into each test-tube, including U and start timing. Leave for 10 minutes.
While you are waiting continue with Question 1.
After 10 minutes you will need to remove the plant tissue from each test-tube so that the colour of each solution can be recorded.
- After 10 minutes pour the solution and the piece of plant tissue from one of the test-tubes into the beaker labelled R.
- Put the piece of plant tissue into the container labelled For waste. Pour the solution back into the test-tube.
- Rinse beaker R with water from the container labelled For washing.
- Repeat step 12 to step 14 with each of the remaining test-tubes, including U.
- Arrange the test-tubes in the order of intensity of blue colour from lowest intensity to highest intensity.
- Observe the colour in the test-tubes and match the intensity of colour in each test-tube to the key shown in Fig. 1.2.
You may observe the same intensity of colour for more than one test-tube.

- Record your results for the known concentrations of ethanol in (a)(ii) and record the result for U in (a)(iii).
Prepare the space below and record your results for the known concentrations of ethanol.
Record your result for U and use this and your results in (a)(ii) to estimate the concentration of ethanol in U.
result for U = ______
estimated concentration of ethanol in U = ______
Explain how the ethanol affected the release of methylene blue from the plant cells.
This procedure investigated the effect of the concentration of ethanol on the release of methylene blue solution from pieces of stained plant tissue.
To modify this procedure for investigating another variable, the independent variable (concentration of ethanol) would need to be standardised.
Describe how the concentration of ethanol could be standardised.
Consider how you would modify this procedure to investigate the effect of temperature on the release of methylene blue solution from pieces of stained plant tissue.
Describe how this independent variable, temperature, could be investigated.
A student investigated the effect of placing pieces of tissue from a potato in sucrose solutions of different concentrations. At the start, each sample of potato tissue was weighed and the initial mass was recorded. Then each sample of potato tissue was placed into a different concentration of sucrose solution.
After a set time the potato tissue was removed and the final mass of the potato tissue was recorded.
The percentage change in mass for each sample of potato tissue was calculated.
The results of the student’s investigation are shown in Table 1.2. Note: the percentage change in mass is shown to the nearest 0.5%.
Table 1.2
| sucrose concentration / | initial mass / | final mass / | percentage change in mass |
|---|---|---|---|
| 0.0 | 1.84 | 2.15 | 17.0 |
| 0.2 | 1.65 | 1.80 | |
| 0.4 | 1.43 | 1.48 | 3.5 |
| 0.6 | 1.62 | 1.31 | -19.0 |
| 0.8 | 1.43 | 1.08 | -24.5 |
| 1.0 | 1.68 | 1.19 | -29.0 |
Complete Table 1.2 by calculating the percentage change in mass for the sucrose solution.
You are required to use a sharp pencil for graphs.
Plot a graph of the data shown in Table 1.2.

Use your graph to estimate the percentage change in mass of the potato tissue for a sucrose concentration of .
Show on your graph how you estimated the percentage change in mass.
percentage change in mass = ______
The rest of this paper
1 more questions- Q2Use of the Light Microscope · Presentation of Data and Observations · Analysis, Conclusions and Evaluation18M