Biology 9700/33 — October/November 2016
Cambridge AS Level · Advanced Practical Skills · worked solutions for every part, with the mark scheme
Topics Use of the Light Microscope · Manipulation, Measurement and Observation · Presentation of Data and Observations · Analysis, Conclusions and Evaluation
You are provided with one sample of onion epidermis which has been kept in a sucrose solution, U.
You are required to:
- make a slide of the epidermis that has been kept in U
- observe and draw a cell from the epidermis.
Proceed as follows:
- Put one dry and clean microscope slide on a paper towel.
- Put a few drops of U onto the slide.
- Remove a piece of the onion epidermis from U and, using forceps or fingers, peel off the inner epidermis, as shown in Fig. 1.1.
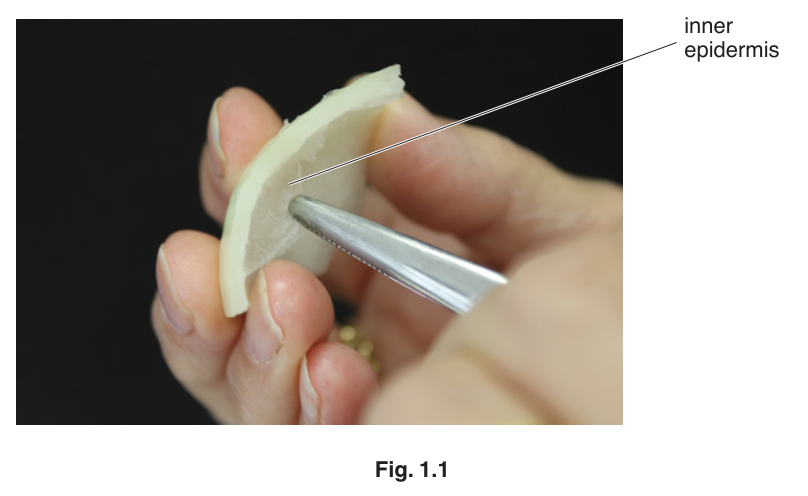
- Cut one piece of the epidermis that will fit under a coverslip. Put the remaining epidermis back into U.
- Place the epidermis on the slide as shown in Fig. 1.2. If the epidermis is folded, you may need to add more drops of U so that it floats and uncurls.
Note: it is important to prevent the epidermis from drying out so add more drops of U if needed.
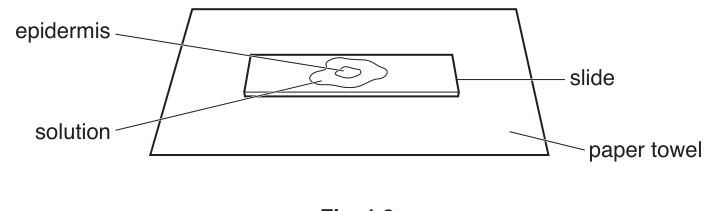
- Cover the epidermis with a coverslip and use a paper towel to remove any excess liquid that is outside the coverslip.
Use the microscope to select an area of cells on the slide which shows the effect of keeping the epidermis in U. Adjust the amount of light entering the microscope to observe cells clearly.
You are required to use a sharp pencil for drawings.
Draw one cell from the slide which shows the effect of the sucrose solution U.
Use one ruled label line and label to identify the cell surface membrane in the cell.
Your answer to (a) shows the effects of the water potential of this concentration of sucrose solution on the onion cells.
To estimate the water potential of the sucrose solution in U, the concentration of sucrose in U needs to be estimated.
You are required to:
- prepare different concentrations of sucrose solution, S, using serial dilution
- carry out the non-reducing sugar test on these concentrations
- carry out the non-reducing sugar test on the solution in U
- use the results to estimate the concentration of sucrose solution in U.
You are provided with:
| labelled | contents | hazard | volume / |
|---|---|---|---|
| S | sucrose solution | none | 50 |
| W | distilled water | none | 100 |
| U | unknown concentration of sucrose solution containing onion epidermis | none | 100 |
| H | dilute hydrochloric acid | none | 50 |
| A | sodium hydrogencarbonate powder | none | — |
| Benedict's | Benedict's solution | none | 25 |
- Set up a water-bath and heat to boiling ready for step 12 and step 16.
You are required to make a serial dilution of the sucrose solution, S, which reduces the concentration by half between each successive dilution.
Decide how many different concentrations you will prepare for your serial dilution.
You will need to prepare of each concentration.
Fig. 1.3 shows the first two beakers you will use to make your serial dilution.
Complete Fig. 1.3 by drawing as many extra beakers as you need for your serial dilution.
For each beaker:
- state, under the beaker, the volume and concentration of the sucrose solution available for use in the investigation
- use one arrow, with a label above the beaker, to show the volume and concentration of sucrose solution added to prepare the concentration
- use another arrow, with a label above the beaker, to show the volume of W added to prepare the concentration.
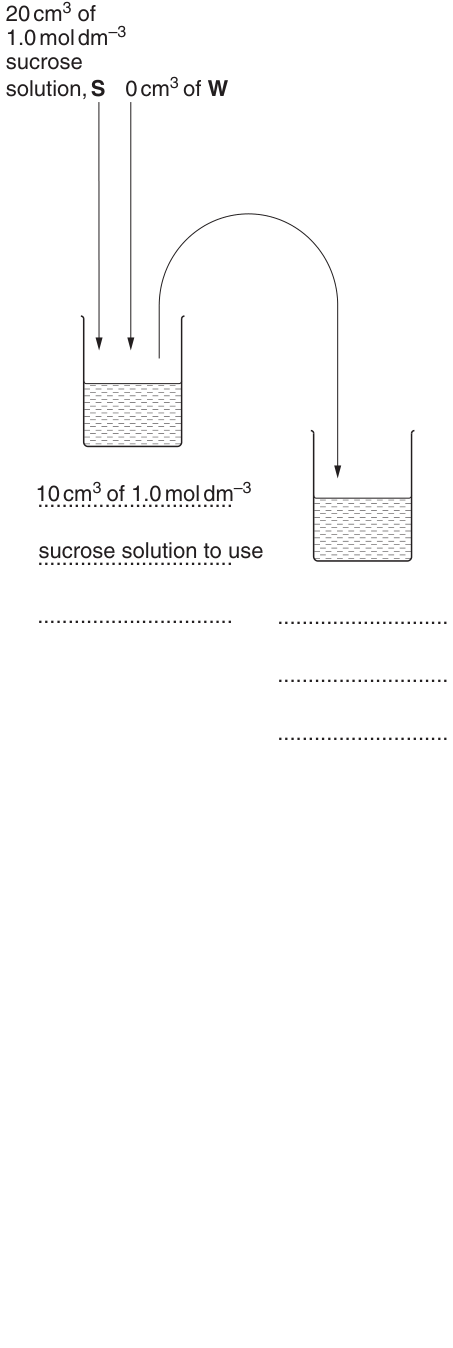
- Prepare the concentrations of sucrose solution as decided in (b)(i) and in Fig. 1.3.
The sucrose concentration can be estimated by using the non-reducing sugar test.
To test for the presence of a non-reducing sugar, any non-reducing sugars must be hydrolysed (broken down) into the reducing sugars.
For example, boiling sucrose with dilute hydrochloric acid hydrolyses sucrose into glucose and fructose, which are both reducing sugars.
The Benedict's test can then be used to show the presence of these reducing sugars.
S and U contain only non-reducing sugars so a reducing sugar test would give a blue colour after boiling. You are required to carry out only the non-reducing sugar test not the reducing sugar test.
- Put of S ( sucrose solution) into a labelled test-tube.
- Repeat step 9 with each of the other concentrations prepared in step 8 and with a sample from U.
- Put of H into each of the test-tubes.
- Put all the test-tubes into the boiling water-bath (set up in step 7). Leave for 2 minutes.
- After 2 minutes, remove the test-tubes and put them into the beaker labelled C and leave for a further 2 minutes to cool. You will need the boiling water-bath for step 16.
- After 2 minutes, put a small amount of A into each test-tube and repeat until there is no more fizzing. This neutralises the acid so that the Benedict's solution can work.
Note: there may be a residue of A in the bottom of some of the test-tubes. This will not affect the results.
- Put of Benedict's solution into the test-tube containing sucrose solution (S).
- Put this test-tube into the boiling water-bath. Start timing.
- Measure the time taken to the first appearance of a colour change in the test-tube. If there is no colour change after , stop timing and record as 'more than 120'.
- Record the result in (b)(ii).
- Repeat step 15 to step 18 with each of the other concentrations of sucrose solution.
- Repeat step 15 to step 17 with the sample from U. Record the result for U in (b)(iii).
Prepare the space below and record your results for the known concentrations of sucrose solution.
State the time taken for the appearance of the first colour change for U.
time taken = ______
Use your results in (b)(ii) and (b)(iii) to estimate the concentration of sucrose in U.
estimated concentration in U = ______
Suggest how you would improve this procedure to obtain a more accurate estimate of the concentration of sucrose in U.
Using a more accurate procedure a student estimated the concentration of sucrose in a solution which had contained onion epidermis. The student's estimate was .
To find the water potential for this concentration of sucrose solution a graph needs to be plotted for known water potentials of different concentrations of sucrose solution as shown in Table 1.1.
Table 1.1
| concentration of sucrose solution / | water potential / |
|---|---|
| 1.0 | -3.25 |
| 0.8 | -2.60 |
| 0.6 | -1.95 |
| 0.4 | -1.30 |
| 0.2 | -0.65 |
You are required to use a sharp pencil for graphs.
Complete the graph, including axes labels, using the scale provided and using the data in Table 1.1.
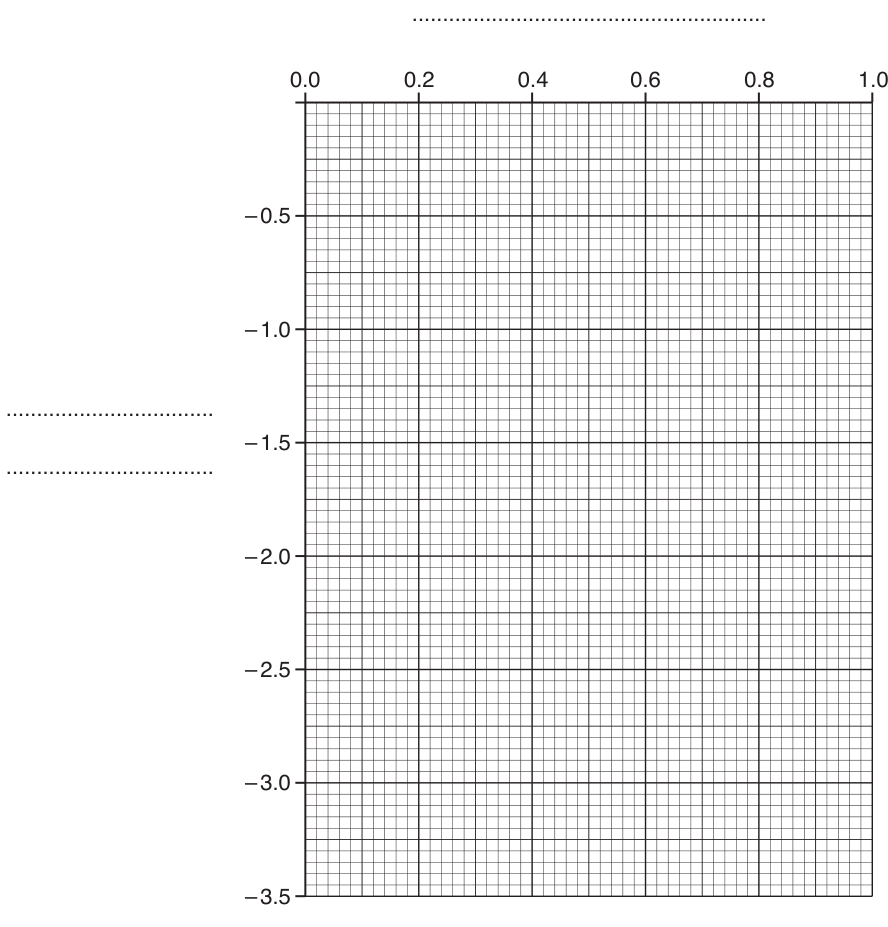
Use your graph to estimate the water potential of the concentration of sucrose solution recorded by the student ().
Show on your graph how you estimated the water potential.
water potential = ______
Assuming the water potential in (c)(ii) produced the observations of the onion cells in your drawing in (a), explain the effect of the sucrose solution on the onion cells.
The rest of this paper
1 more questions- Q2Manipulation, Measurement and Observation · Presentation of Data and Observations · Analysis, Conclusions and Evaluation · Use of the Light Microscope17M