Biology 9700/31 — October/November 2016
Cambridge AS Level · Advanced Practical Skills · worked solutions for every part, with the mark scheme
Topics Manipulation, Measurement and Observation · Presentation of Data and Observations · Analysis, Conclusions and Evaluation · Use of the Light Microscope
Some people feel unwell after drinking animal milk. This is because they are unable to digest the reducing sugar lactose found in this milk. Other sources of milk, such as milk made from plant material, do not contain this reducing sugar and can be included in the diet instead.
You are required to:
- prepare different concentrations of reducing sugar solution, R, using serial dilution
- determine the concentration of reducing sugar in two samples of milk
- identify which milk would be the most suitable for a person who is unable to digest lactose.
You are provided with:
| labelled | contents | hazard | volume / |
|---|---|---|---|
| R | 1% reducing sugar solution | none | 50 |
| W | distilled water | none | 50 |
| Benedict's | Benedict's solution | none | 50 |
| M1 | milk | none | 40 |
| M2 | milk | none | 40 |
You are required to make a serial dilution of the 1% reducing sugar solution, R, which reduces the concentration by half between each successive dilution.
Decide how many different concentrations you will prepare for your serial dilution.
You will need to prepare of each concentration.
Fig. 1.1 shows the first two beakers you will use to make your serial dilution.
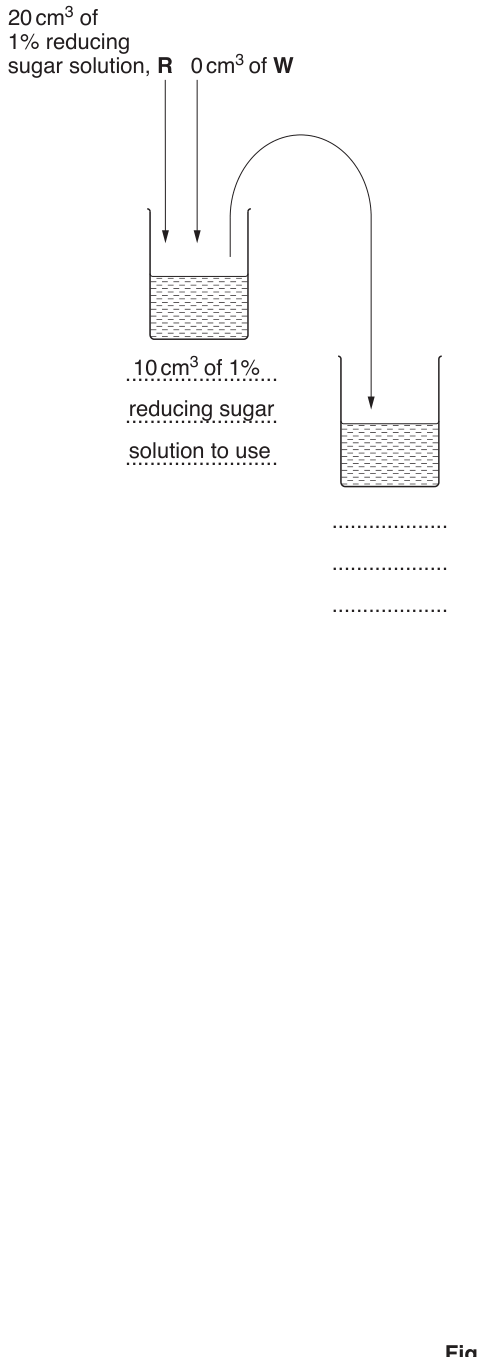
Complete Fig. 1.1 by drawing as many extra beakers as you need for your serial dilution.
For each beaker:
- state, under the beaker, the volume and concentration of the reducing sugar solution available for use in the investigation
- use one arrow, with a label above the beaker, to show the volume and concentration of reducing sugar solution added to prepare the concentration
- use another arrow, with a label above the beaker, to show the volume of W added to prepare the concentration.
Proceed as follows:
- Set up a water-bath and heat to boiling ready for step 6.
- Prepare the concentrations of reducing sugar solution as decided in (a)(i) and in Fig. 1.1.
You will be required to carry out the Benedict's test on each of the reducing sugar solutions you have prepared. You will use of reducing sugar solution for each test.
State the volume of Benedict's solution you will use for each reducing sugar test.
Explain why you have selected this volume.
volume of Benedict's solution = ______
explanation
- Put of 1% reducing sugar solution into a test-tube.
- Put the volume of Benedict's solution you stated in (a)(ii) into the same test-tube.
- Shake the test-tube gently to mix the contents.
- Put this test-tube into the boiling water-bath (prepared in step 1) and record in (a)(iii) the time taken for the first appearance of a colour change.
If there is no colour change after , stop timing and record as 'more than 90'.
- Repeat step 3 to step 6 for each of the other concentrations of reducing sugar that you prepared in step 2.
Prepare the space below and record your results.
A student carried out step 1 to step 7 and recorded the result for one of the concentrations as .
Calculate the rate of this reaction.
You may lose marks if you do not show your working.
rate = ______
You are required to find the concentration of reducing sugar in two samples of milk, M1 and M2, using Benedict's solution.
State the variables that you will need to standardise so that you can compare the results of the Benedict's test on M1 and M2 with those recorded in (a)(iii).
- Repeat step 3 to step 6 for each of M1 and M2 and record your results in (a)(vi).
Record your results for M1 and M2.
M1 = ______
M2 = ______
Use your results in (a)(iii) to estimate the percentage concentration of reducing sugar in each of M1 and M2.
M1 = ______
M2 = ______
State which sample, M1 or M2, would be most suitable for a person who is unable to digest lactose. Give a reason for your answer.
sample = ______
reason
In most people the reducing sugar lactose is hydrolysed by an enzyme during digestion to produce monosaccharides which are absorbed into the blood.
Some people do not produce this enzyme. When they drink animal milk, the lactose is undigested.
Certain bacteria use the undigested lactose for respiration and produce hydrogen gas. This enters the bloodstream, and is transported to the lungs where it is breathed out (exhaled).
Scientists can measure the concentration of hydrogen in exhaled air.
A scientist gave a person who does not produce this enzyme a drink of animal milk. The effect of drinking milk containing lactose was investigated by measuring the concentration of hydrogen in exhaled air every 20 minutes for 80 minutes.
The results are shown in Table 1.1.
Table 1.1
| time after drinking milk containing lactose / minutes | concentration of hydrogen in exhaled air / ppm |
|---|---|
| 0 | 15 |
| 20 | 17 |
| 40 | 24 |
| 60 | 52 |
| 80 | 80 |
Plot a graph of the data shown in Table 1.1.
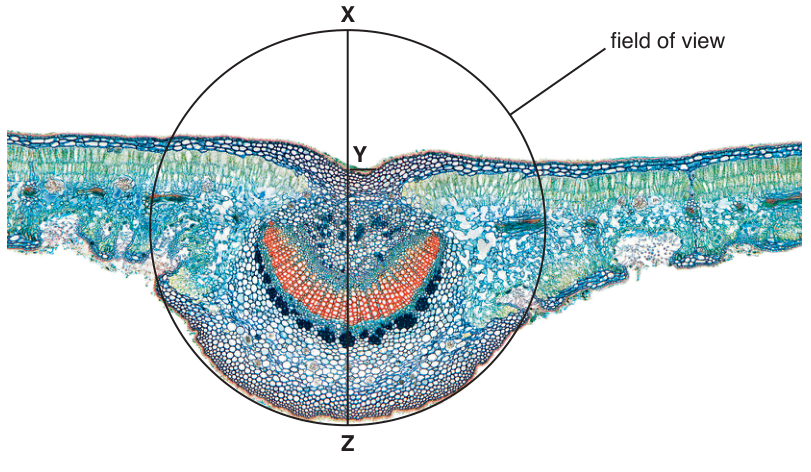

Fig. 1.2 is a photomicrograph of a stained transverse section through an animal organ. The bacteria that use lactose may be found in the lumen of this organ.
You are not expected to be familiar with this specimen.
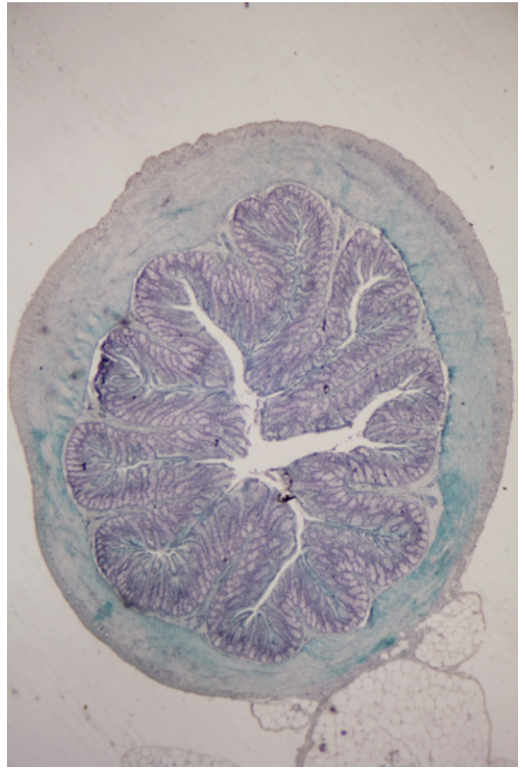
Draw a large plan diagram of the half of the organ shown by the shaded area in Fig 1.3.
You are expected to draw the correct shape and proportions of the different tissues.
The rest of this paper
1 more questions- Q2—17M